
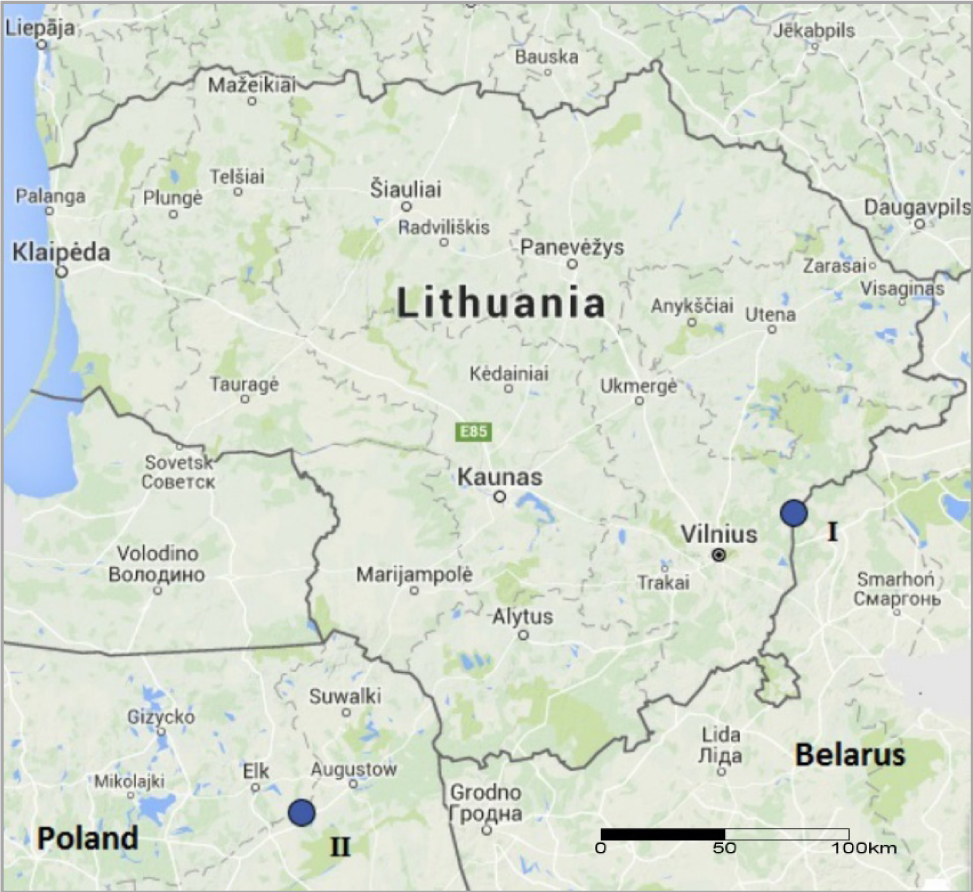
Fig. 1
Study sites: Lake Karackiai, Lithuania (I) and Lake Rajgrod Poland (II).
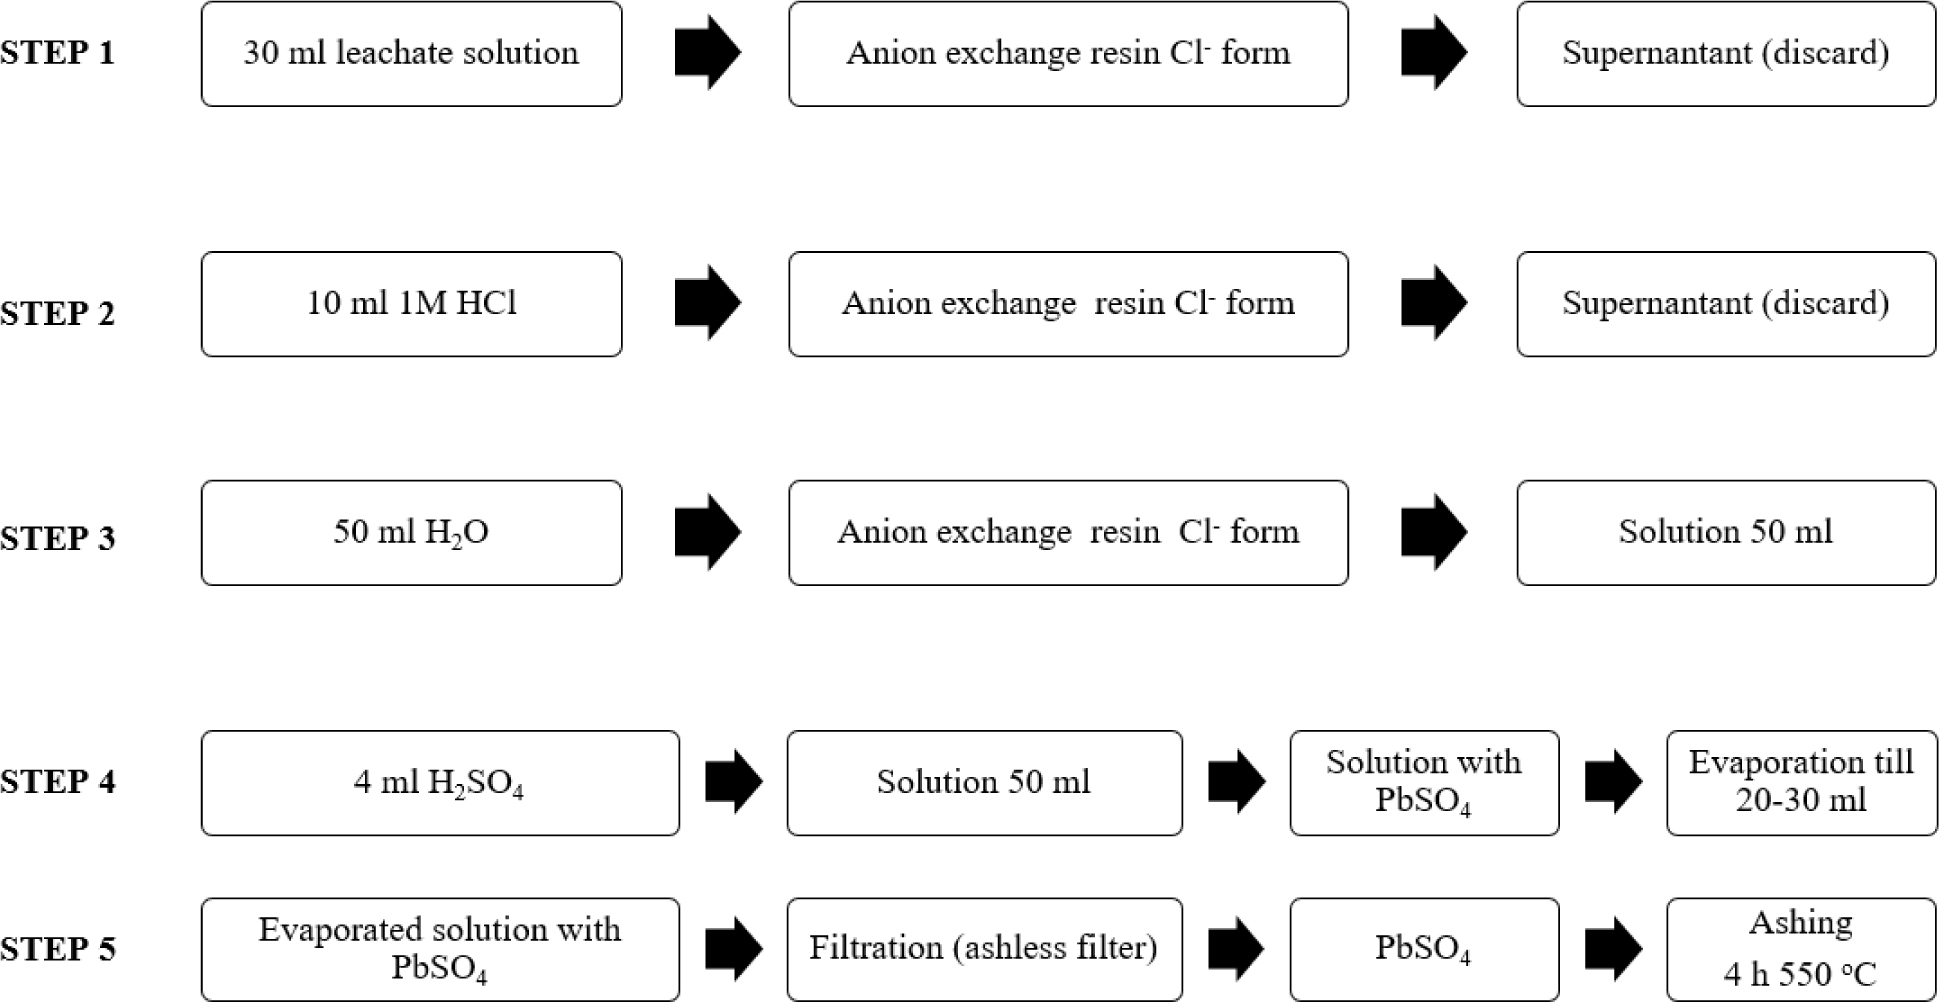
Fig. 2
Scheme of 210Pb separation procedure
Table 1
Comparison of investigated radiochemical procedures.
| Procedure | #1 | #2 | #3 |
|---|---|---|---|
| Pb2+ carrier | Radiochemical yield | ||
| 72 ± 6% | 77 ± 4% | 76 ± 4% | |
| Precipitates of PbSO4 dissolved in | Solubility | ||
| 2 ml 6M ammonium acetate | 2 ml 3M ammonium acetate | 2 ml 0.5M EDTA/NaOH | |
| + | + | + | |
| 18 ml scintillation cocktailOptiphase nisaie 3 | Homogeneity | ||
| PbSO4 in 2 ml 6M ammonium acetate | PbSO4 in 2 ml 3M ammonium acetate | PbSO4 in 2 ml 0.5M EDTA/NaOH | |
| + | + | – | |
| 210Pb tracer | Radiochemical yield | ||
| 70 ± 5% | 73 ± 8% | 70 ± 6% | |
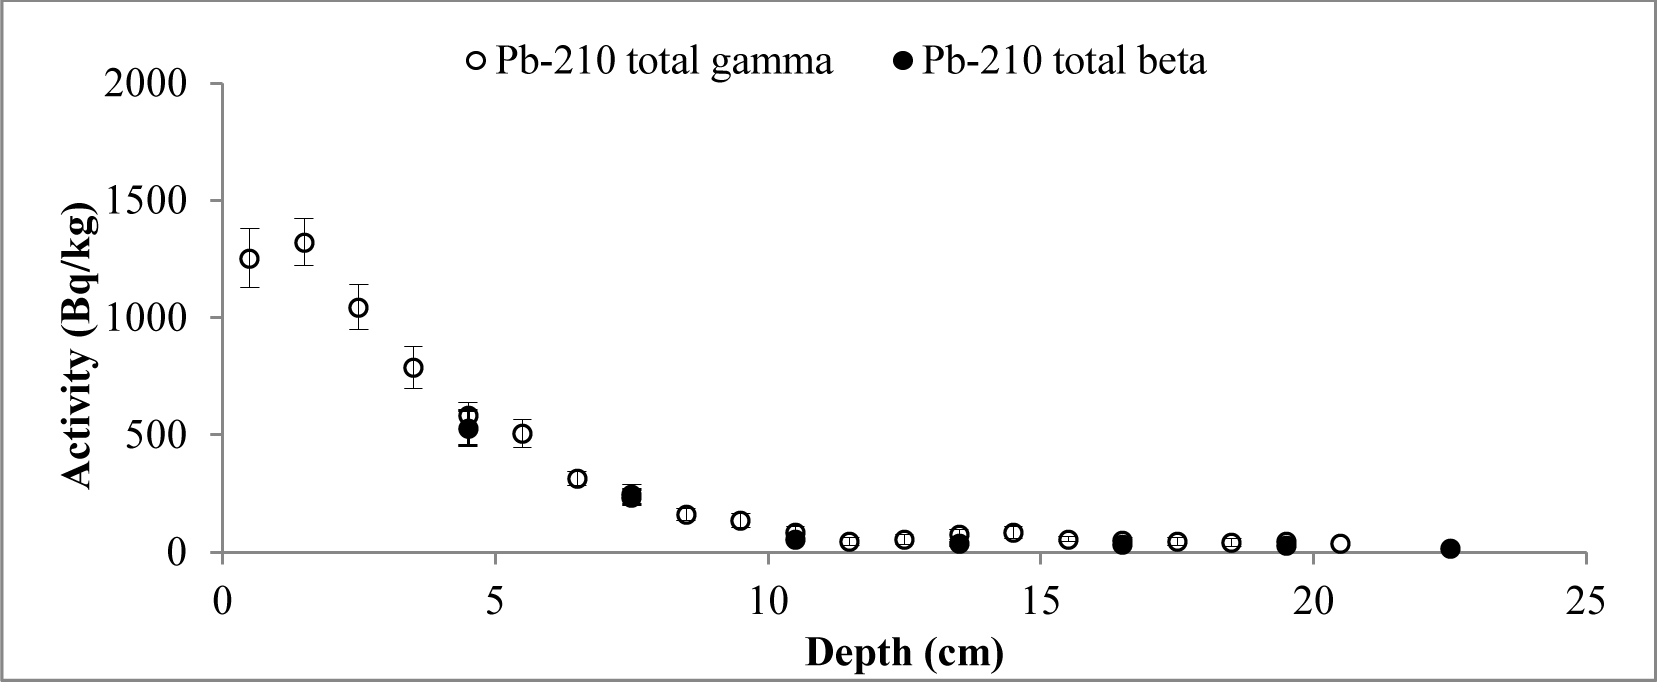
Fig. 3
Distribution of the total 210Pb measured by two methods versus core depth of Lake Karackiai (Lithuania).
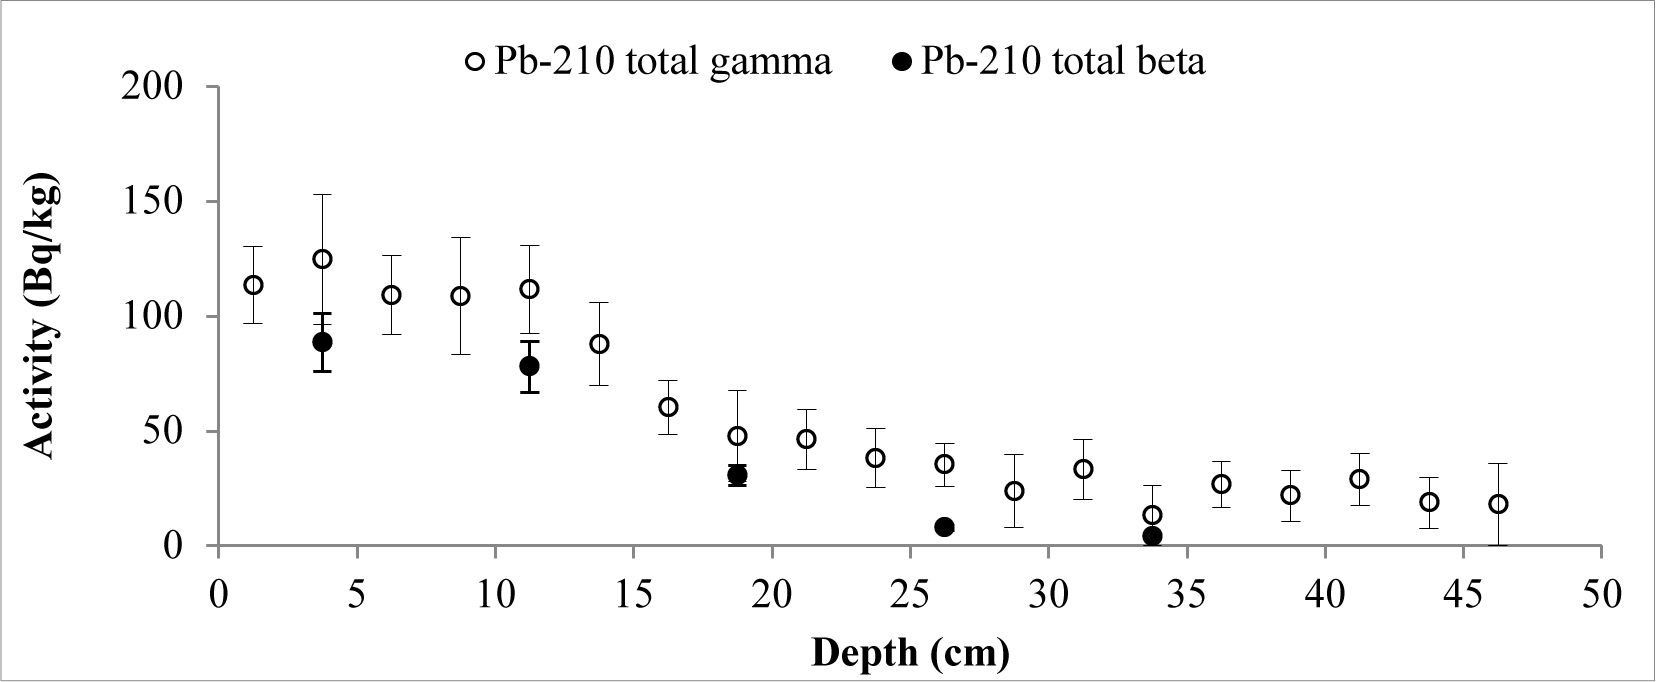
Fig. 4
Distribution of the total 210Pb measured by two methods versus core depth of Lake Rajgrod (Poland).
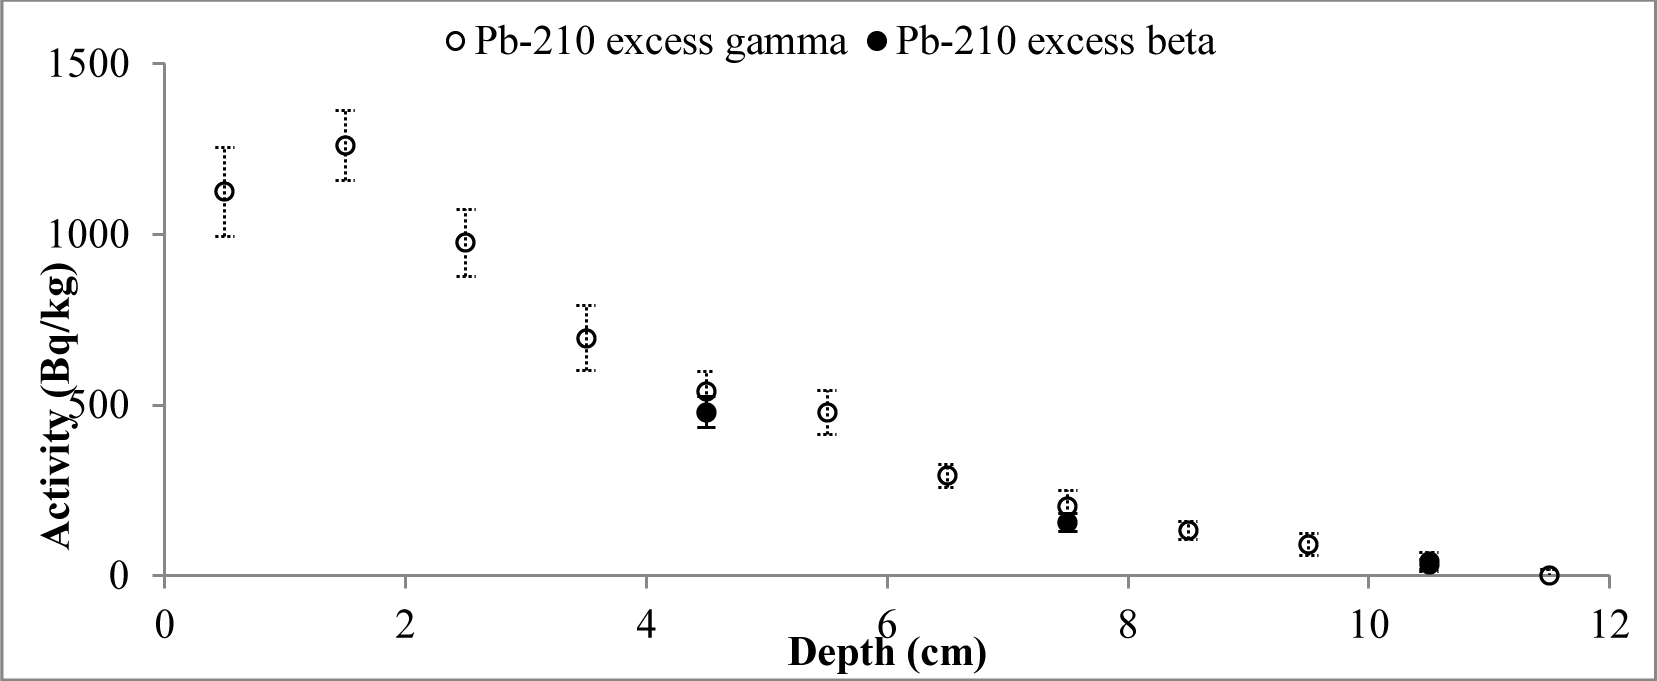
Fig. 5
Distribution of the 210Pb excess versus core depth for Lake Karackiai (Lithuania).
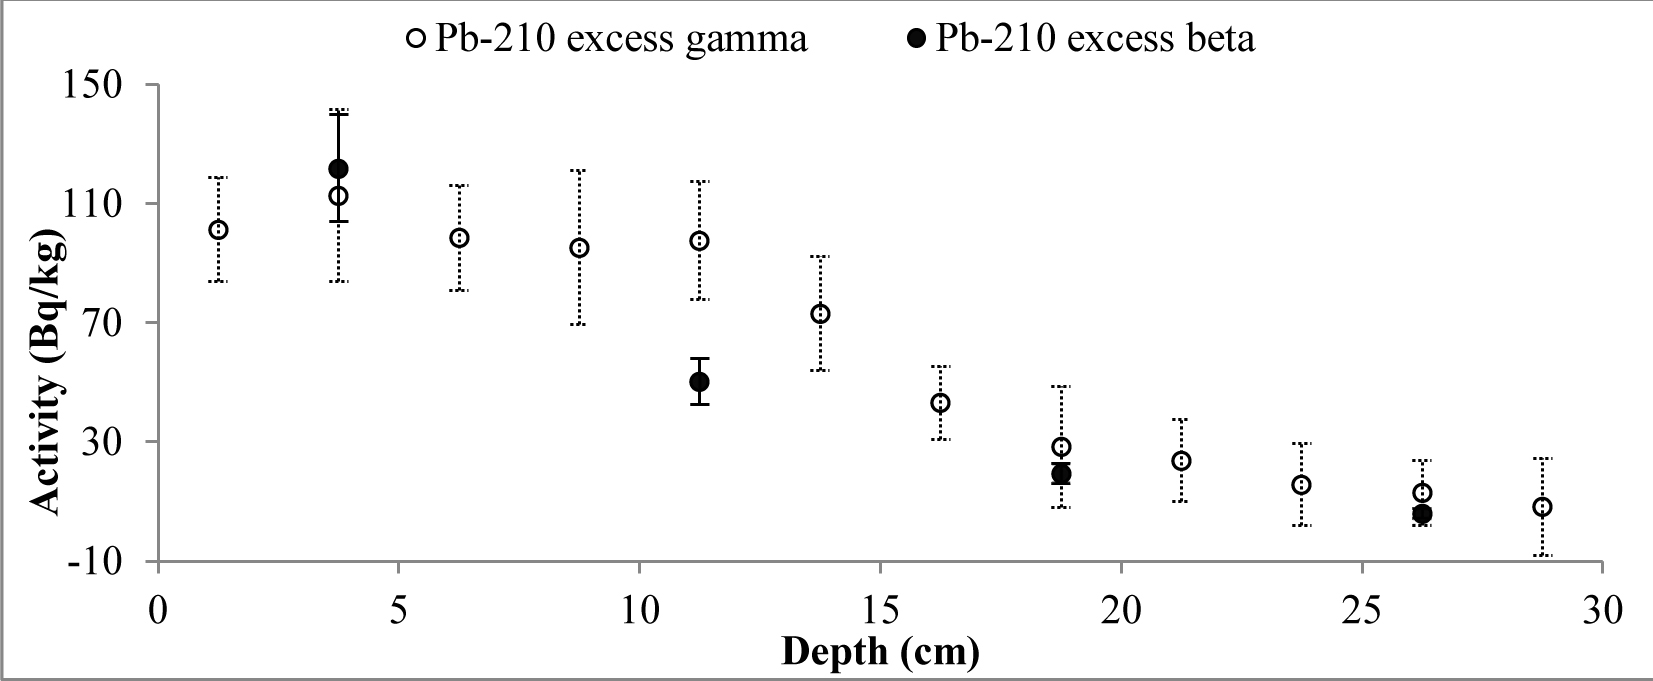
Fig. 6
Distribution of the 210Pb excess versus core depth for Lake Rajgrod (Poland).
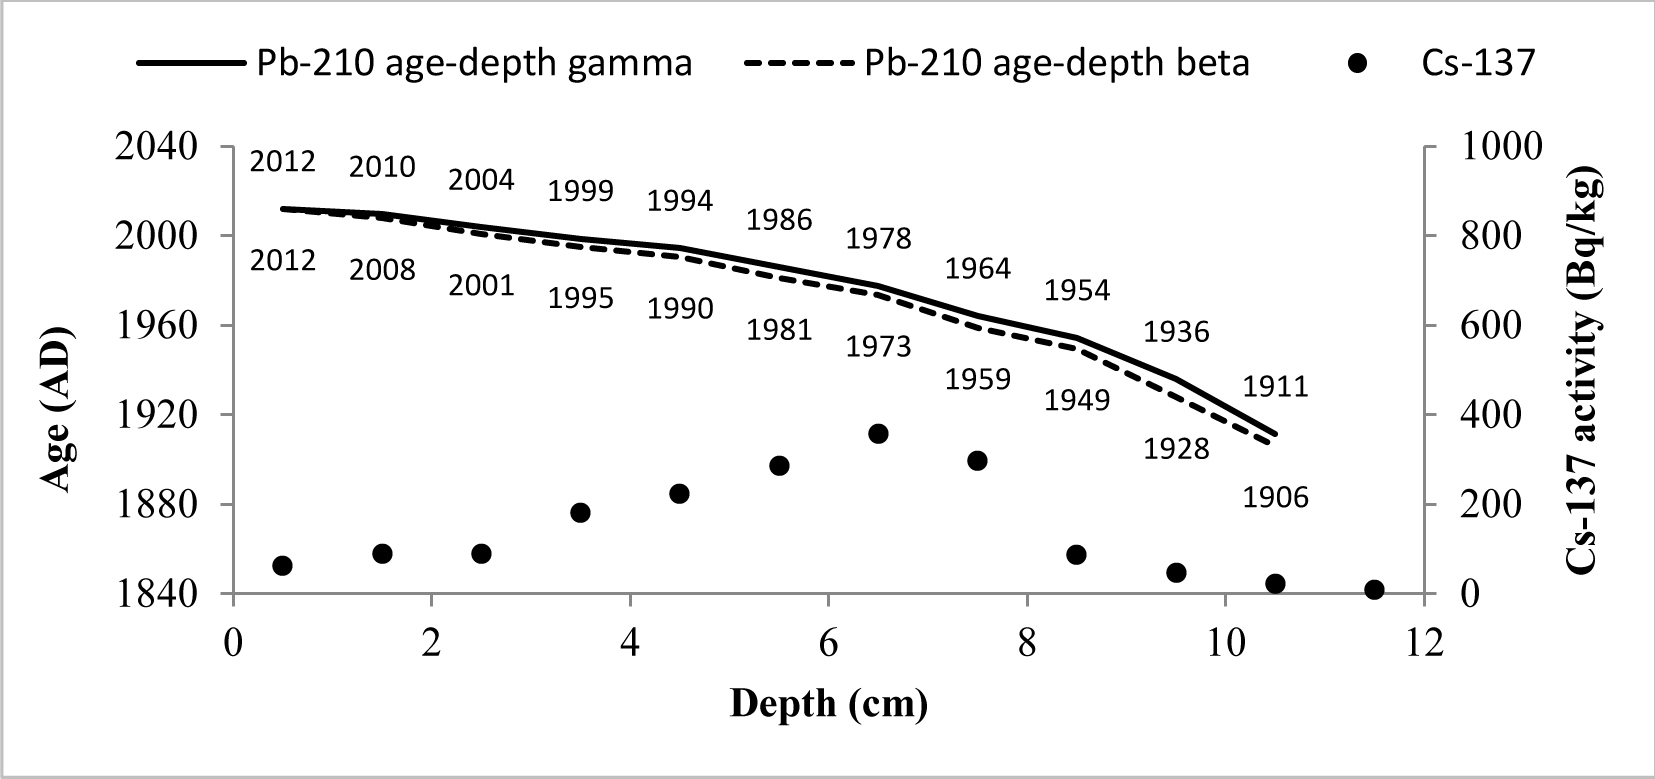
Fig. 7
CRS model 210Pb dates versus depth for Lake Karackiai core. There are also shown 137Cs activity changes versus depth and dates derived from 210Pb CRS model.
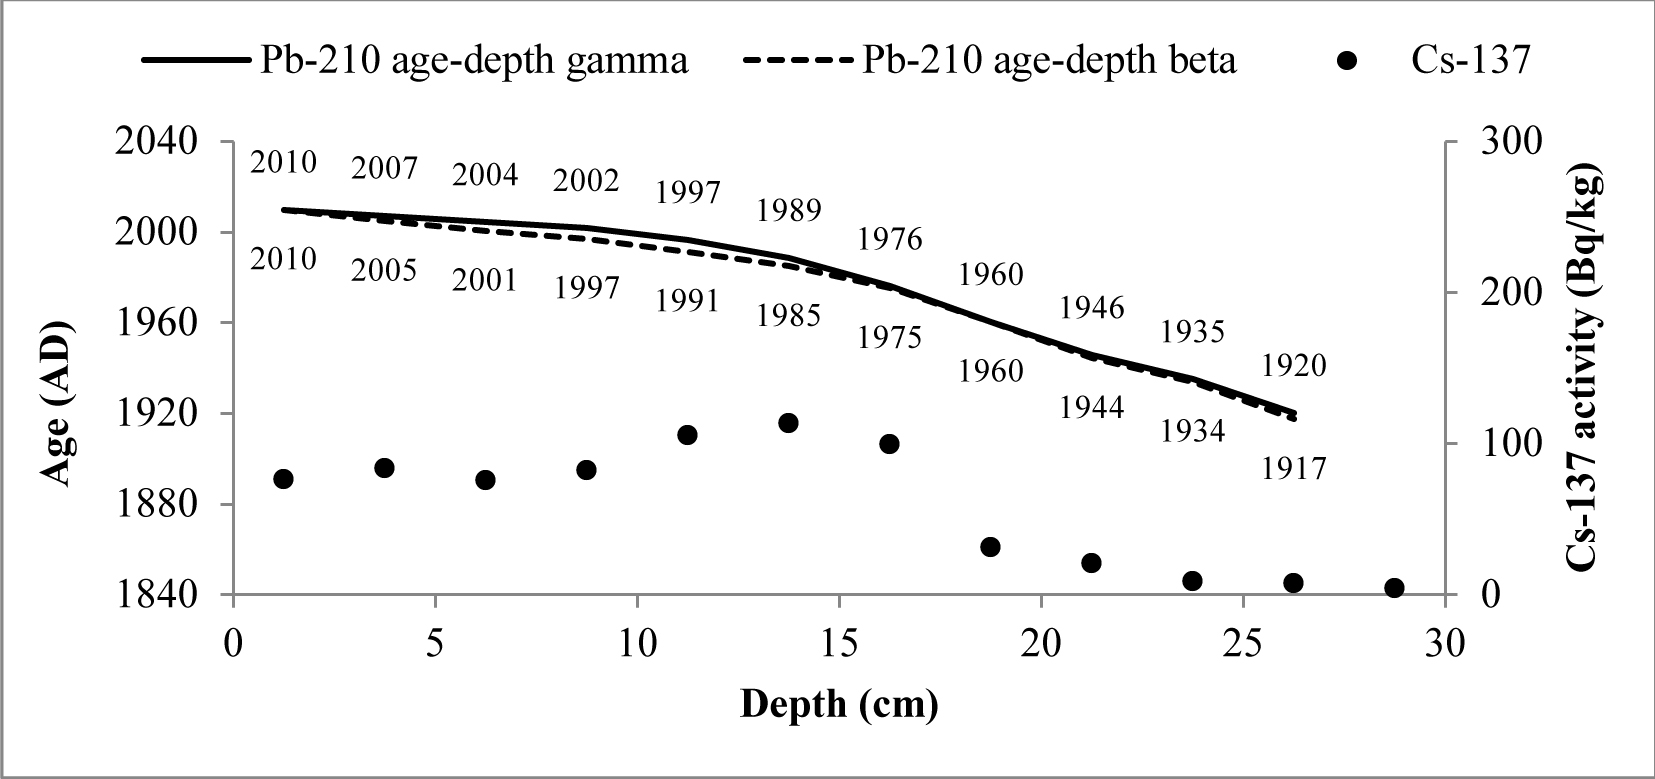
Fig. 8
CRS model 210Pb dates versus depth for Lake Rajgrod core. There are also shown 137Cs activity changes versus depth and dates derived from 210Pb CRS model.