
Table 1
Application of tree-ring analysis to earthquake studies. Direct and indirect effects are presented under a “process-effect-response” model. Various aspects of studying growth disturbances in trees affected by geomorphic processes are analyzed in (Stoffel and Bollschweiler, 2008) and application of tree-ring analysis to paleoseismology is discussed in detail by Jacoby (1997).
| Process | Effect | Response |
|---|---|---|
| Primary earthquake effects (tectonic deformations) | ||
| rupturing | splitting the trunk, root system damage | suppression, missed rings, mortality |
| tectonic scarp formation | tilting of stems | reaction wood formation |
| Secondary earthquake effects (mass movements) | ||
| slope failures, devastating mass movements | elimination of the entire forest stand | recolonization of bare surface |
| landslides, rock falls, debris flows | tilting of stems | reaction wood formation |
| stem burial | suppression, mortality, exceptionally – growth increase in case of rich nutrition and water supply | |
| root exposure | growth suppression, mortality | |
| wood penetrating injuries, scars | callus tissue formation and overgrowing the wound | |
| decapitation, elimination of branches | growth suppression | |
| Side effects | ||
| ground shaking | decapitation, root system and major limb damage | suppression, missed rings, mortality |
| change in hydrology | change in water table | suppression, growth increase |
| various earthquake induced surface processes | elimination of neighboring trees | the growth release in survivor trees |
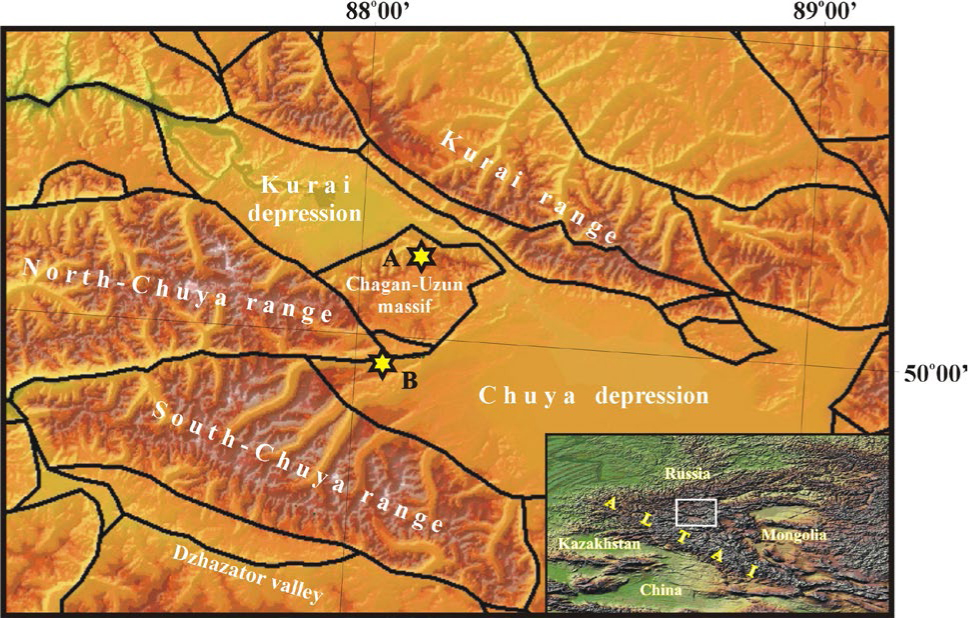
Fig. 1
Study area. Inset indicates the location of the SE Altai within the Altai Mountains. Neotectonic structure presented after Novikov, 2004. The studied sites in the Arydjan A) and Taldura B) valleys are shown with diamond.
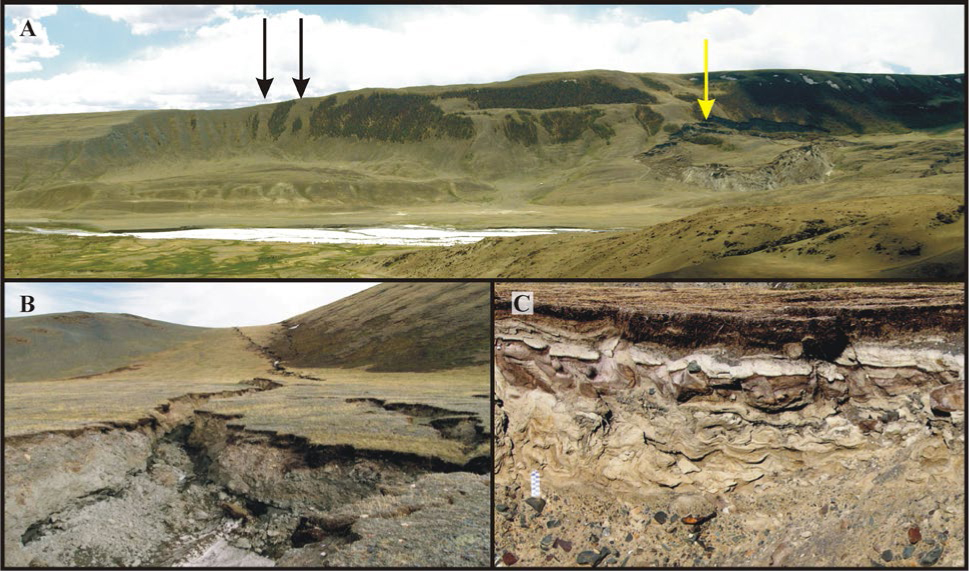
Fig. 2
Evidences of high regional seismicity.
A) Seismically induced landslides in Taldura valley (T1 in Fig. 4). Black arrows show paleolanslide and light arrow – the largest landslide triggered by the 2003 Chuya earthquake. B) Ruptures of the 2003 Chuya earthquake in the Uzuk stow (U in Fig. 4) going along saddle-back of tectonic origin. C) Holocene seismic convolutions in soft sediments in Taldura valley (T1 in Fig. 4).
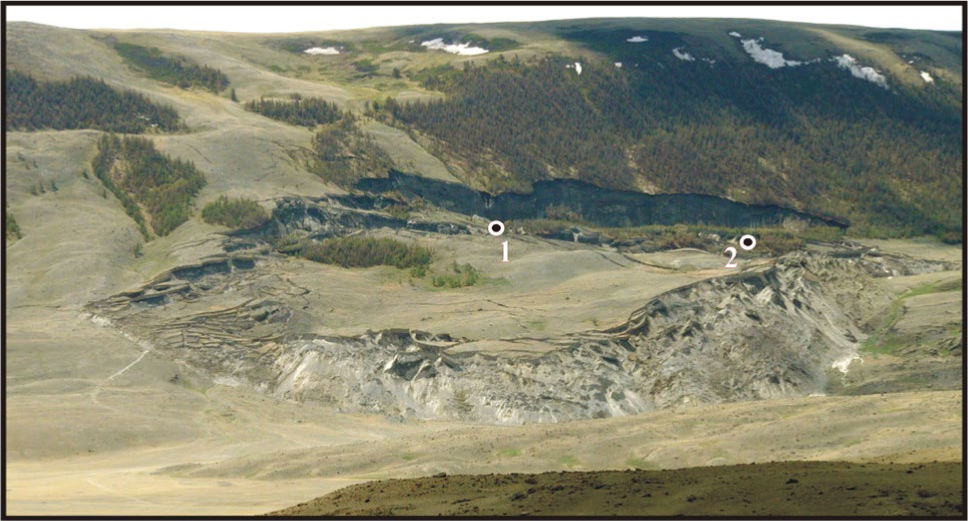
Fig. 3
The largest landslide triggered by the 2003 Chuya earthquake in Taldura valley (T1 in Fig. 4). Numbers indicate location of studied outcrops.
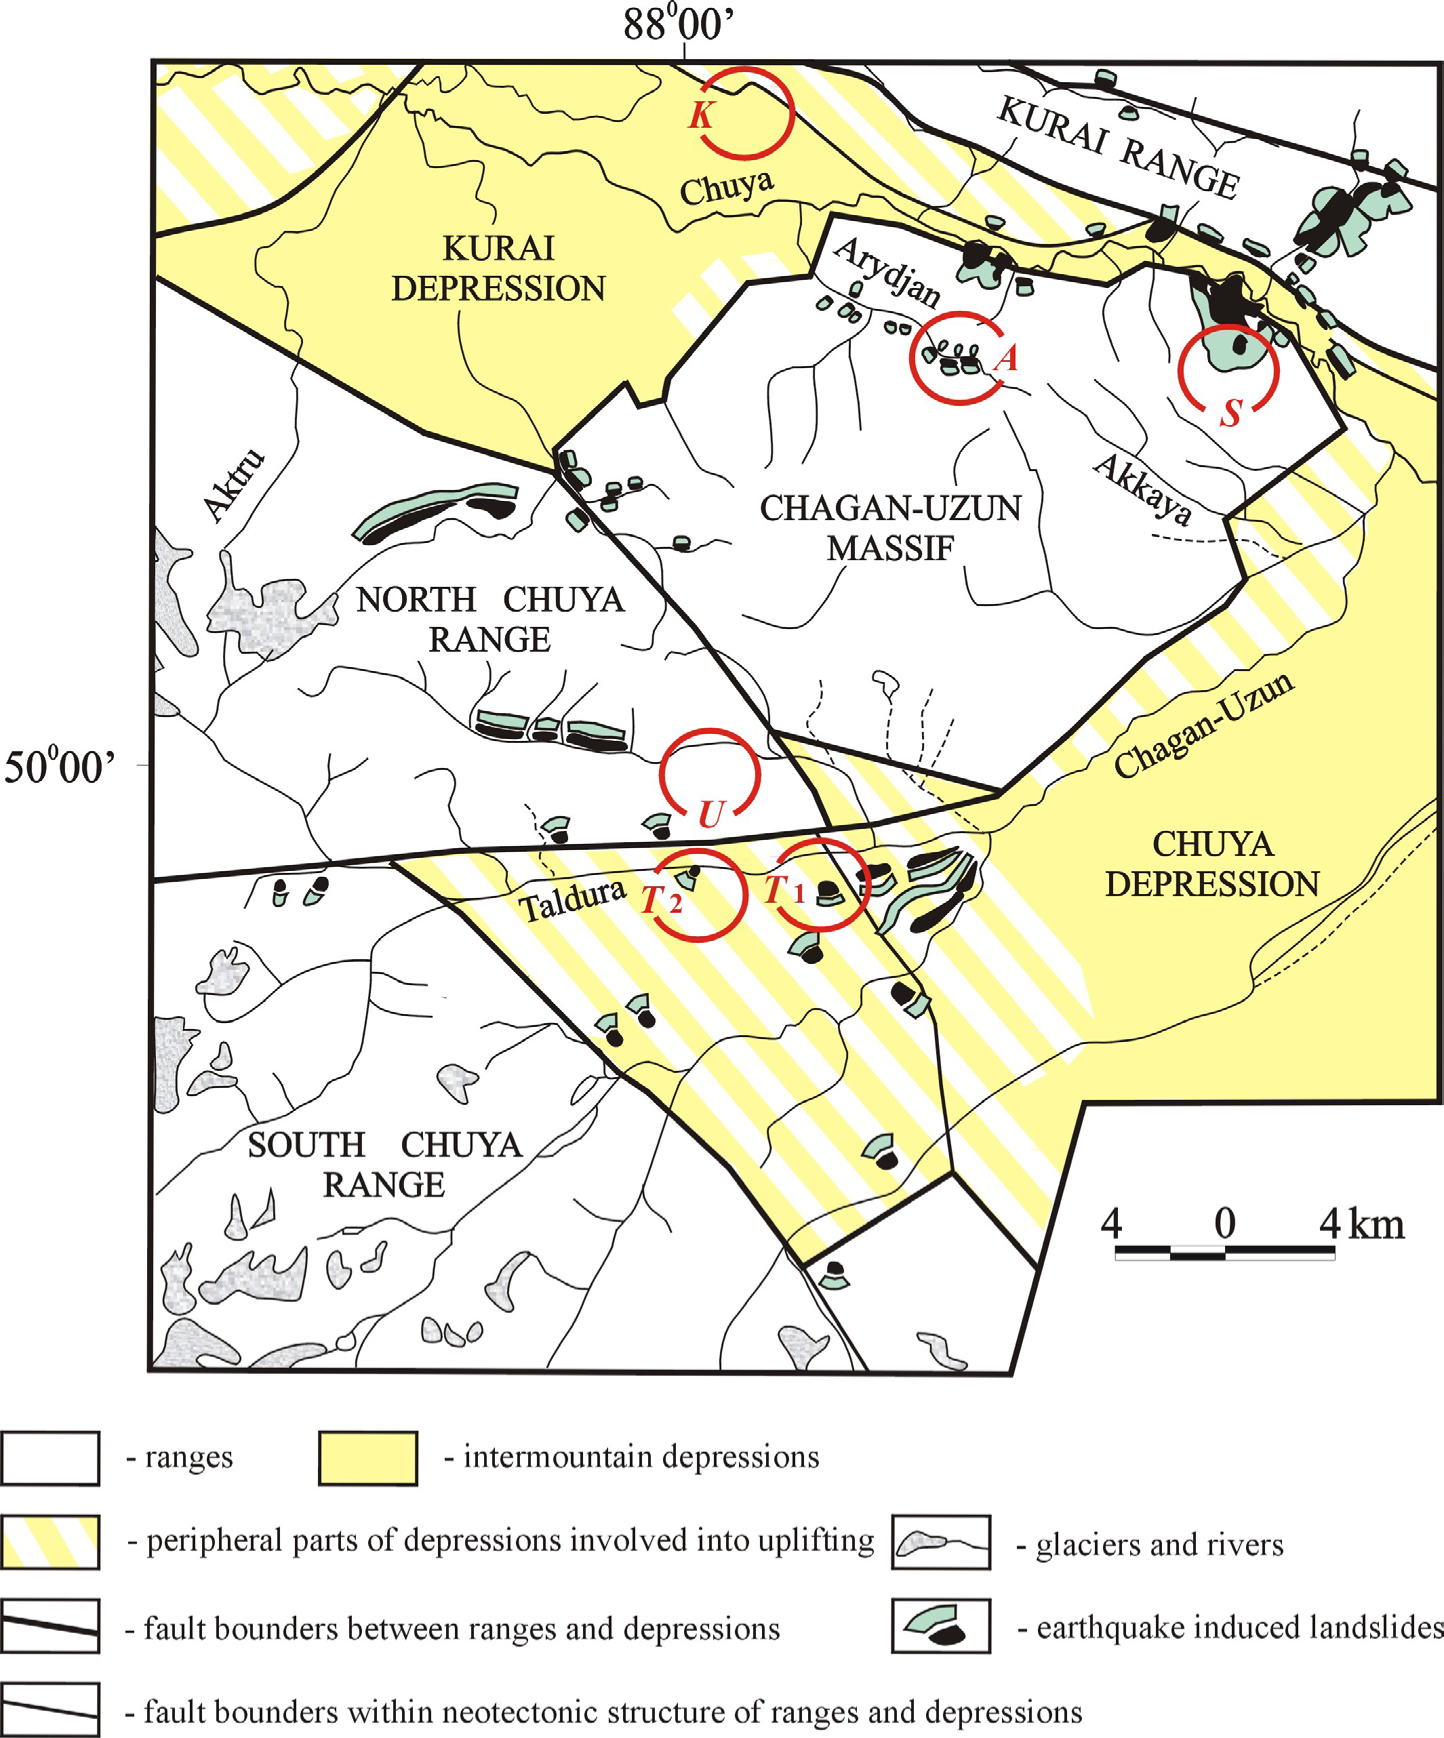
Fig. 4
Sketch neotectonic map showing the locations of study sites discussed in the paper.
A – Arydjan valley;
K – Southern flank of the Central Kurai neotectonic foreberg;
S – Sukor paleoseismic deformation;
T1 – the largest landslide triggered by the 2003 Chuya earthquake in Taldura valley;
T2 – Taldura valley;
U – Uzuk stow (Kuskunur – Taldura watershed).
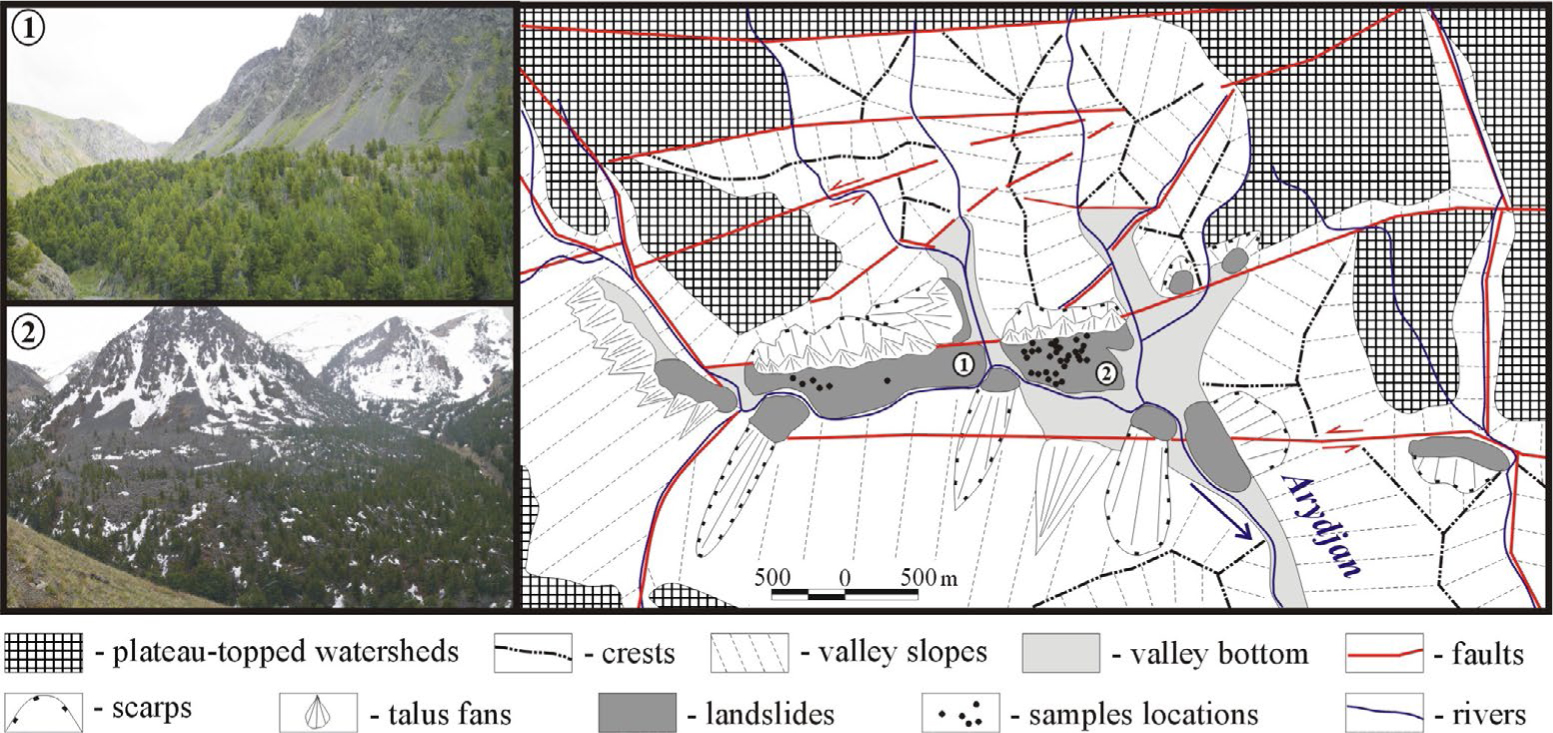
Fig. 5
Discussed complex of the earthquake triggered landslides in the Arydjan valley (A in Fig. 4).
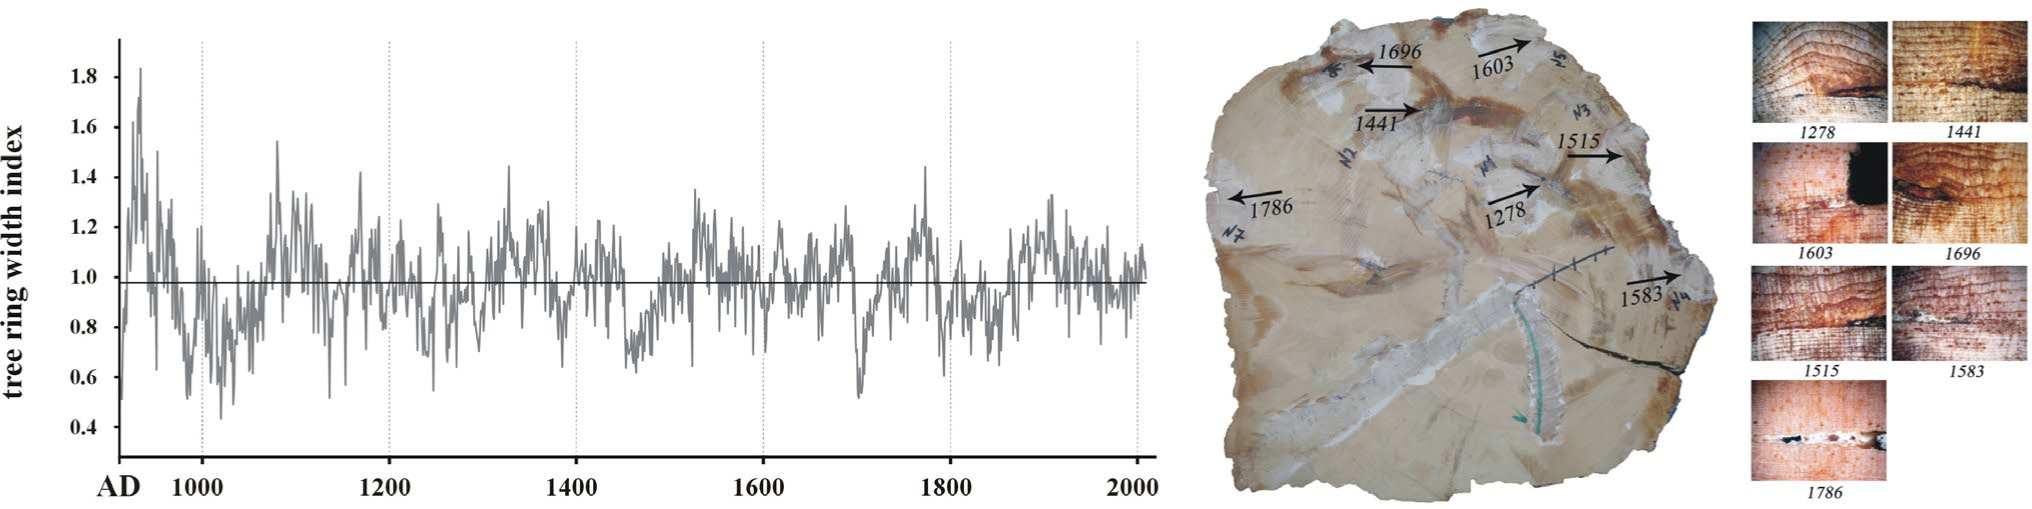
Fig. 6
Local 1154-years (AD 856–2009) TRC on Pinus sibirica Du Tour build for Arydjan valley (Agatova et al., 2014b). On the left – tree-ring growth index. In the center, one of collected discs demonstrates numerous wood penetrating injurious on the slope facing and lateral sides of the trunks (photo made by Barinov V. V.). On the right – anomalies of tree-rings (callus tissue) is a reaction on frontal and tangent impact of falling stones (photo made by Barinov V. V.).
Table 2
Radiocarbon dates used for estimating the recurrence interval of strong prehistoric earthquakes in the SE Altai.
| Calibrated age (cal BP) | ||||||
|---|---|---|---|---|---|---|
| Sample Lab. cod | Location Fig. 4 | Sample type | 14C age* (BP) | Interpretation | ||
| Significance level 68.2% | Significance level 95.4% | |||||
| IGAN 4090 | T1 | seismically cut fossil soil exhumed in rupture of the 2003 Chuya earthquake | ha 2240±60 | 2340–2290 (17.3%) 2260–2150 (50.9%) | 2360–2110 (95.4%) | low possible date of strong earthquake that cut and buried soil layer |
| IGAN 4092 | T1 | char coal from seismically deformed fossil soil | cc 1460±70 | 1420–1290 (68.2%) | 1530–1280 (95.4%) | low possible date of strong earthquake that deformed and buried soil layer |
| IGAN 4103 | T2 | paleosoils overlaid by colluvium sediments | ha 510±60 | 630–600 (13.3%) 560–500 (54.9%) | 660–460 (95.4%) | period of tectonic respite and soil formation at the foot of the steep slope |
| IGAN 4104 | T2 | paleosoils overlaid by colluvium sediments | ha 600±60 | 650–580 (50.8%) 570–540 (17.4%) | 670–520 (95.4%) | period of tectonic respite and soil formation at the foot of the steep slope |
| IGAN 4105 | T1 | seismically cut fossil soil exhumed in rupture of the 2003 Chuya earthquake | ha 950±60 | 930–790 (68.2%) | 970–730 (95.4%) | low possible date of strong earthquake that cut and buried soil layer |
| IGAN 4106 | T2 | paleosoils overlaid by colluvium sediments | ha 710±70 | 730–630 (50.6%) 600–560 (17.6%) | 770–540 (95.4%) | period of tectonic respite and soil formation at the foot of the steep slope |
| SOAN 8416 | T1 | seismically cut peat layer covered lacustrine sediments with seismic convolutions | ha 2040±55 | 2100–2080 (3.9%) 2070–1920 (64.3%) | 2150–1880 (95.4%) | low possible date of earthquake that formed convolution structures |
| SOAN 8417 | T1 | charcoal from paleosoil layer | cc 2755±40 | 2880–2780 (68.2%) | 2950–2770 (95.4%) | low possible date of strong earthquake that deformed and buried soil layer |
| SOAN 8418 | T1 | fossil soil with charcoal overlaid by colluvium sediments | ha 2535±40 | 2750–2690 (26.8%) 2640–2610 (9.0%) 2590–2500 (32.5%) | 2750–2480 (95.4%) | period of tectonic respite and soil formation |
| SOAN 8419 | T1 | fossil soil with charcoal overlaid by colluvium sediments | ha 3335±40 | 3640–3550 (48.6%) 3540–3490 (19.6%) | 3690–3660 (3.9%) 3650–3460 (91.5%) | period of tectonic respite and soil formation |
| SOAN 8425 | K | wood fragment from humified loam layer overlaid by colluvium sediments | w 845±35 | 790–700 (68.2%) | 900–860 (6.4%) 830–810 (1.1%) 800–680 (87.9%) | stabilization period of the alluvial-colluvial fan at the foot of the rocky slope |
| SOAN 8549 | K | humified loam layer overlaid by colluvium sediments | ha 3275±80 | 3590–3400 (68.2%) | 3700–3340 (95.4%) | stabilization period of the alluvial–colluvial fan at the foot of the rocky slope |
| SOAN 8658 | T1 | wood fragments from fossil peat layer in the proximal part of the giant landslide triggered by the 2003 Chuya earthquake | w 650±65 | 670–620 (31.9%) 610–550 (36.3%) | 690–530 (95.4%) | upper possible date of strong earthquake that coursed peat bog formation |
| SOAN 8659 | T1 | contemporary soil overlapping seismically cut paleosoils | ha 250±30 | 320–280 (50.2%) 170–150 (18.0%) | 430–360 (15.0%) 330–270 (55.2%) 190–140 (21.3%) 20–0 (4.0%) | upper possible date of strong paleoearthquake |
| SOAN 8663 | T1 | seismically cut fossil soil with charcoal | ha 2380±65 | 2680–2640 (9.5%) 2610–2600 (1.6%) 2500–2340 (57.0%) | 2720–2310 (95.4%) | low possible date of strong earthquake that cut and buried soil layer |
| SOAN 8664 | T1 | fossil peat layer with charcoal in the proximal part of the giant landslide triggered by the 2003 Chuya earthquake | ha 1035±45 | 1050–1030 (4.6%) 990–910 (63.6%) | 1060–900 (87.2%) 870–800 (8.2%) | upper possible date of strong earthquake that coursed peat bog formation |
| SOAN 8665 | T1 | seismically cut fossil soil with charcoal | ha 2295±40 | 2360–2300 (55.0%) 2230–2200 (13.2%) | 2360–2290 (59.4%) 2270–2150 (36.0%) | low possible date of strong earthquake that cut and buried soil layer |
| SOAN 8666 | T1 | wood fragments from fossil soil layer | w 1935±35 | 1930–1860 (54.5%) 1850–1820 (13.7%) | 1990–1810 (95.4%) | low possible date of strong earthquake that deformed and buried soil layer |
| SOAN 8667 | T1 | wood fragments from fossil soil layer | w 2390±65 | 2680–2640 (10.5%) 2610–2590 (2.3%) 2500–2340 (55.4%) | 2720–2320 (95.4%) | low possible date of strong earthquake that deformed and buried soil layer |
| SOAN 8668 | T1 | wood fragments from fossil soil layer | w 2490±35 | 2720–2680 (13.1%) 2640–2490 (55.1%) | 2740–2430 (95.4%) | low possible date of strong earthquake that deformed and buried soil layer |
| SOAN 8669 | T1 | fossil soil with charcoal | ha 2540±50 | 2750–2690 (25.5%) 2640–2610 (8.4%) 2600–2500 (34.3%) | 2760–2460 (95.4%) | low possible date of strong earthquake that interrupt soil formation |
| SOAN 8670 | T1 | charcoal in sandy loams | cc 3785±45 | 4240–4090 (68.2%) | 4380–4370 (0.5%) 4360–4320 (1.6%) 4300–4060 (85.4%) 4050–3980 (7.9%) | intensification of slope processes |
| SOAN 8671 | T1 | charcoal in lacustrine sediments | cc 3765±45 | 4230–4080 (62.5%) 4030–4010 (5.7%) | 4290–4270 (1.1%) 4260–3980 (94.3%) | upper possible date of strong earthquake that coursed lake formation |
| SOAN 8672 | T1 | buried peat | ha 3590±45 | 3970–3940 (11.2%) 3930–3830 (57.0%) | 4080–4040 (3.3%) 4000–3810 (84.4%) 3800–3720 (7.7%) | upper possible date of strong earthquake that coursed peat bog formation |
| SOAN 8673 | T1 | buried peat layer in the proximal part of the giant landslide triggered by the 2003 Chuya earthquake | ha 770±40 | 730–670 (68.2%) | 770–660 (95.4%) | upper possible date of strong earthquake that coursed peat bog formation |
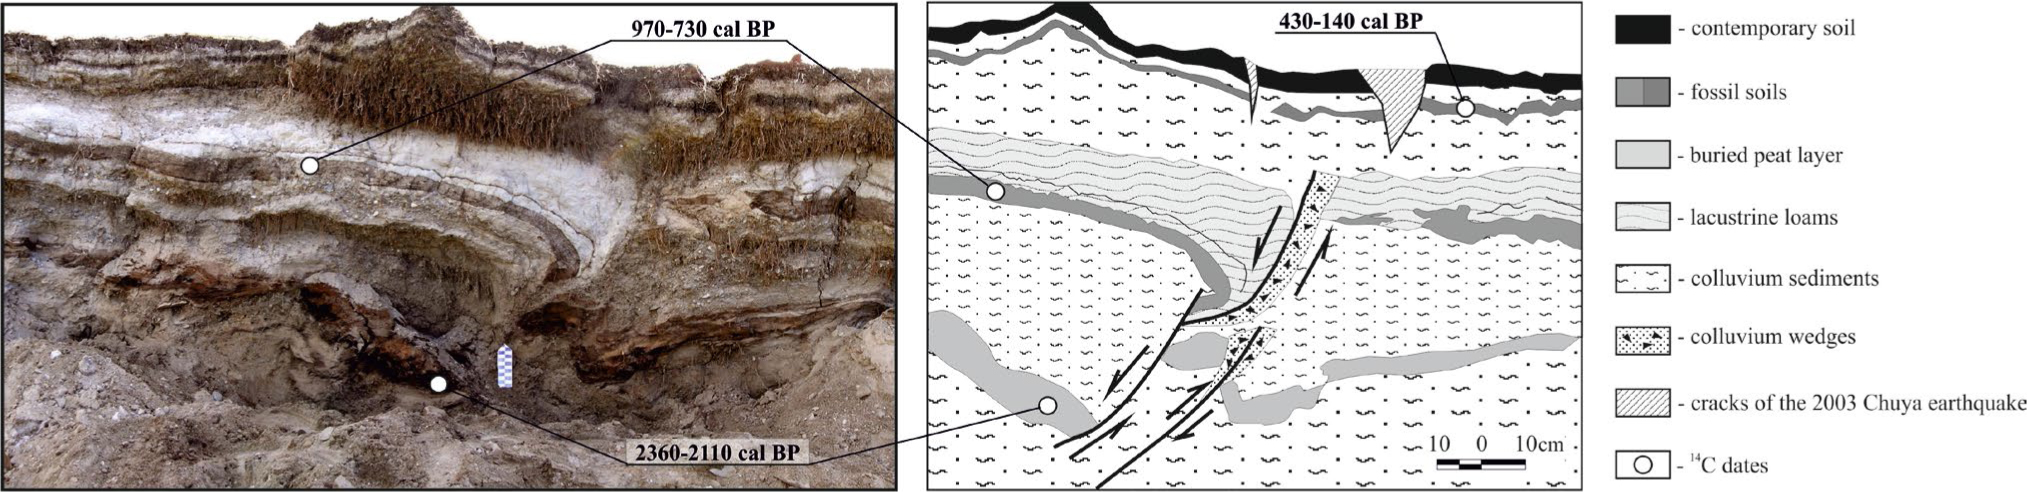
Fig. 7
Newly arisen outcrop in one of the scarps of the largest landslide triggered by the 2003 Chuya earthquake in the Taldura valley (location 1 in Fig. 3).
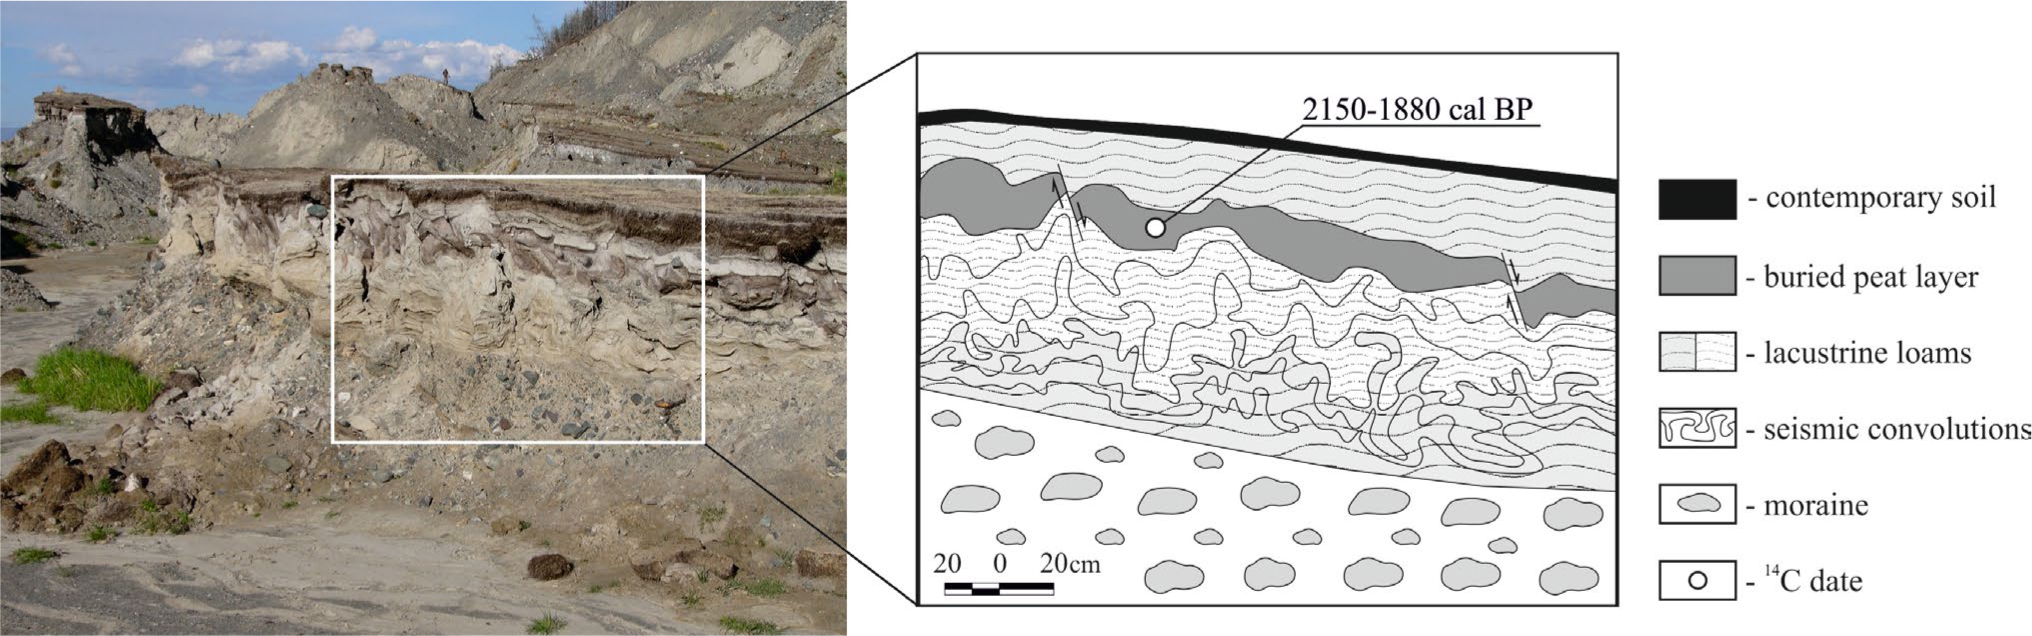
Fig. 8
Section of lacustrine sediments with the peat layer in the Taldura valley (location 1 in Fig. 3).
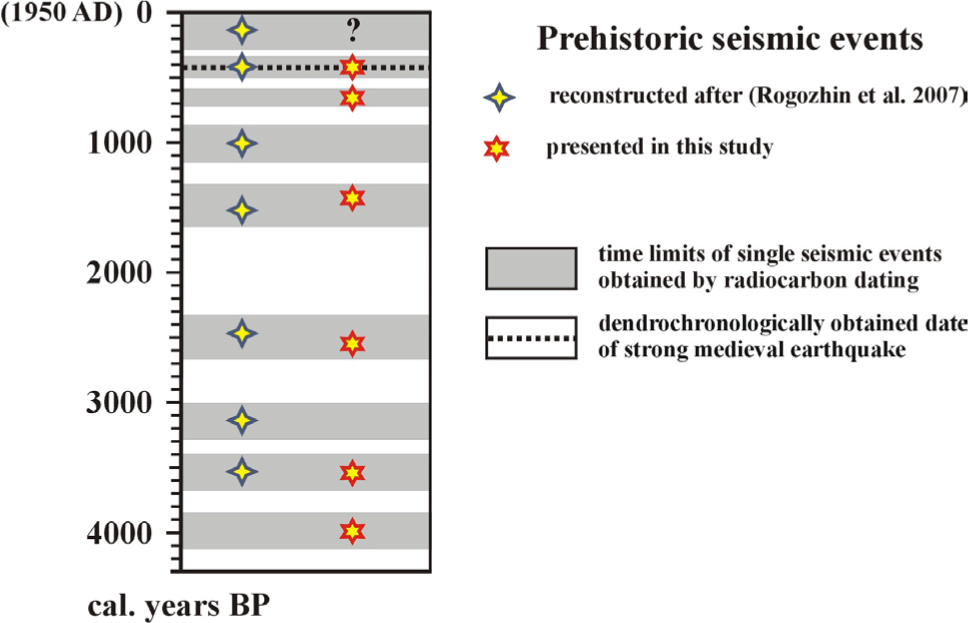
Fig. 9
Reconstructed dates of strong prehistoric earthquakes within the SE Altai, obtained by radiocarbon method and dendrochronological analysis.