
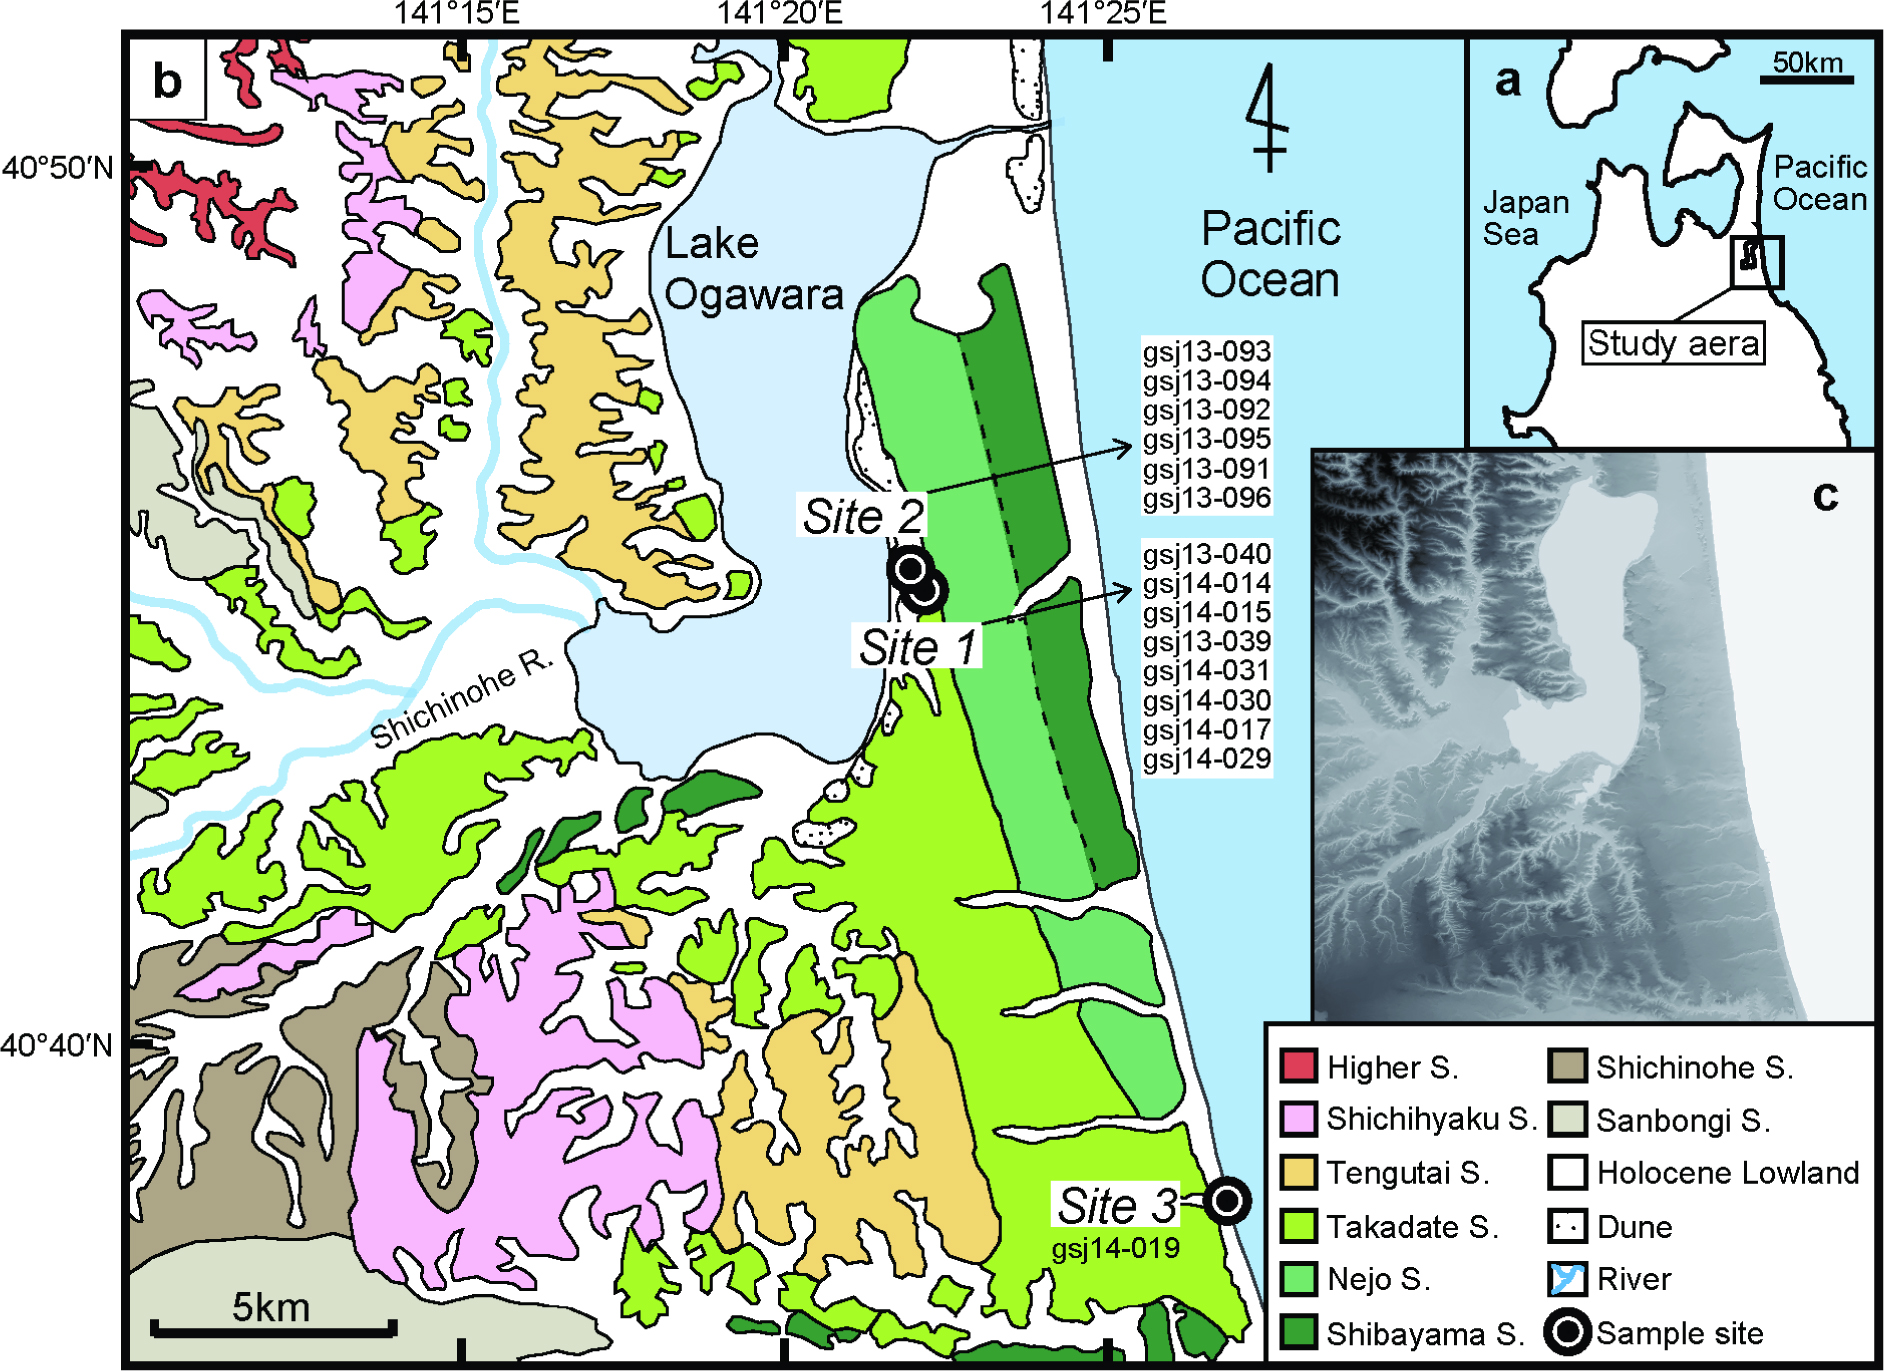
Fig. 1
(a) Location map of the Kamikita coastal plain, northeastern Japan. (b) Map showing the distribution of Late and Middle Pleistocene marine terraces and sampling sites (after Miyauchi, 1985, 1987). In the legend, surface is abbreviated a “S” The elevation range of each terrace is given in the text. (c) Digital elevation model of the Kamikita coastal plain based on 10-m-grid data from the Geospatial Information Authority of Japan. Lighter grays indicate lower elevations, and darker grays and black indicate higher elevations.
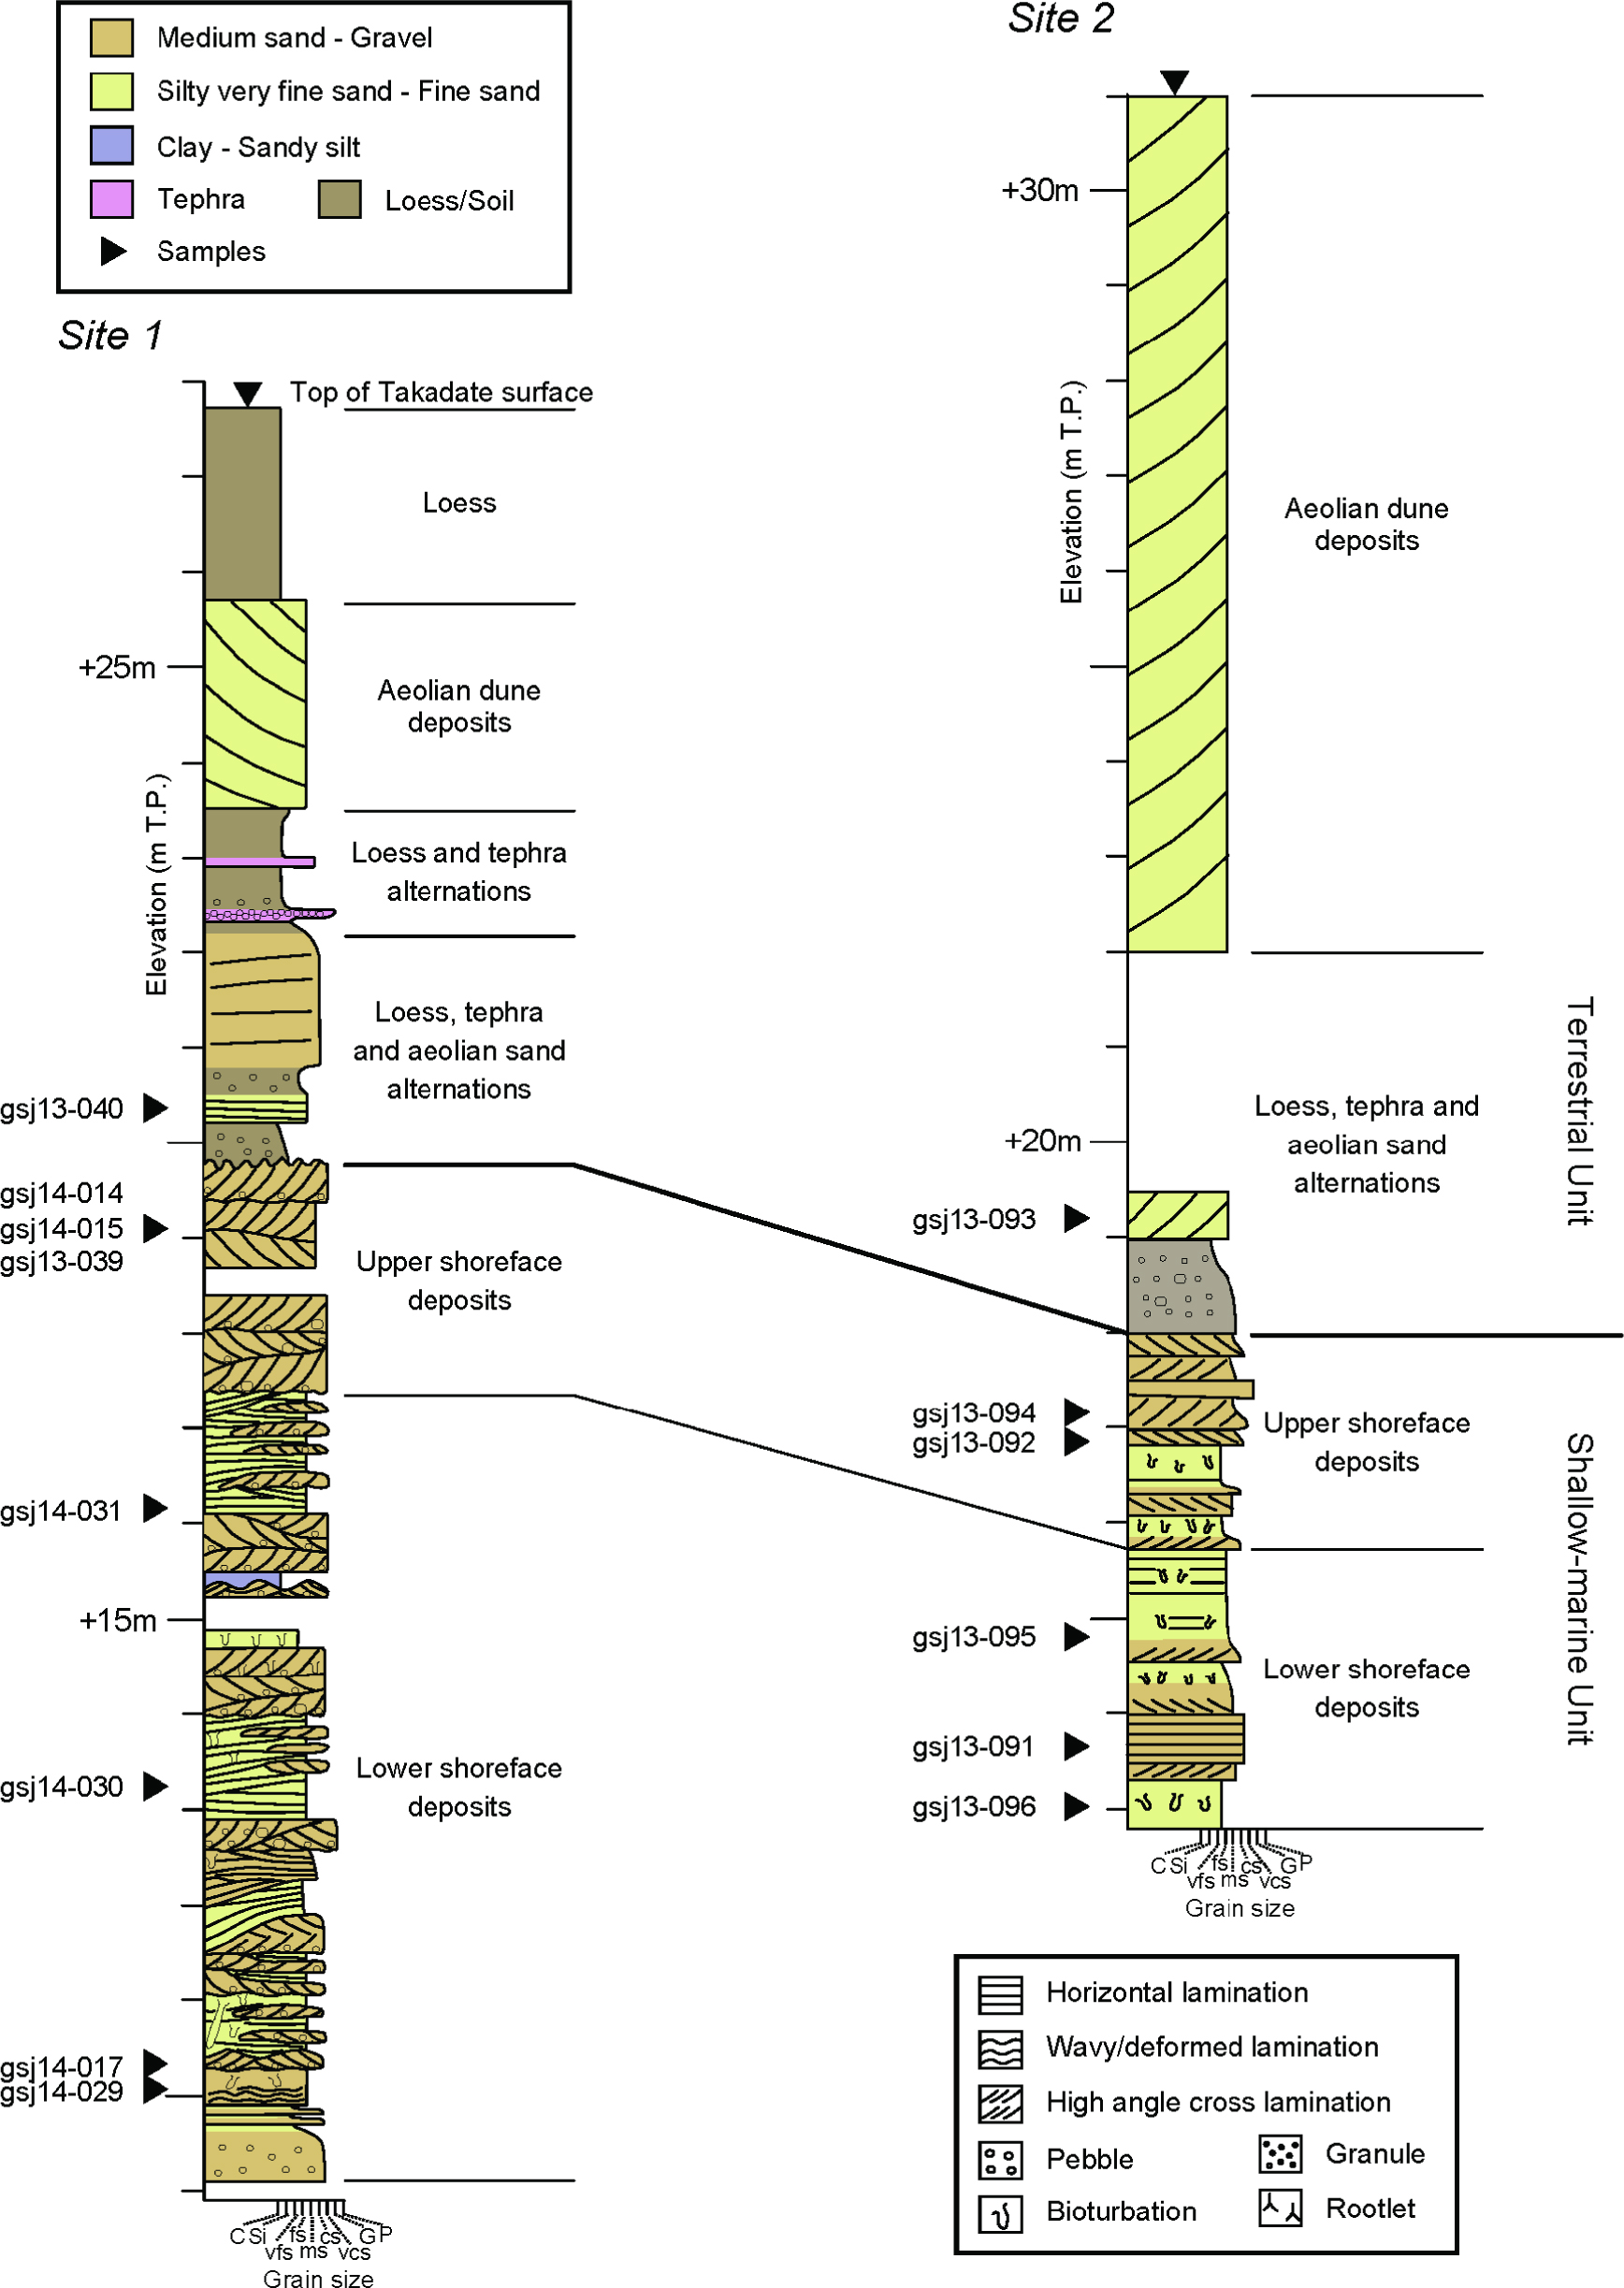
Fig. 2
Columnar sections from sites 1 and 2. Grain size is categorized into clay, silt, very fine sand, fine sand, medium sand, coarse sand, very coarse sand, granules, and pebbles (C, Si, vfs, fs, ms, cs, vcs, G, and P, respectively). The bold horizontal line represents the erosional surface between the terrestrial and subtidal facies deposits. T.P. (Tokyo Peil) is the standard datum for elevation measurements in Japan.
Table 1
Radioisotope concentration, water content, cosmic ray and dose-rate for sediment samples. Listed water content was natural value. The water content for dose rate calculation was estimated from the mean of natural and saturated (31.0%) water contents. For details see main text.
| Sample | Depth (m) | Radioisotope concentraion | Water Content (%) | Cosmic Dose Rate (Gy/ka) | Dose-rate (Gy/ka) | |||
|---|---|---|---|---|---|---|---|---|
| K (%) | Rb (ppm) | Th (ppm) | U (ppm) | |||||
| Site 1 | ||||||||
| gsj13-040 | 7.40 | 0.62 ± 0.06 | 20.8 ± 2.1 | 1.35 ± 0.14 | 0.38 ± 0.04 | 3. 0 | 0.10 | 1.57 ± 0.12 |
| gsj14-014 | 8.30 | 0.68 ± 0.07 | 23.2 ± 2.3 | 1.55 ± 0.16 | 0.44 ± 0.04 | 7.3 | 0.09 | 1.62 ± 0.12 |
| gsj14-015 | 8.30 | 0.72 ± 0.07 | 23.1 ± 2.3 | 1.85 ± 0.19 | 0.48 ± 0.05 | 9.3 | 0.09 | 1.67 ± 0.12 |
| gsj13-039 | 8.30 | 0.77 ± 0.08 | 19.9 ± 2.0 | 1.60 ± 0.16 | 0.44 ± 0.04 | 11.3 | 0.09 | 1.67 ± 0.12 |
| gsj14-031 | 11.54 | 0.83 ± 0.08 | 24.9 ± 2.5 | 1.67 ± 0.17 | 0.52 ± 0.05 | 16.1 | 0.07 | 1.70 ± 0.12 |
| gsj14-030 | 14.47 | 0.88 ± 0.09 | 24.1 ± 2.4 | 2.09 ± 0.21 | 0.60 ± 0.06 | 20.2 | 0.06 | 1.75 ± 0.12 |
| gsj14-017 | 17.60 | 0.69 ± 0.07 | 23.1 ± 2.3 | 2.46 ± 0.25 | 0.46 ± 0.05 | 15.7 | 0.04 | 1.60 ± 0.11 |
| gsj14-029 | 17.61 | 0.78 ± 0.08 | 22.9 ± 2.3 | 2.34 ± 0.23 | 0.74 ± 0.07 | 24.1 | 0.04 | 1.69 ± 0.12 |
| Site 2 | ||||||||
| gsj13-093 | 11. 84 | 0.50 ± 0.05 | 19.2 ± 1.9 | 1.63 ± 0.16 | 0.46 ± 0.05 | 11.4 | 0.07 | 1.44 ± 0.10 |
| gsj13-094 | 13.80 | 0.52 ± 0.05 | 18.0 ± 1.8 | 1.30 ± 0.13 | 0.37 ± 0.04 | 11.2 | 0.06 | 1.41 ± 0.10 |
| gsj13-092 | 14.08 | 0.71 ± 0.07 | 25.5 ± 2.6 | 1.93 ± 0.19 | 0.58 ± 0.06 | 17.7 | 0.06 | 1.61 ± 0.11 |
| gsj13-095 | 16.07 | 0.69 ± 0.07 | 24.9 ± 2.5 | 1.82 ± 0.18 | 0.52 ± 0.05 | 19.2 | 0.05 | 1.57 ± 0.11 |
| gsj13-091 | 17.33 | 0.55 ± 0.06 | 22.1 ± 2.2 | 1.80 ± 0.18 | 0.47 ± 0.05 | 10.3 | 0.05 | 1.48 ± 0.11 |
| gsj13-096 | 18.03 | 0.73 ± 0.07 | 24.3 ± 2.4 | 1.94 ± 0.19 | 0.54 ± 0.05 | 18.7 | 0.04 | 1.60 ± 0.11 |
| Site 3 | ||||||||
| gsj14-019 | 0.10 | 0.18 ± 0.02 | 6.2 ± 0.6 | 0.79 ± 0.08 | 0.22 ± 0.02 | 5.9 | 0.21 | 1.50 ± 0.10 |
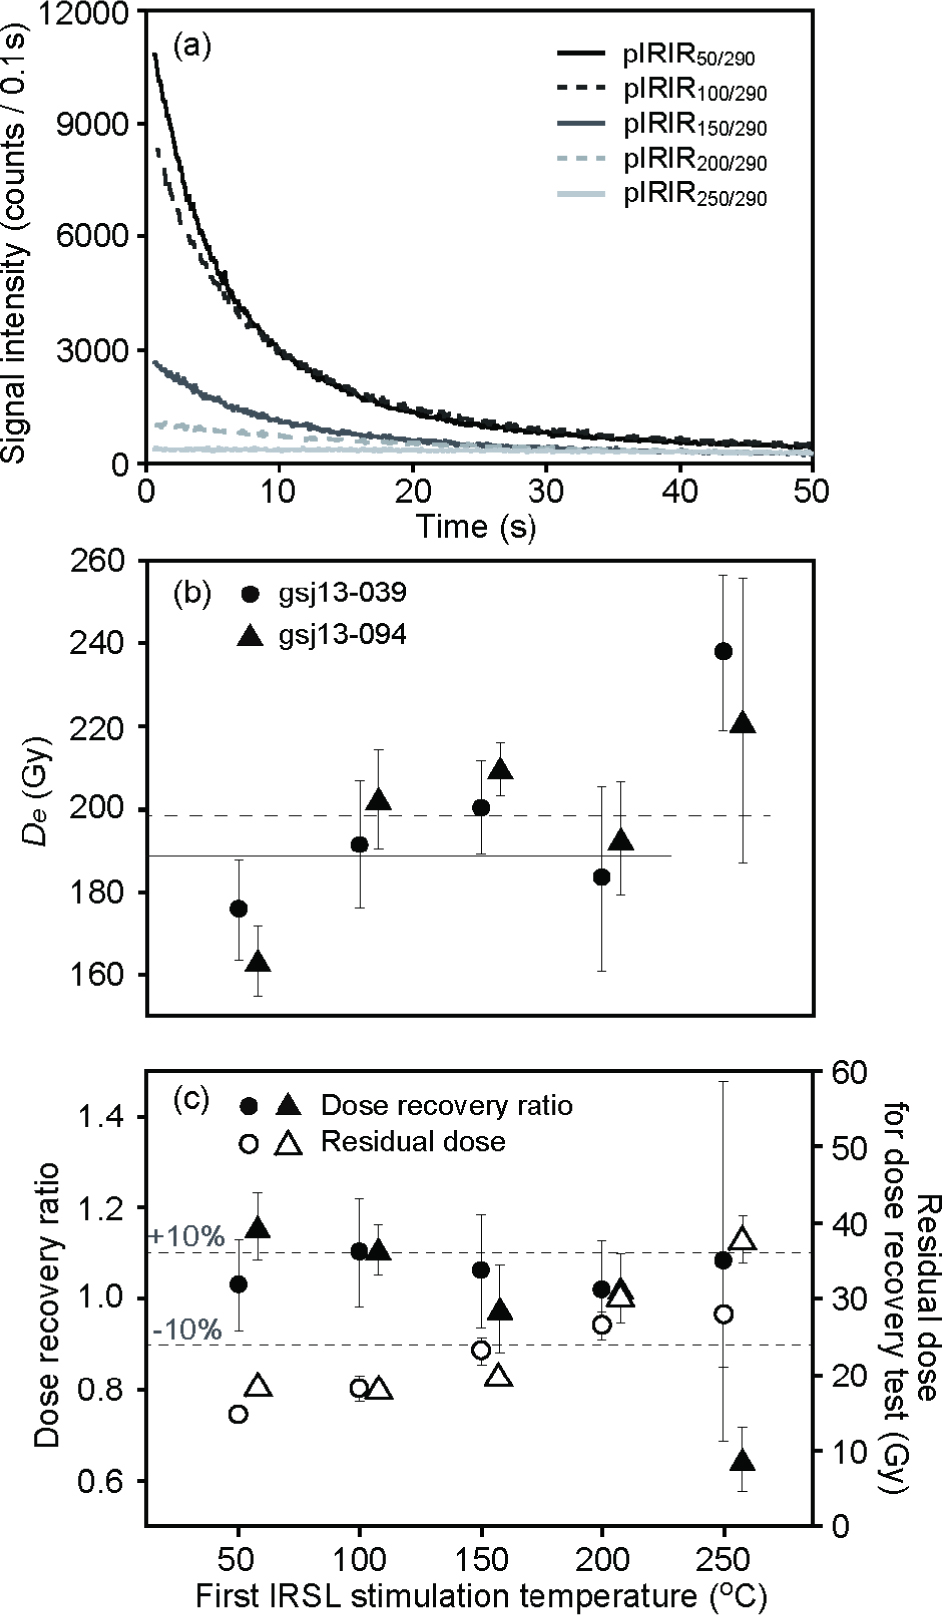
Fig. 3
pIRIR signal characteristics of samples gsj13-039 and gsj13-094 with different first IR stimulation temperatures. The pIRIR stimulation and preheat temperatures were fixed at 290 and 320°C, respectively. (a) Typical signal intensities of pIRIR290 signals from sample gsjl3-039, (b) first IR stimulation temperature plateau, and (c) dose recovery ratio and residual dose after bleaching for 3 h with different first stimulation temperatures. The error bars show one standard error. In (b), the bold and dashed lines represent the average De of each sample, except for De at the first IR measurement temperature of 250°C for gsj13-039. In (c), the dashed lines represent the ±10% range.
Table 2
Single aliquot regenerative (SAR) protocol used for De measurements.
| Step | Measurement Protocol | |
|---|---|---|
| 1 | Give dose | |
| 2 | Preheat 320°C for 60 s | |
| 3 | IRSL 50, 100, 150, 200, 250°C for 200 s | |
| 4 | IRSL 290°C for 200 s (pIRIR50/290, pIRIR100/290, pIRIR150/290, pIRIR200/290, pIRIR250/290) | Lx |
| 5 | Give test dose | |
| 6 | Preheat 320°C for 60 s | |
| 7 | IRSL 50, 100, 150, 200, 250°C for 200 s | |
| 8 | IRSL 290°C for 200 s (pIRIR50/290, pIRIR100/290, pIRIR150/290, pIRIR200/290, pIRIR250/290) | Tx |
| 9 | Hot IR bleach for 200 s at 325°C | |
| 10 | Return to step 1 | |
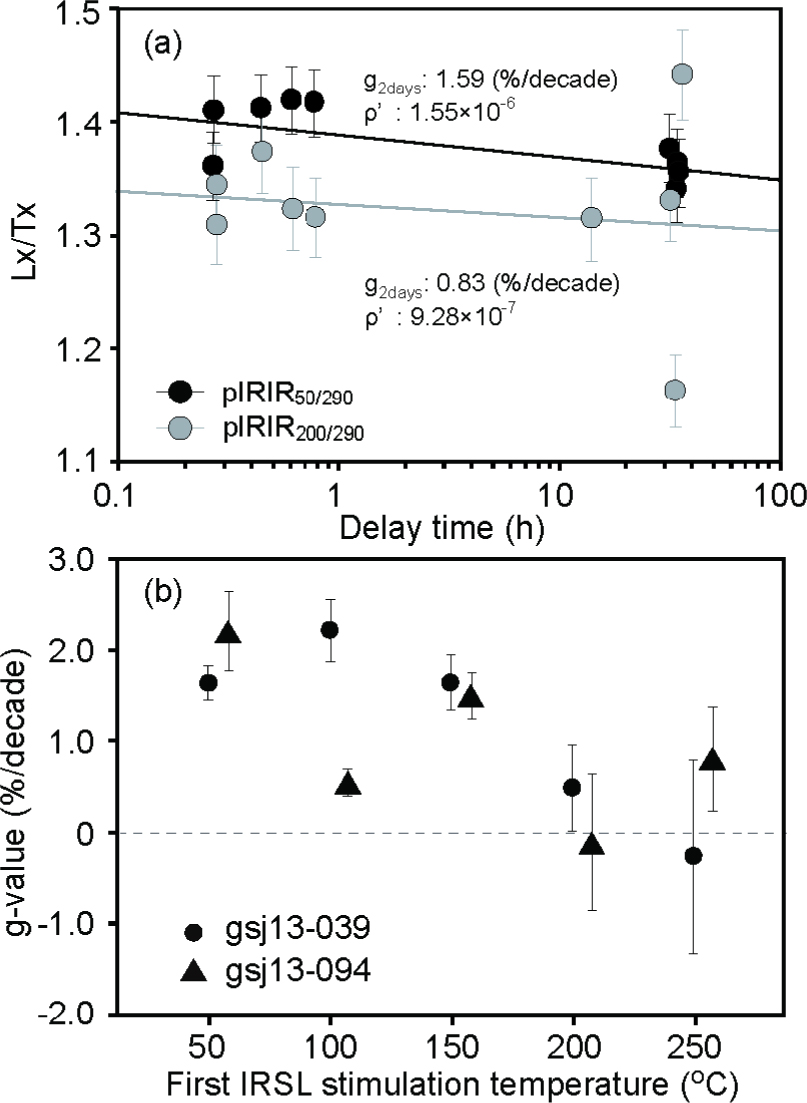
Fig. 4
Fading test results. (a) Typical results for sample gsj13-039; (b) g-values obtained with different first IR stimulation temperatures for gsj13-039 and gsj13-094. The error bars show one standard error.
Table 3
Results of pIRIR dating using different first IR stimulation temperatures. n is number of aliquots, ρ′ is the dimensionless recombination center density (Huntley, 2006). Residual dose was De after artificial sunlight bleaching for 3 h except for modern beach sand (gsj14-019) which was bleached for 800 h. Fading correction was performed based on Kars et al. (2008) and Kars and Wallinga (2009). To calculate the uncorrected ages, residual dose of modern beach sand (gsj14-019) was subtracted from De of each sample. D0 values were calculated based on Wintle and Murray (2006).
aTerrigenous sediments. bIf the average g-value of samples from site 2 was lower than zero, fading correction would not performed.
| Sample | Measurement procedure | n | De(Gy) | Fading test | Dose recovery test | Fading-uncorrected Age (ka) | Fading-corrected Ageb (ka) | D0 (Gy) | |||||
|---|---|---|---|---|---|---|---|---|---|---|---|---|---|
| n | g2days (%/decade) | ρ′ /10−6 | n | Dose recovery ratio | n | Residual dose (Gy) | |||||||
| Site 1 | |||||||||||||
| gsj13-040a | pIRIR50/290 | 11 | 96 ± 3 | 11 | 2.19 ±0.09 | 2.24 ±0.10 | 3 | 0.93 ± 0.09 | 3 | 10± 1 | 59 ± 5 | 95 ±9 | 361 |
| pIRIR200/290 | 17 | 120 ± 4 | 7 | −1.02 ±0.73 | −1.11 ±0.72 | 3 | 1.07 ± 0.09 | 3 | 12 ± 6 | 74 ± 7 | 81 ±8 | 251 | |
| gsj14-014 | pIRIR50/290 | 8 | 163 ± 8 | 3 | 1.16 ± 0.05 | 3 | 15 ± 1 | 99 ± 11 | 167 ±20 | 413 | |||
| pIRIR200/290 | 11 | 192 ± 5 | 3 | 1.20 ± 0.10 | 3 | 25 ± 1 | 116± 10 | 127 ± 12 | 324 | ||||
| gsj14-015 | pIRIR50/290 | 8 | 178 ± 8 | 3 | 1.06 ± 0.03 | 3 | 12 ± 0 | 105 ± 10 | 168 ± 16 | 724 | |||
| pIRIR200/290 | 8 | 181 ± 6 | 3 | 0.81 ± 0.05 | 3 | 22 ± 1 | 106 ± 10 | 116 ± 11 | 392 | ||||
| gsj13-039 | pIRIR50/290 | 28 | 176 ± 8 | 28 | 1.65 ±0.18 | 1.64 ±0.17 | 10 | 1.03 ± 0.10 | 6 | 15 ± 0 | 103 ± 10 | 177 ±20 | 422 |
| pIRIR100/290 | 12 | 191 ± 10 | 12 | 2.22 ± 0.34 | 2.22 ± 0.33 | 9 | 1.10 ± 0.12 | 6 | 18 ± 2 | 112 ± 12 | 199 ±25 | 424 | |
| pIRIRI50/290 | 10 | 200 ±7 | 10 | 1.65 ±0.31 | 1.64 ±0.31 | 9 | 1.06 ± 0.12 | 6 | 23 ± 2 | 118 ± 11 | 178 ± 17 | 451 | |
| pIRIR200/290 | 19 | 183 ± 14 | 19 | 0.49 ± 0.46 | 0.48 ± 0.49 | 12 | 1.02 ± 0.11 | 12 | 27 ± 2 | 107 ± 15 | 117 ± 17 | 370 | |
| pIRIR250/290 | 9 | 238 ± 8 | 9 | −0.26 ± 1.07 | −0.42 ± 1.15 | 9 | 1.08 ± 0.40 | 6 | 28 ± 7 | 139 ± 15 | 139 ± 15 | 231 | |
| gsj14-031 | pIRIR50/290 | 7 | 163 ± 7 | 3 | 1.06 ± 0.05 | 3 | 13± 1 | 94 ± 9 | 159 ± 16 | 410 | |||
| pIRIR200/290 | 9 | 194 ± 7 | 3 | 1.01 ± 0.07 | 3 | 25 ± 1 | 112 ± 12 | 123 ± 13 | 298 | ||||
| gsj14-030 | pIRIR50/290 | 8 | 204 ± 5 | 8 | 2.53 ± 0.31 | 2.53 ± 0.32 | 3 | 1.04 ± 0.05 | 3 | 15 ± 0 | 116± 9 | 199 ± 17 | 448 |
| pIRIR200/290 | 13 | 214 ± 7 | 12 | 1.57 ±0.40 | 1.57 ±0.40 | 3 | 0.94 ± 0.17 | 3 | 31 ± 1 | 120 ± 12 | 133 ± 14 | 258 | |
| gsj14-017 | pIRIR50/290 | 8 | 184 ± 5 | 3 | 1.04 ± 0.05 | 3 | 16± 1 | 113± 9 | 188 ± 16 | 514 | |||
| pIRIR200/290 | 11 | 204 ± 11 | 3 | 1.02 ± 0.07 | 3 | 31 ± 1 | 125 ± 14 | 136 ± 15 | 446 | ||||
| gsj14-029 | pIRIR50/290 | 8 | 183 ± 5 | 3 | 0.96 ± 0.04 | 3 | 14 ± 1 | 107 ± 9 | 181 ± 15 | 453 | |||
| pIRIR200/290 | 10 | 206 ± 9 | 3 | 1.01 ± 0.10 | 3 | 21 ± 1 | 120 ± 13 | 131 ± 15 | 339 | ||||
| Site 2 | |||||||||||||
| gsj13-093a | pIRIR50/290 | 10 | 95 ± 2 | 10 | 1.25 ±0.66 | 1.21 ±0.66 | 3 | 1.09 ± 0.05 | 3 | 11 ± 0 | 64 ± 5 | 94 ±8 | 371 |
| pIRIR200/290 | 16 | 127 ± 4 | 8 | −1.34 ±0.57 | −1.43 ±0.62 | 3 | 1.13 ± 0.10 | 3 | 21 ± 2 | 86 ± 8 | 229 | ||
| gsj13-094 | pIRIR50/290 | 17 | 163 ± 6 | 11 | 2.21 ± 0.42 | 2.24 ± 0.40 | 3 | 1.16 ± 0.07 | 3 | 19 ± 1 | 114 ± 10 | 173 ± 16 | 461 |
| pIRIR100/290 | 6 | 203 ± 7 | 6 | 0.55 ±0.14 | 0.58 ±0.15 | 3 | 1.11 ± 0.05 | 3 | 18 ± 1 | 142 ± 13 | 164 ± 16 | 420 | |
| pIRIR50/290 | 6 | 210 ± 4 | 6 | 1.50 ±0.23 | 1.52 ±0.25 | 3 | 0.98 ± 0.09 | 3 | 20 ± 1 | 147 ± 12 | 223 ± 18 | 364 | |
| pIRIR200/290 | 24 | 193 ± 7 | 12 | −0.11 ±0.74 | −0.20 ± 0.76 | 3 | 1.02 ± 0.07 | 3 | 31 ± 1 | 134 ± 14 | 324 | ||
| pIRIR250/290 | 4 | 221 ± 14 | 4 | 0.81 ± 0.57 | 0.83 ± 0.59 | 3 | 0.65 ± 0.07 | 3 | 38 ± 3 | 154 ± 27 | 202 ± 41 | 253 | |
| gsj13-092 | pIRIR50/290 | 7 | 205 ± 5 | 3 | 1.08 ± 0.06 | 3 | 17 ± 0 | 126 ± 10 | 193 ± 16 | 507 | |||
| pIRIR200/290 | 10 | 219 ± 3 | 3 | 1.02 ± 0.07 | 3 | 31 ± 1 | 134 ± 10 | 287 | |||||
| gsj13-095 | pIRIR50/290 | 8 | 193 ± 5 | 8 | 1.82 ±0.12 | 1.82 ±0.13 | 3 | 1.16 ± 0.07 | 3 | 12 ± 0 | 121 ± 10 | 187 ± 16 | 450 |
| pIRIR200/290 | 16 | 214 ± 4 | 12 | 1.40 ±0.22 | 1.40 ±0.23 | 3 | 0.97 ± 0.06 | 3 | 28 ± 1 | 134 ± 11 | 354 | ||
| gsj13-091 | pIRIR50/290 | 8 | 178 ± 3 | 3 | 1.07 ± 0.06 | 3 | 16± 1 | 118 ± 9 | 178 ± 14 | 532 | |||
| pIRIR200/290 | 11 | 205 ± 5 | 3 | 1.13 ± 0.12 | 3 | 32 ± 2 | 136 ± 12 | 312 | |||||
| gsj13-096 | pIRIR50/290 | 8 | 187 ± 13 | 3 | 1.06 ± 0.06 | 3 | 11 ± 1 | 115 ± 15 | 177 ±26 | 442 | |||
| pIRIR200/290 | 12 | 202 ±7 | 3 | 1.15 ± 0.06 | 3 | 27 ± 1 | 123 ± 12 | 339 | |||||
| Site 3 | |||||||||||||
| gsj14-019 | pIRIR50/290 | 12 | 16± 2 | 3 | 3 ± 0 | ||||||||
| pIRIR100/290 | 8 | 14 ± 2 | |||||||||||
| pIRlR50/290 | 8 | 11 ± 1 | |||||||||||
| pIRIR200/290 | 15 | 17 ± 1 | 3 | 4 ± 0 | |||||||||
| pIRIR250/290 | 8 | 26 ± 2 | |||||||||||
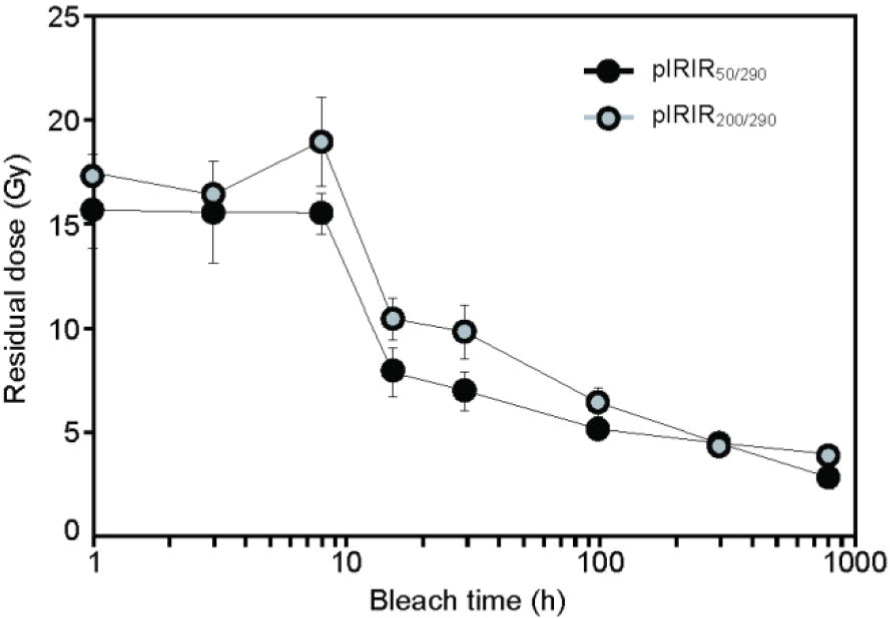
Fig. 5
Average residual dose obtained for different artificial sunlight bleaching times. Each data point represents the average of at least six aliquots. The error bars show one standard error.
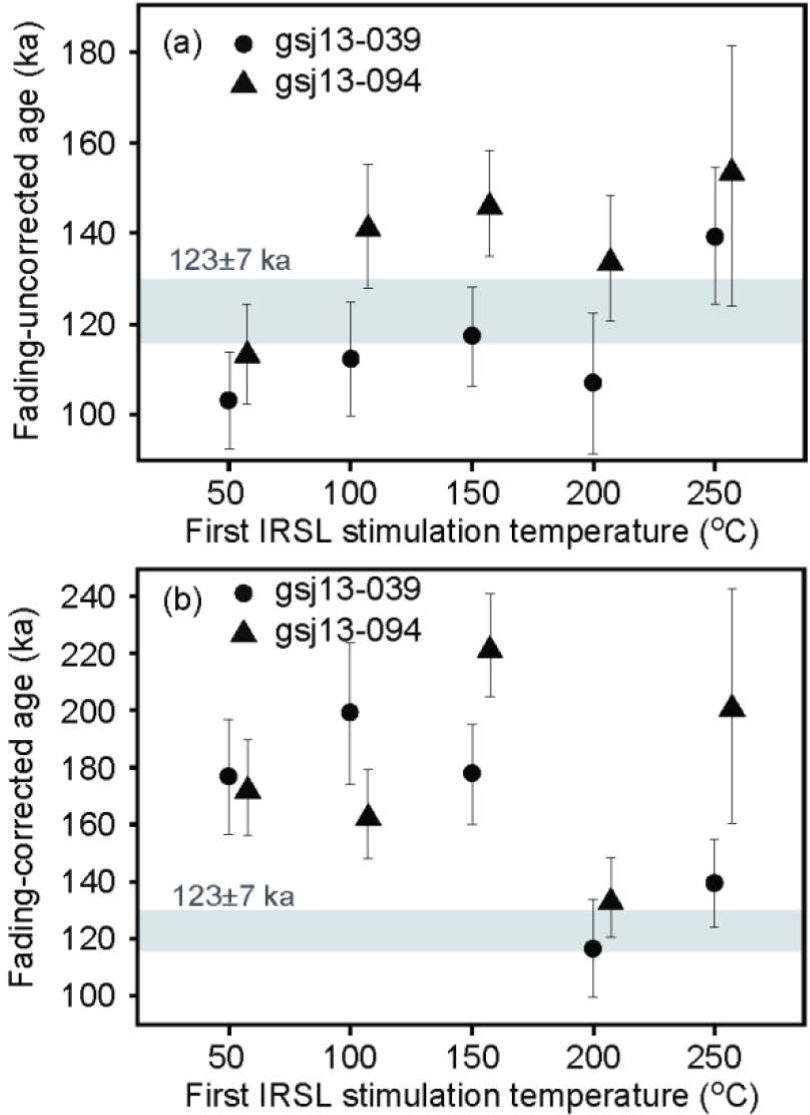
Fig. 6
(a) Uncorrected and (b) corrected pIRIR ages of gsj13-039 and gsj13-094 obtained with different first IR stimulation temperatures. The error bars show one standard error.
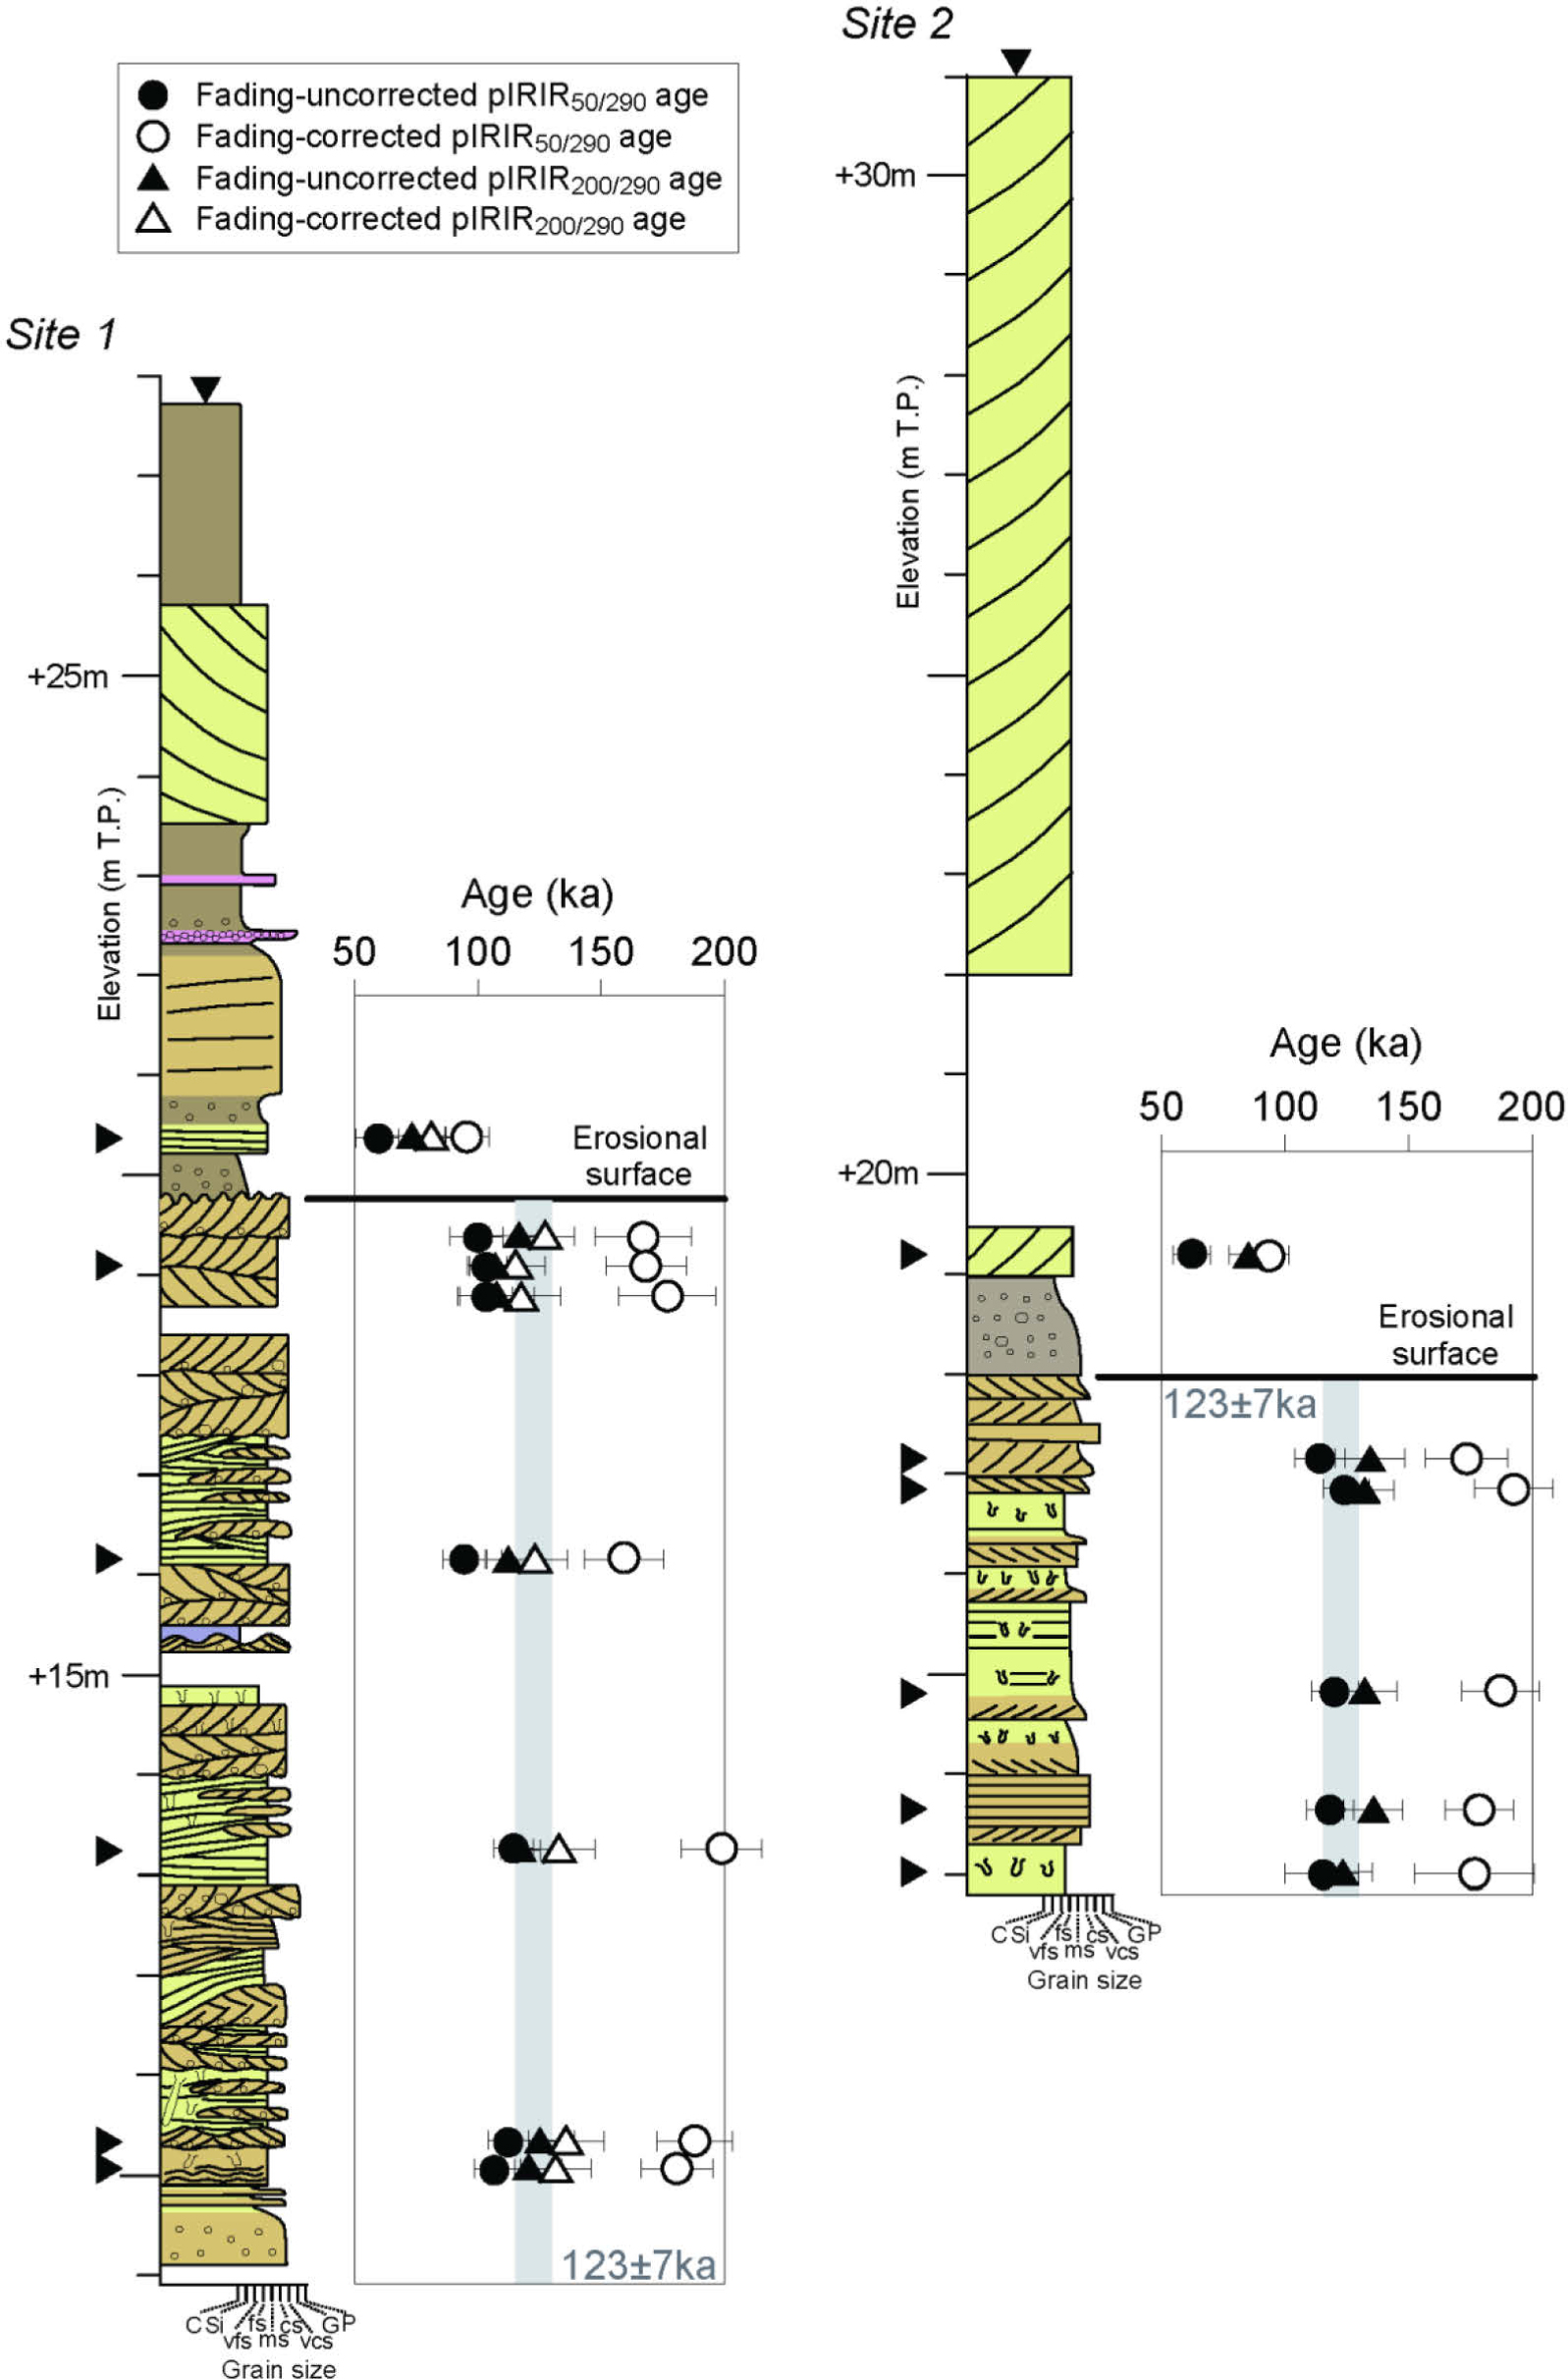
Fig. 7
Columnar sections as in Fig. 2. For sites 1 and 2, the fading-uncorrected and -corrected ages of the PIRIR50/290 and PIRIR200/290 signals are shown with one standard error. For site 2, the fading corrected ages of PIRIR200/290 signals were not calculated because the average ρ’ value was lower than zero. For each site, the vertical gray bar shows the expected age range. T.P. (Tokyo Peil) is the standard datum for elevation measurements in Japan.
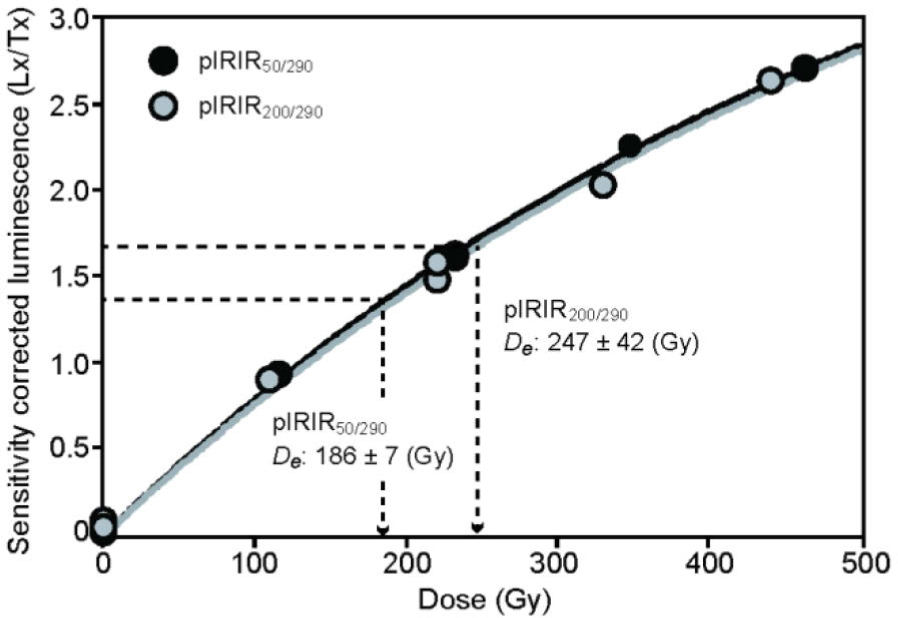
Fig. 8
Typical dose–response curve for the PIRIR50/290 and PIRIR200/290 signals of sample gsj13-039.