
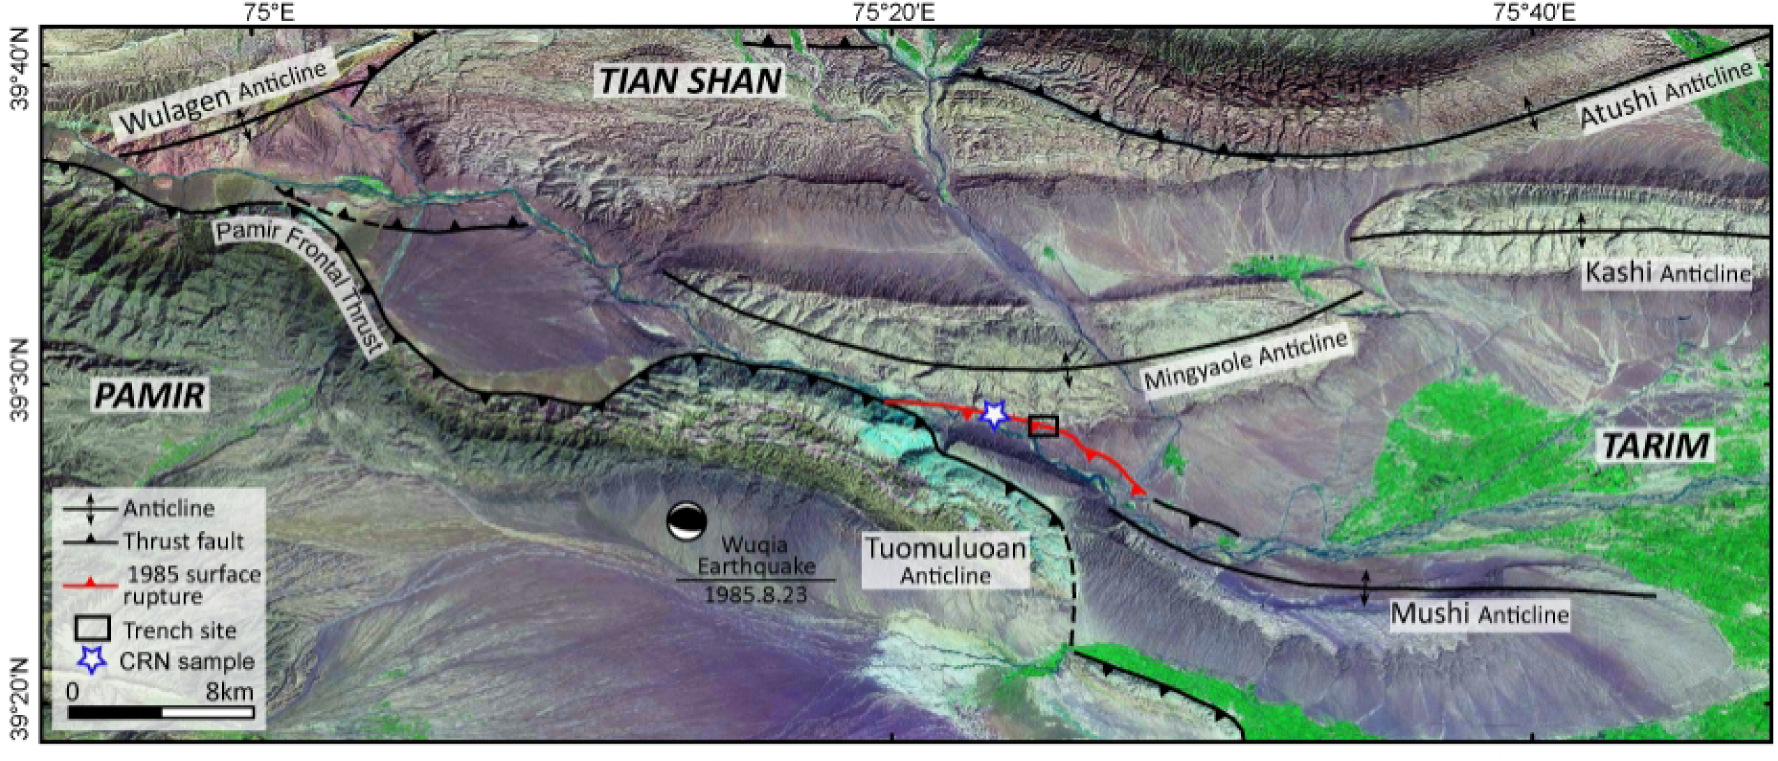
Fig. 1
Aster image showing regional tectonic structure, the 1985 Wuqia earthquake surface rupture and trench location. Modified from Li et al. (2012).
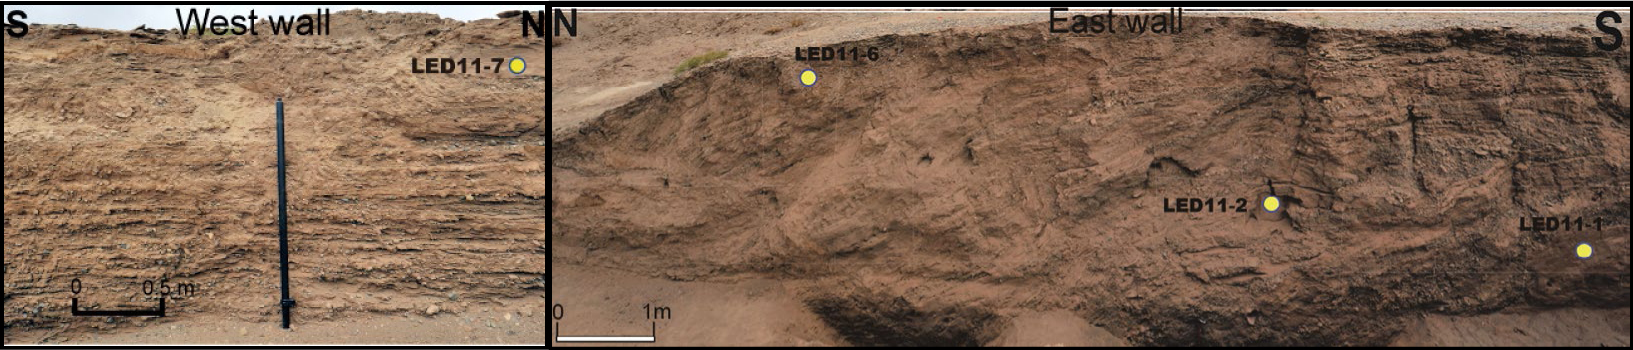
Fig. 2
Location of the modern sample LED11-7 (Left); Trench wall showing the location of samples LED11-1, 11-2 and 11-6 (Right).
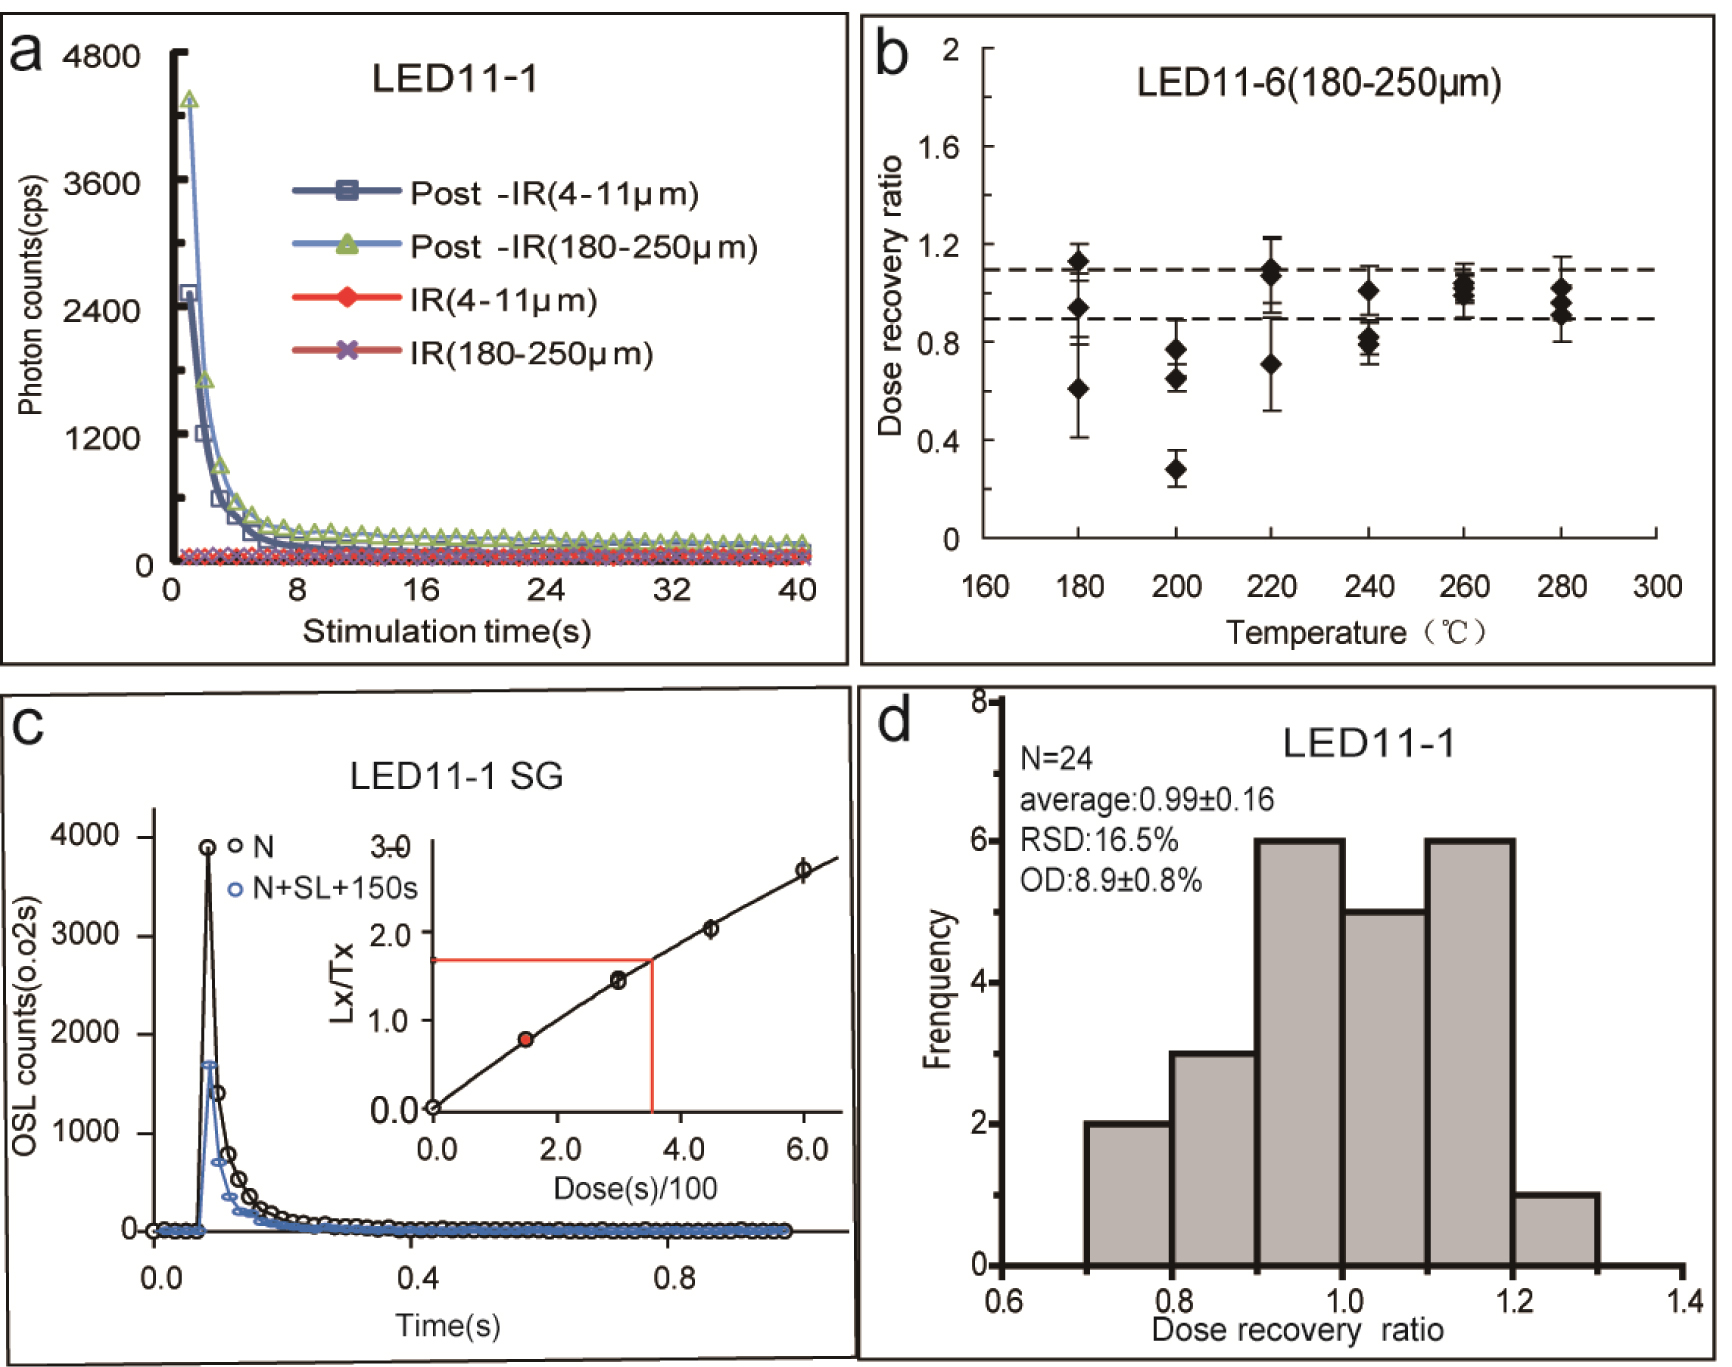
Fig. 3
Luminescence characteristics. a – Quartz purity IR check; b – Dose recovery as a function of preheat temperature for coarse grains quartz; c – OSL decay curves for single quartz grains from sample LED11-1, the inset shows a corresponding dose response curve (DRC), the red point is recycling point; d – A histogram of dose recovery ratios for single quartz grains using a 10 s preheat at 260°C for and a 220°C cutheat.
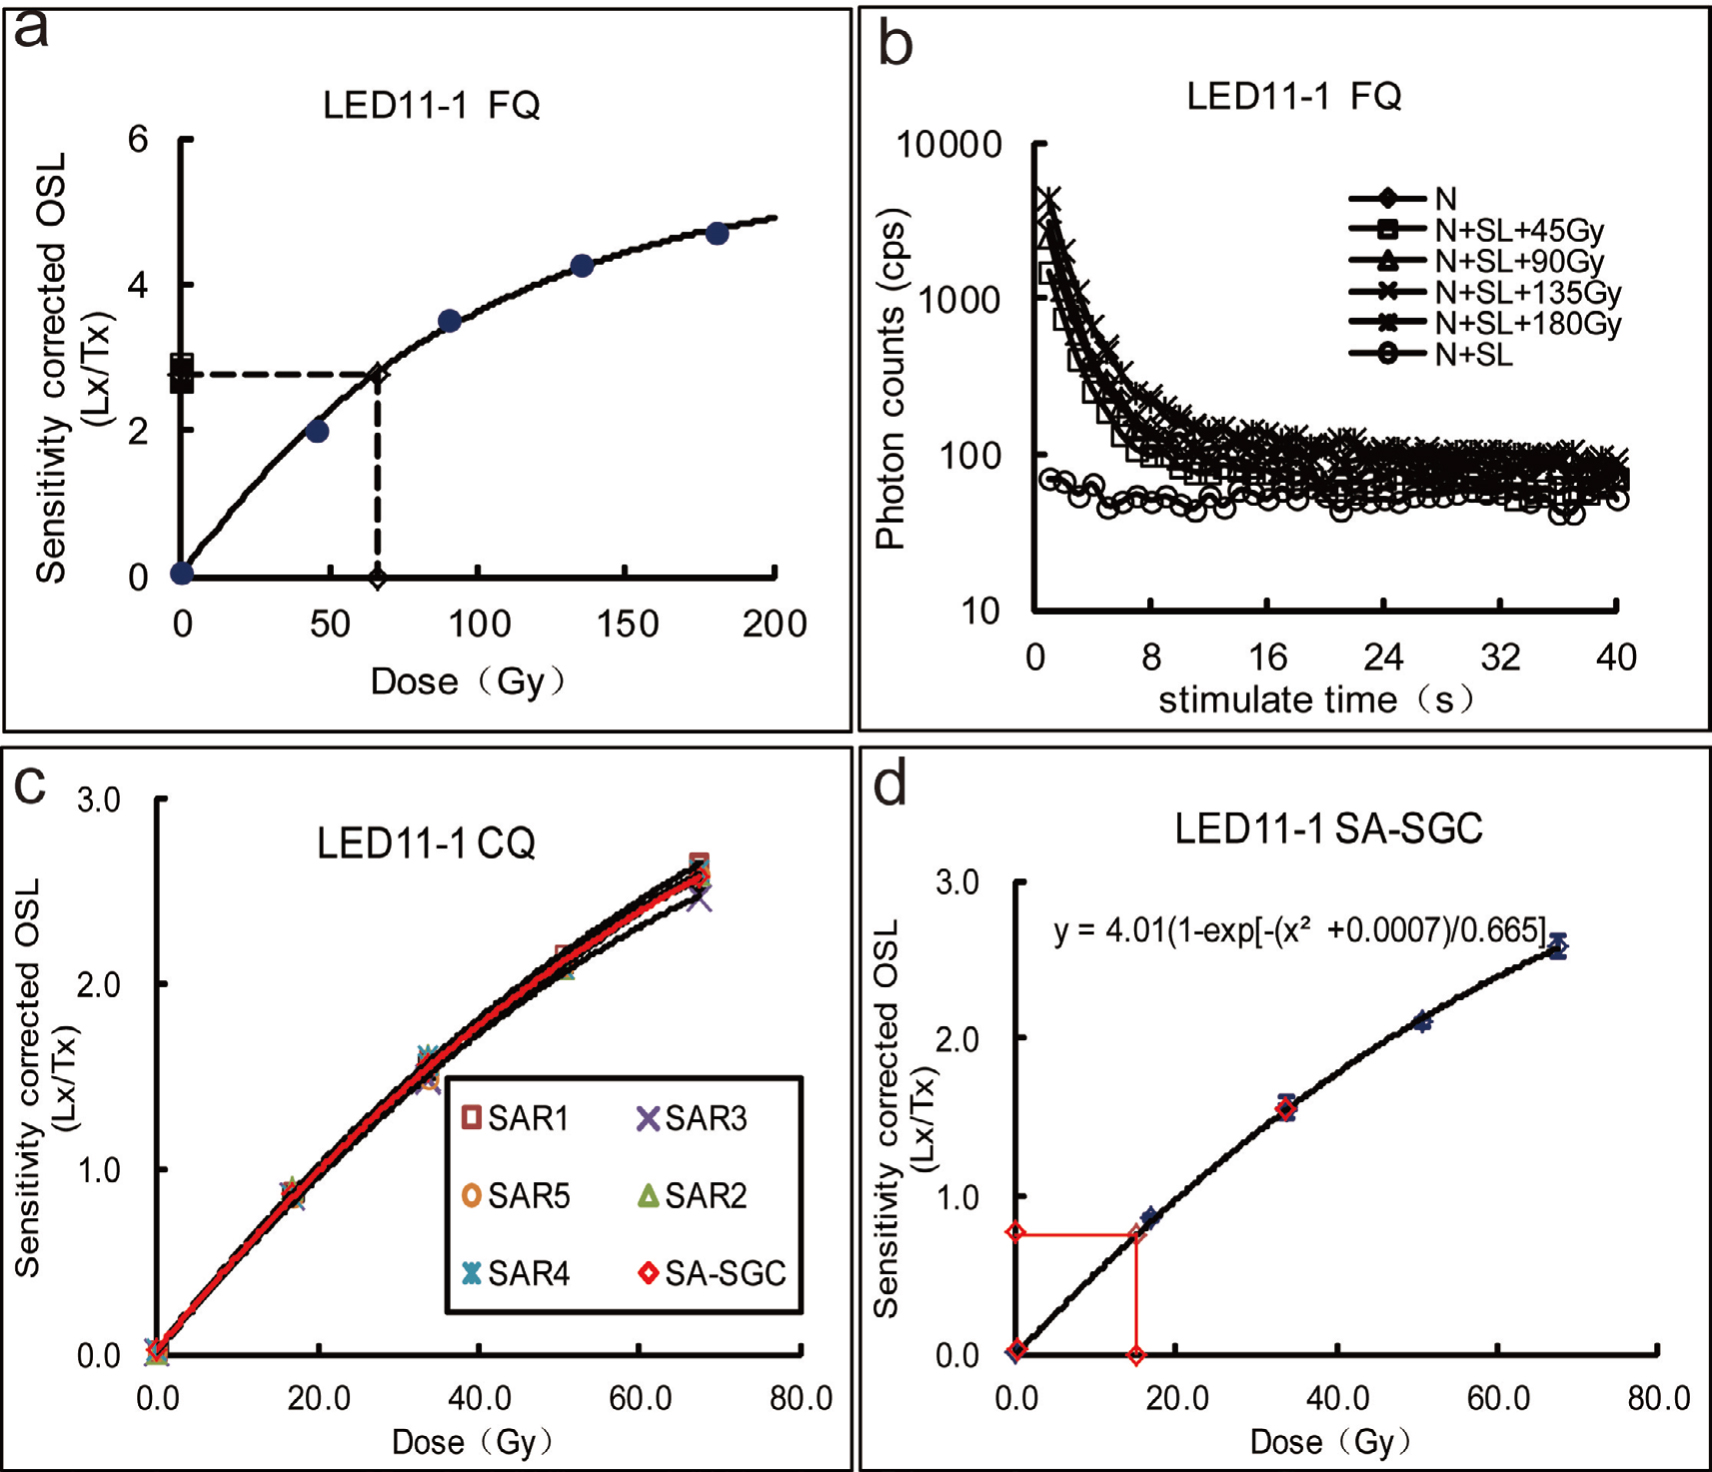
Fig. 4
a – Sensitivity-corrected multiple aliquot regenerative-dose growth curve (SMAR) of sample LED11-1; b – OSL decay curves of sample LED11-1; c – A SAR growth curve; d – Coarse grain quartz small aliquot standardized growth curve (SA-DRC). The red diamonds are sample-specific and were projected on the SA-DRC.
Table 1
Dose rate results for the samples.
| Sample No. | Depth (m) | U (ppm) | Th (ppm) | K (%) | Water contenta (%) | Dose rate (Gy/ka) | |
|---|---|---|---|---|---|---|---|
| CQ | FQ | ||||||
| LED11-1 | 2.4 | 1.65 | 5.3 | 1.37 | 5 ± 5 | 2.1 ± 0.1 | 2.9 ± 0.2 |
| LED11-2 | 2.8 | 1.74 | 4.84 | 1.15 | 5 ± 5 | 2.0 ± 0.1 | 2.6 ± 0.1 |
| LED11-6 | 0.6 | 1.96 | 7.75 | 1.49 | 2 ± 2 | 2.7 ± 0.2 | 3.4 ± 0.2 |
| LED11-7 | 0.2 | 1.35 | 4.67 | 1.2 | 2 ± 2 | 2.1 ± 0.1 | 2.5 ± 0.1 |
Table 2
De values of single grains, small aliquot SA-SGC and fine grains for the samples shown on Fig 2.
| Sample No. | Single grains | Small aliquot SA-SGC | Fine grains | |||||||||
|---|---|---|---|---|---|---|---|---|---|---|---|---|
| n/Na | Pb (%) | ODc (%) | Ded (Gy) | Age (ka) | n/Na | Pb (%) | ODc (%) | Ded (Gy) | Age (ka) | De (Gy) | Age (ka) | |
| LED11-1 | 158/4800 | 3.3 | 45 | 43/78 | 55 | 36 | 65.7 ± 5.4 | 22.9 ± 1.9 | ||||
| LED11-2 | 55/2300 | 2.4 | 62 | 63/142 | 44 | 59 | 157.6 ± 14.3 | 60.5 ± 5.4 | ||||
| LED11-6 | 55/3700 | 1.5 | 45 | 52/144 | 40 | 33 | 66.8 ± 3.1 | 19.5 ± 0.9 | ||||
| LED11-7 | 53/1800 | 2.9 | 80 | 42/88 | 47 | 59 | 7.0 ± 0.3 | 2.8 ± 0.1 | ||||
a n represents the number of accepted single grains or small aliquots that passed the SAR rejection criteria and used for De determination, N represents total number of grains or aliquots measured;
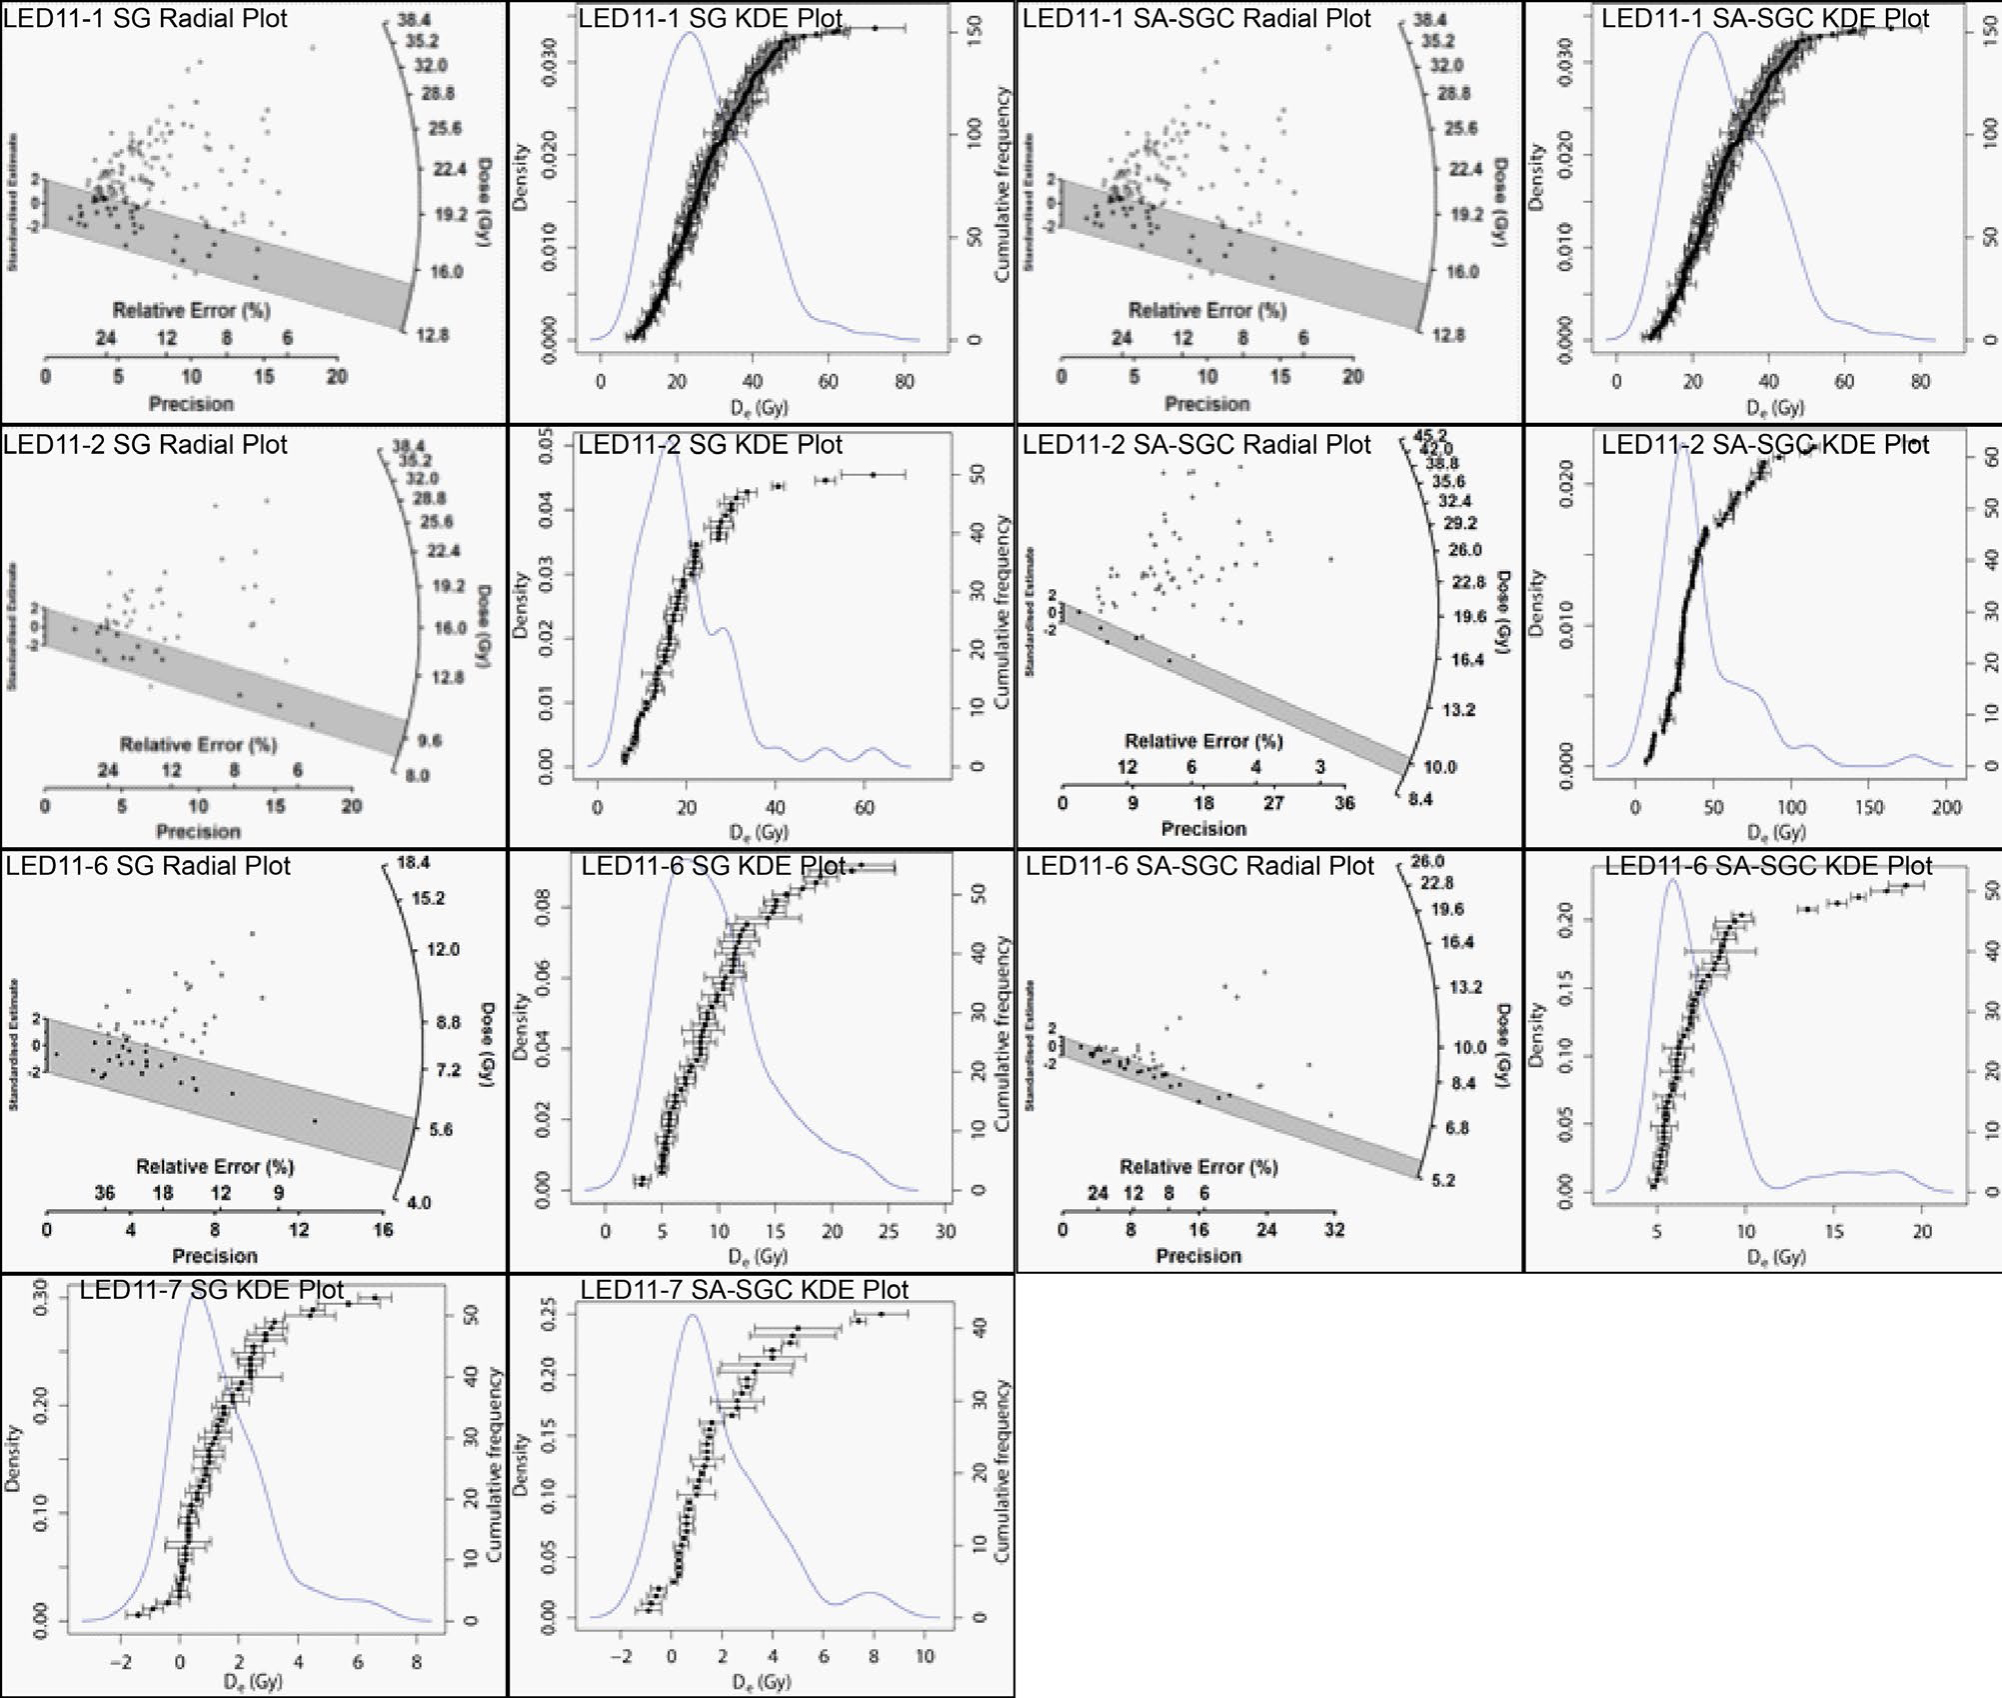
Fig. 5
Radial plots and KDE plots from single grains (SG) and small aliquot standardised growth curve (SA-SGC) for samples LED11-1, LED11-2 and LED11-6. Grey bands on radial plots show the samples’ De values with 2-sigma error (Table 2). Only KDE plots are shown for the sample LED11-7.