
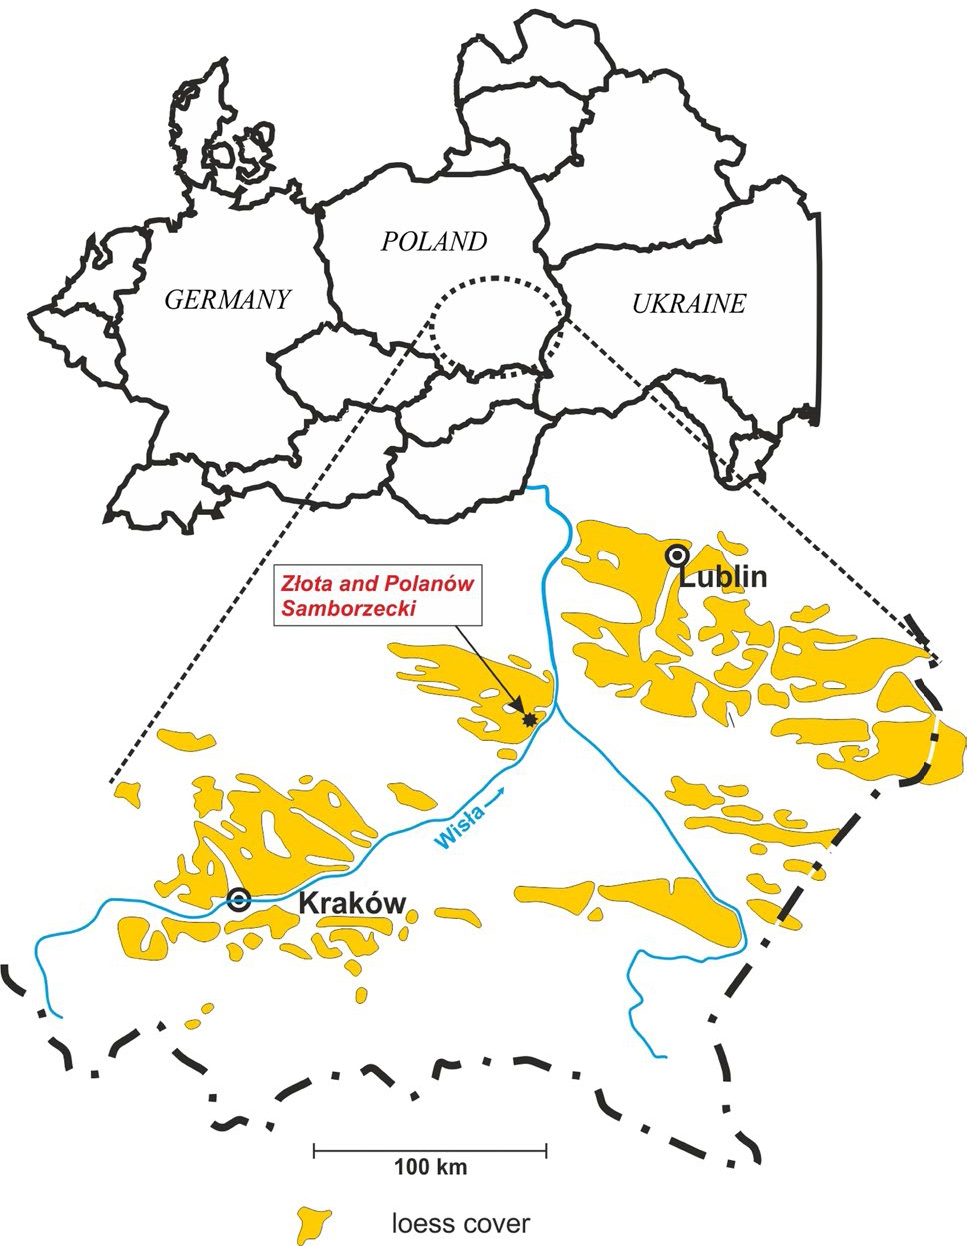
Fig. 1
Loess formations in southeastern part of Poland and position of Złota and Polanów Samborzecki loess profiles.
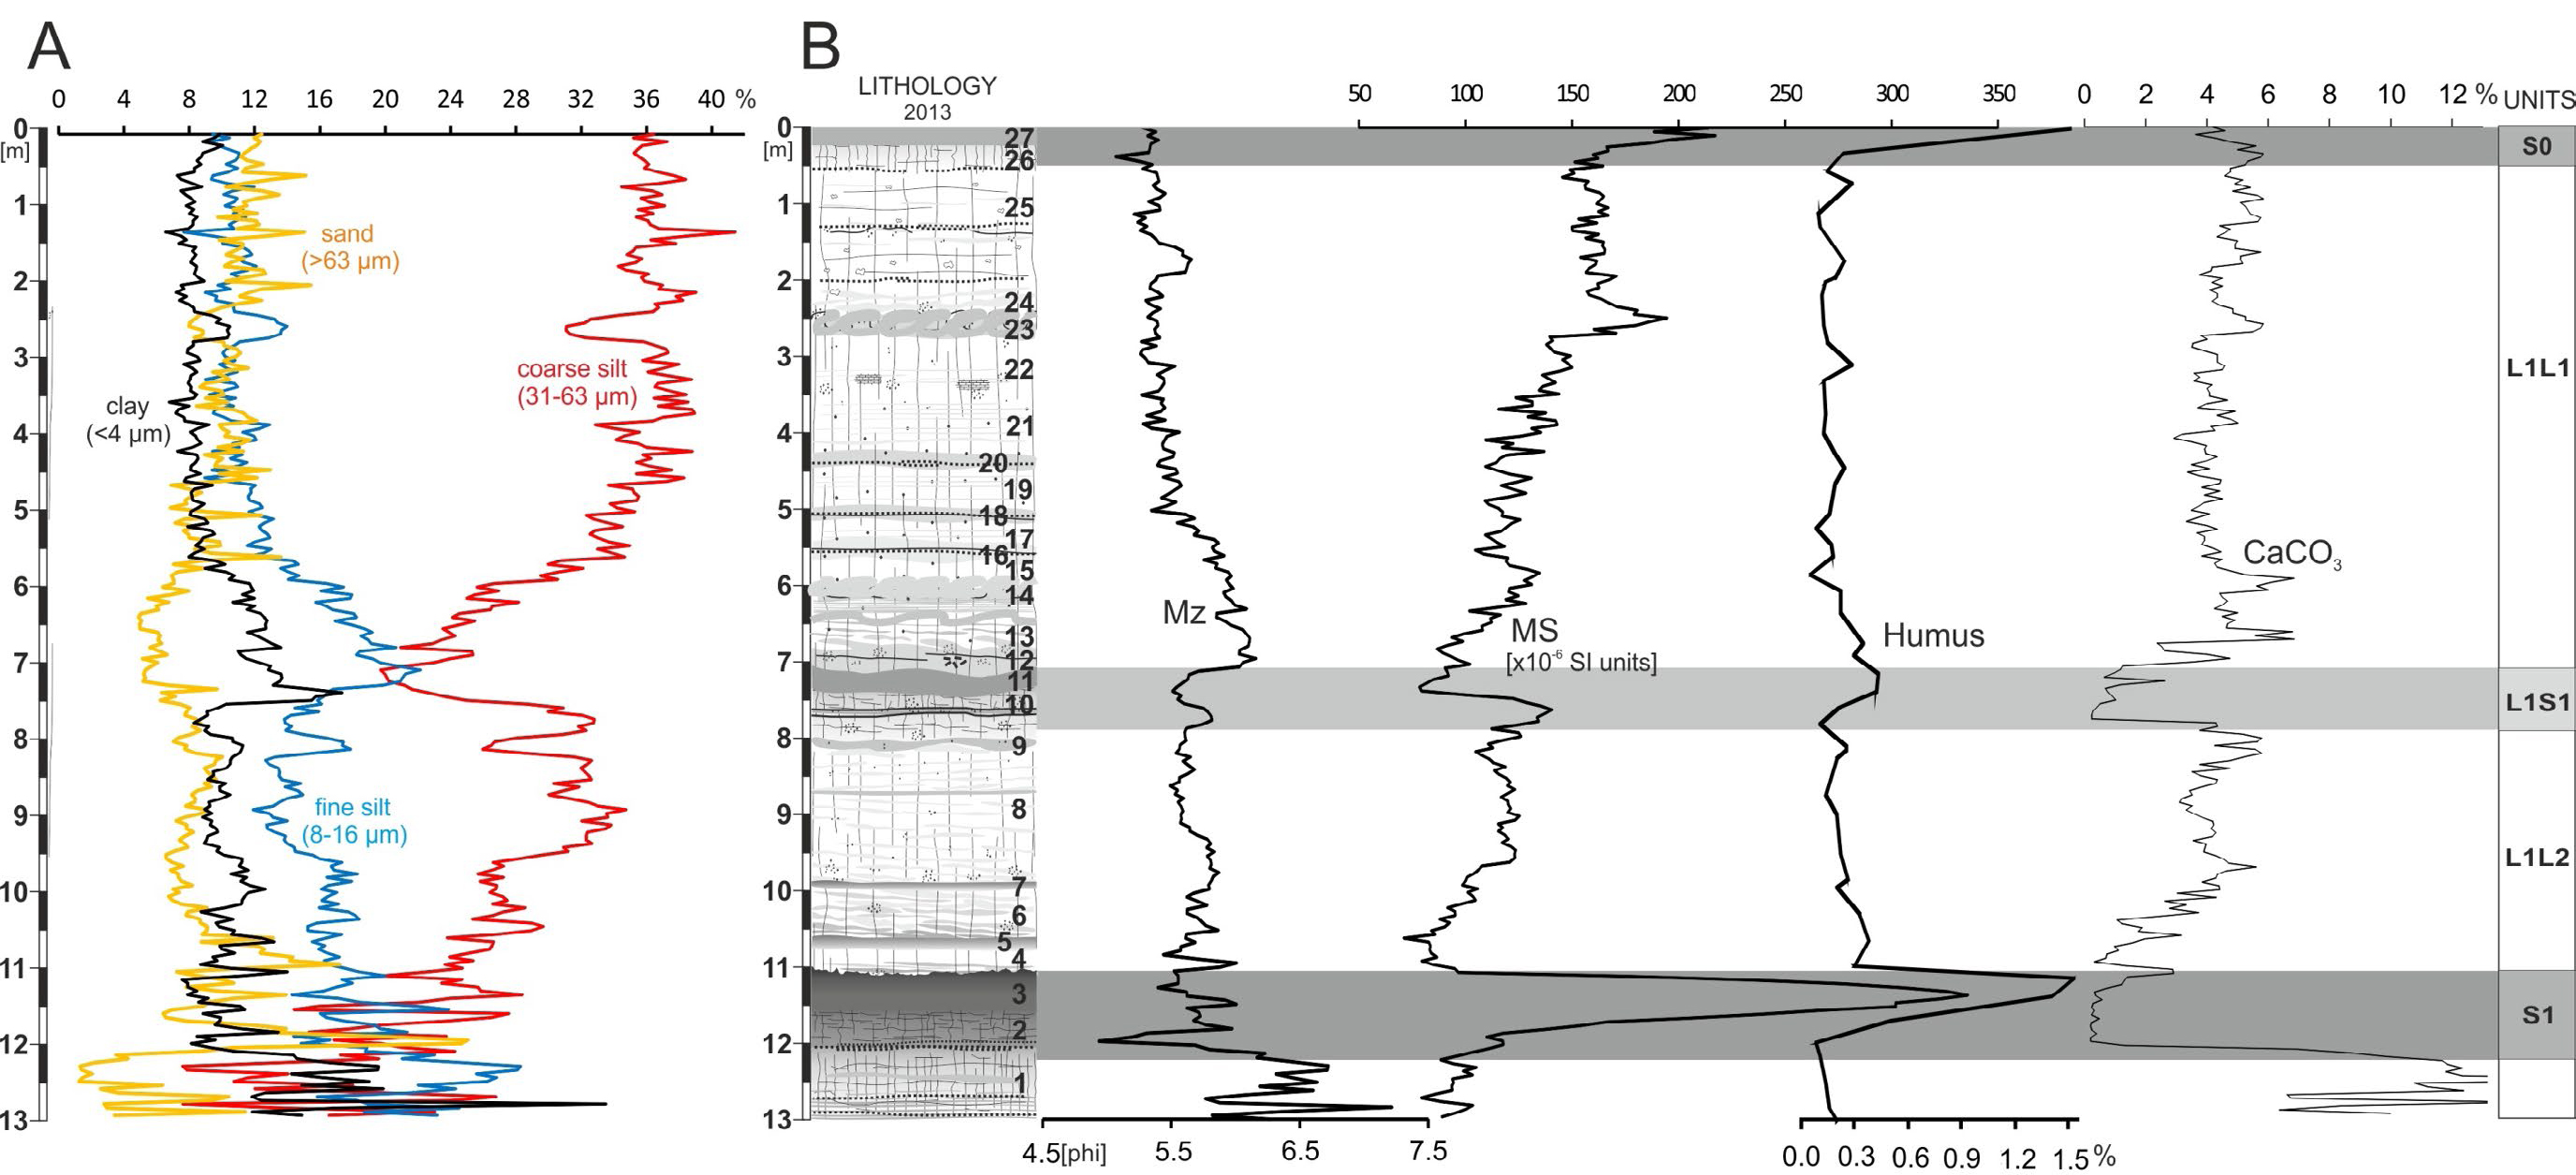
Fig. 2
A – grain size distribution. B – Reprinted from Moska et al 2015, with permission from Elsevier. Lithology, grain size distribution (MZ), magnetic susceptibility, humus and CaCO3 content for Złota loess section. Detailed lithological description is presented in Moska et al 2015.
Table 1
Sample names in the current study, specific activities of natural radionuclides, dose rates, calculated equivalent doses and ages for all investigated fractions using CAM model and laboratory codes.
| Depth (m) | Sample name | U-238 (Bq/kg) | Th-232 (Bq/kg) | K-40 (Bq/kg) | Dose rate 4–11 µm (Gy/ka) | Equivalent dose De4–11 µm (Gy) | post-IR IRSL age 4–11 µm (ka) | Laboratory code |
|---|---|---|---|---|---|---|---|---|
| 0.3 | Złota21 | 24.9±0.4 | 30.6±0.5 | 480±13 | 3.23±0.18 | 73.3±2.0 | 22.7±1.6 | GdTL2333 |
| 1.2 | Złota20 | 28.2±0.4 | 35.9±0.7 | 480±12 | 3.41±0.19 | 75.3±2.0 | 22.1±1.5 | GdTL2334 |
| 1.7 | Złota19 | 27.7±0.4 | 34.3±0.7 | 492±13 | 3.33±0.19 | 76.7±2.0 | 23.1±1.6 | GdTL2335 |
| 2.3 | Złota18 | 29.1±0.4 | 34.8±0.7 | 490±13 | 3.41±0.19 | 77.6±2.0 | 22.8±1.6 | GdTL2336 |
| 3.0 | Złota17 | 30.1±0.4 | 36.8±0.6 | 483±13 | 3.46±0.20 | 80.2±2.0 | 23.1±1.6 | GdTL2337 |
| 3.5 | Złota16 | 29.8±0.4 | 35.8±0.7 | 491±13 | 3.49±0.20 | 80.8±2.0 | 23.2±1.6 | GdTL2338 |
| 4.4 | Złota13 | 31.5±0.4 | 39.8±0.7 | 510±13 | 3.65±0.21 | 85.3±2.1 | 23.4±1.7 | GdTL2339 |
| 5.3 | Złota12 | 28.4±0.4 | 36.9±0.6 | 512±13 | 3.48±0.20 | 85.7±2.2 | 24.7±1.7 | GdTL2340 |
| 5.6 | Złota11 | 29.6±0.4 | 37.3±0.6 | 508±13 | 3.51±0.20 | 90.1±2.5 | 25.6±1.8 | GdTL2341 |
| 6.6 | Złota10 | 28.5±0.4 | 37.2±0.7 | 533±14 | 3.53±0.19 | 94.0±2.5 | 26.7±1.8 | GdTL2342 |
| 72 | Złota9 | 26.8±0.4 | 40.9±0.6 | 489±13 | 3.45±0.20 | 115.4±3.0 | 33.4±2.5 | GdTL2343 |
| 7.5 | Złota8 | 24.2±0.4 | 35.7±0.7 | 461±12 | 3.15±0.18 | 167.9±3.5 | 53.3±3.3 | GdTL2344 |
| 8.4 | Złota7 | 26.3±0.4 | 34.8±0.7 | 507±13 | 3.32±0.19 | 209.7±5.5 | 63.1±4.0 | GdTL2345 |
| 8.9 | Złota6 | 28.2±0.4 | 37.3±0.6 | 513±13 | 3.46±0.20 | 215.7±5.5 | 62.3±4.1 | GdTL2346 |
| 10.0 | Złota5 | 27.5±0.4 | 38.0±0.7 | 521±13 | 3.48±0.20 | 222.5±4.4 | 63.9±4.1 | GdTL2347 |
| 10.8 | Złota4 | 25.1±0.4 | 36.9±0.7 | 469±13 | 3.22±0.19 | 217.1±3.8 | 67.4±4.4 | GdTL2348 |
| 11.2 | Złota3 | 15.4±0.3 | 28.9±0.5 | 360±10 | 2.40±0.14 | 243.3±5.0 | 101.3±6.2 | GdTL2349 |
| 11.9 | Złota2 | 18.8±0.3 | 35.3±0.6 | 468±12 | 2.97±0.17 | 460±10 | 142.3±9.0 | GdTL2350 |
| 12.5 | Złota1 | 20.3±0.3 | 31.7±0.5 | 501±13 | 3.02±0.17 | 451±24 | 150±12 | GdTL2351 |
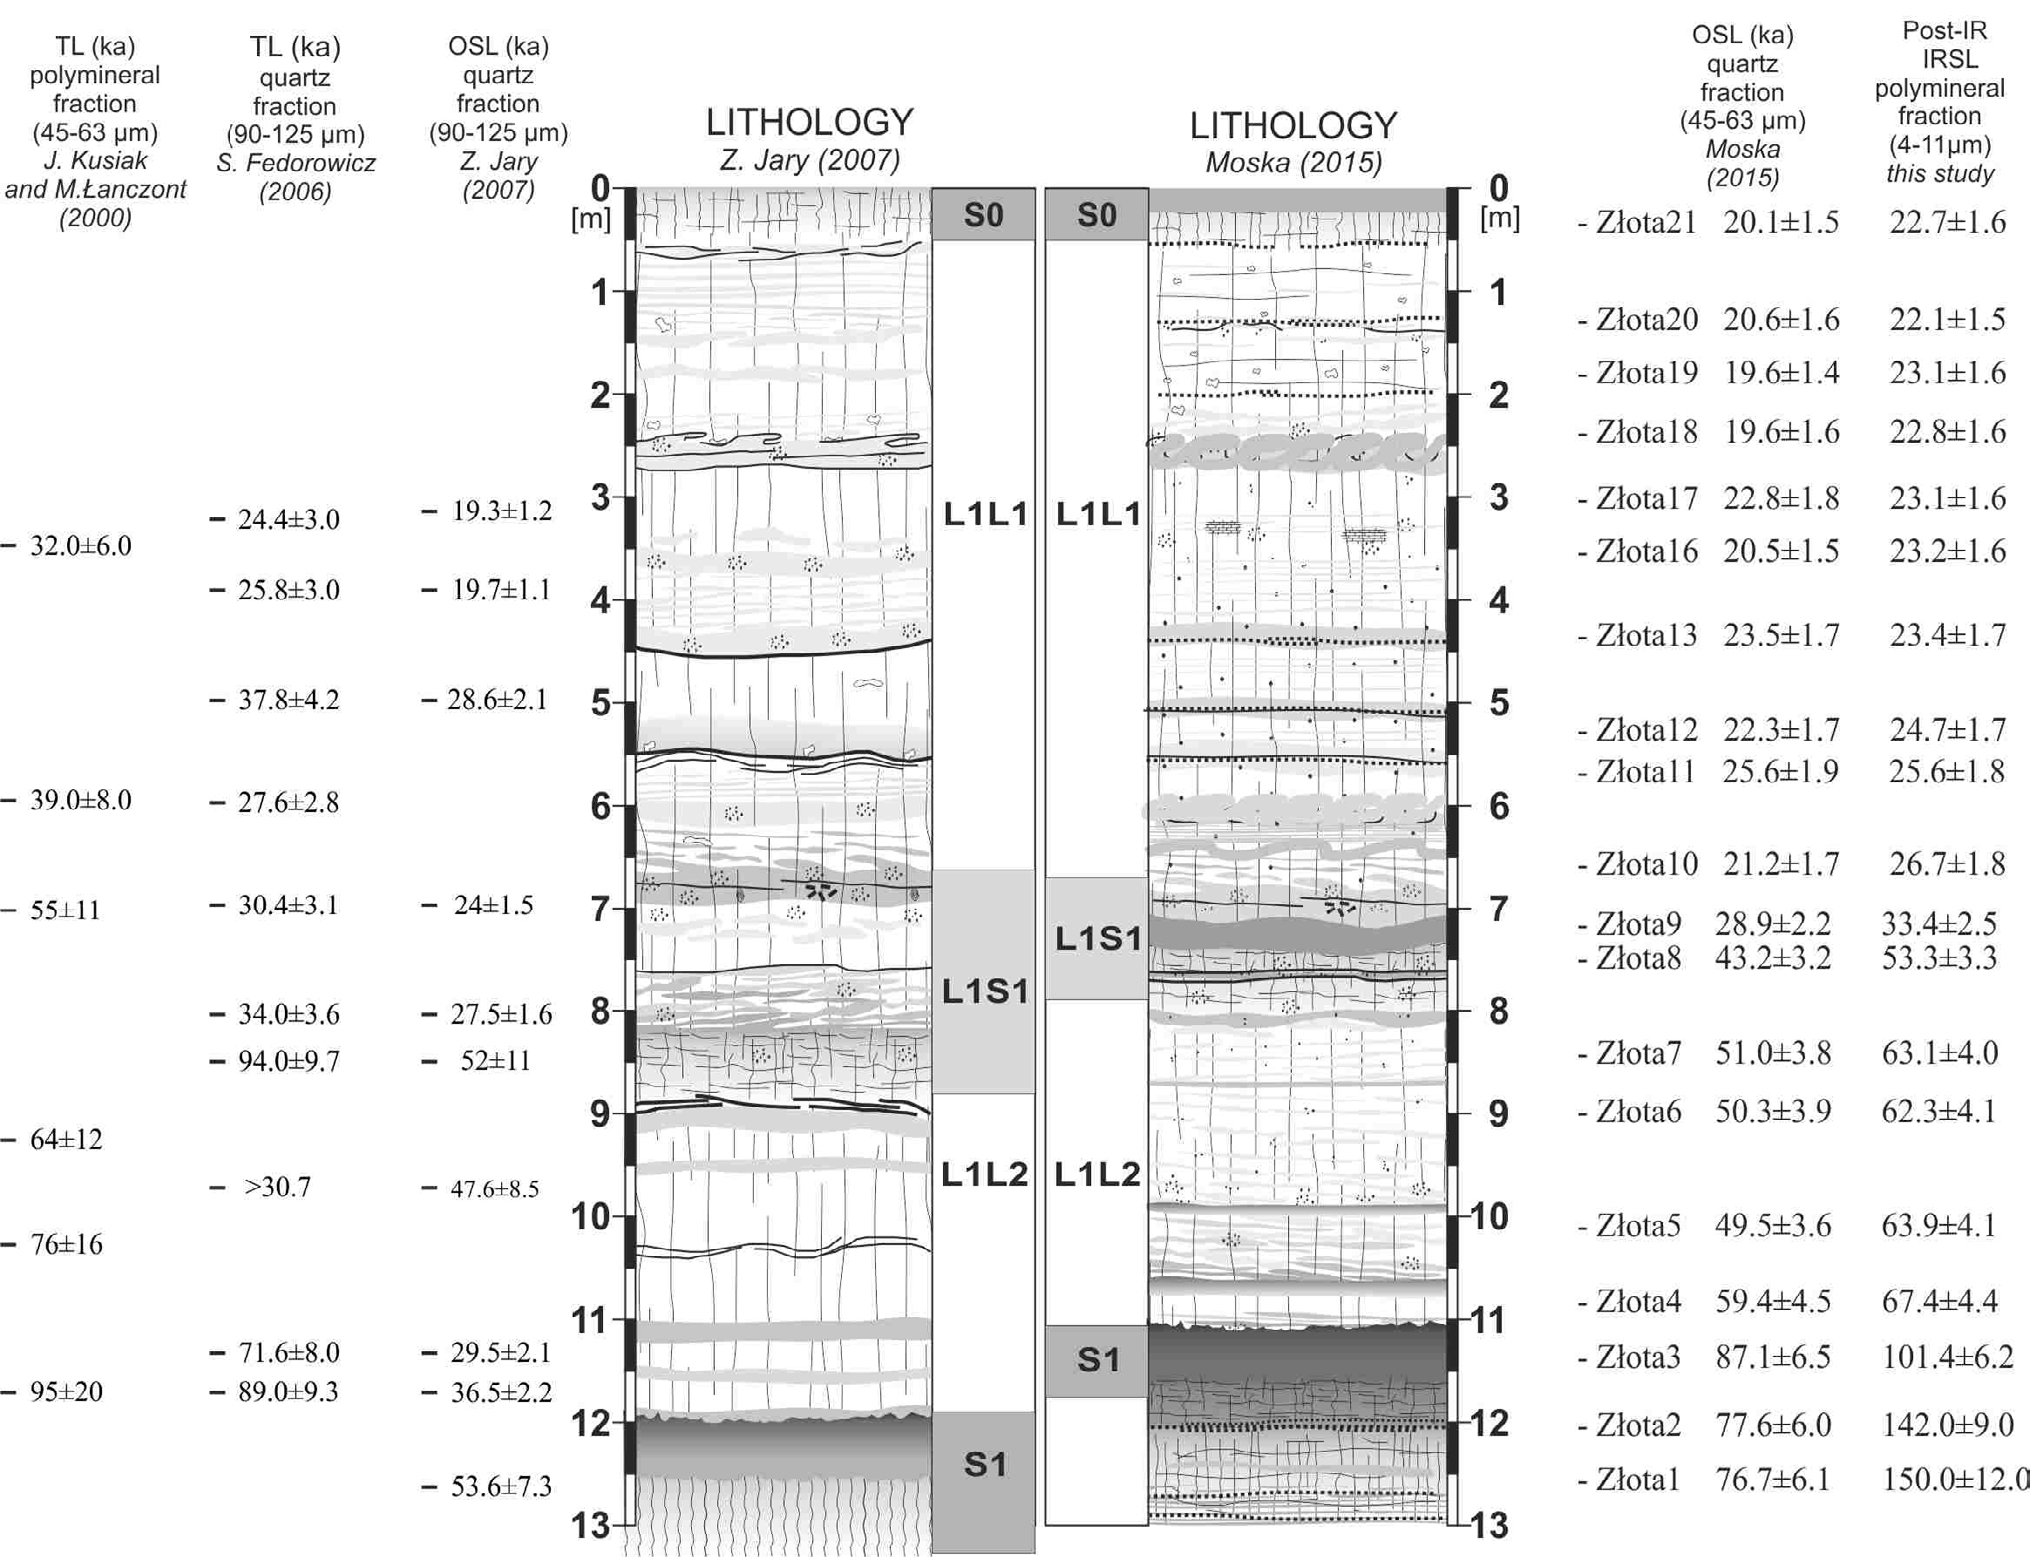
Fig. 3
Correlation of the Late Pleistocene loess–palaeosol stratigraphic units in Złota and Polanów Samborzecki. Comparison of new OSL dates with previous results. Obtained OSL results in some cases are quite different as compared with the OSL and TL dates obtained during last 10 years by other authors and presented in previous publications relating to this loess profile.
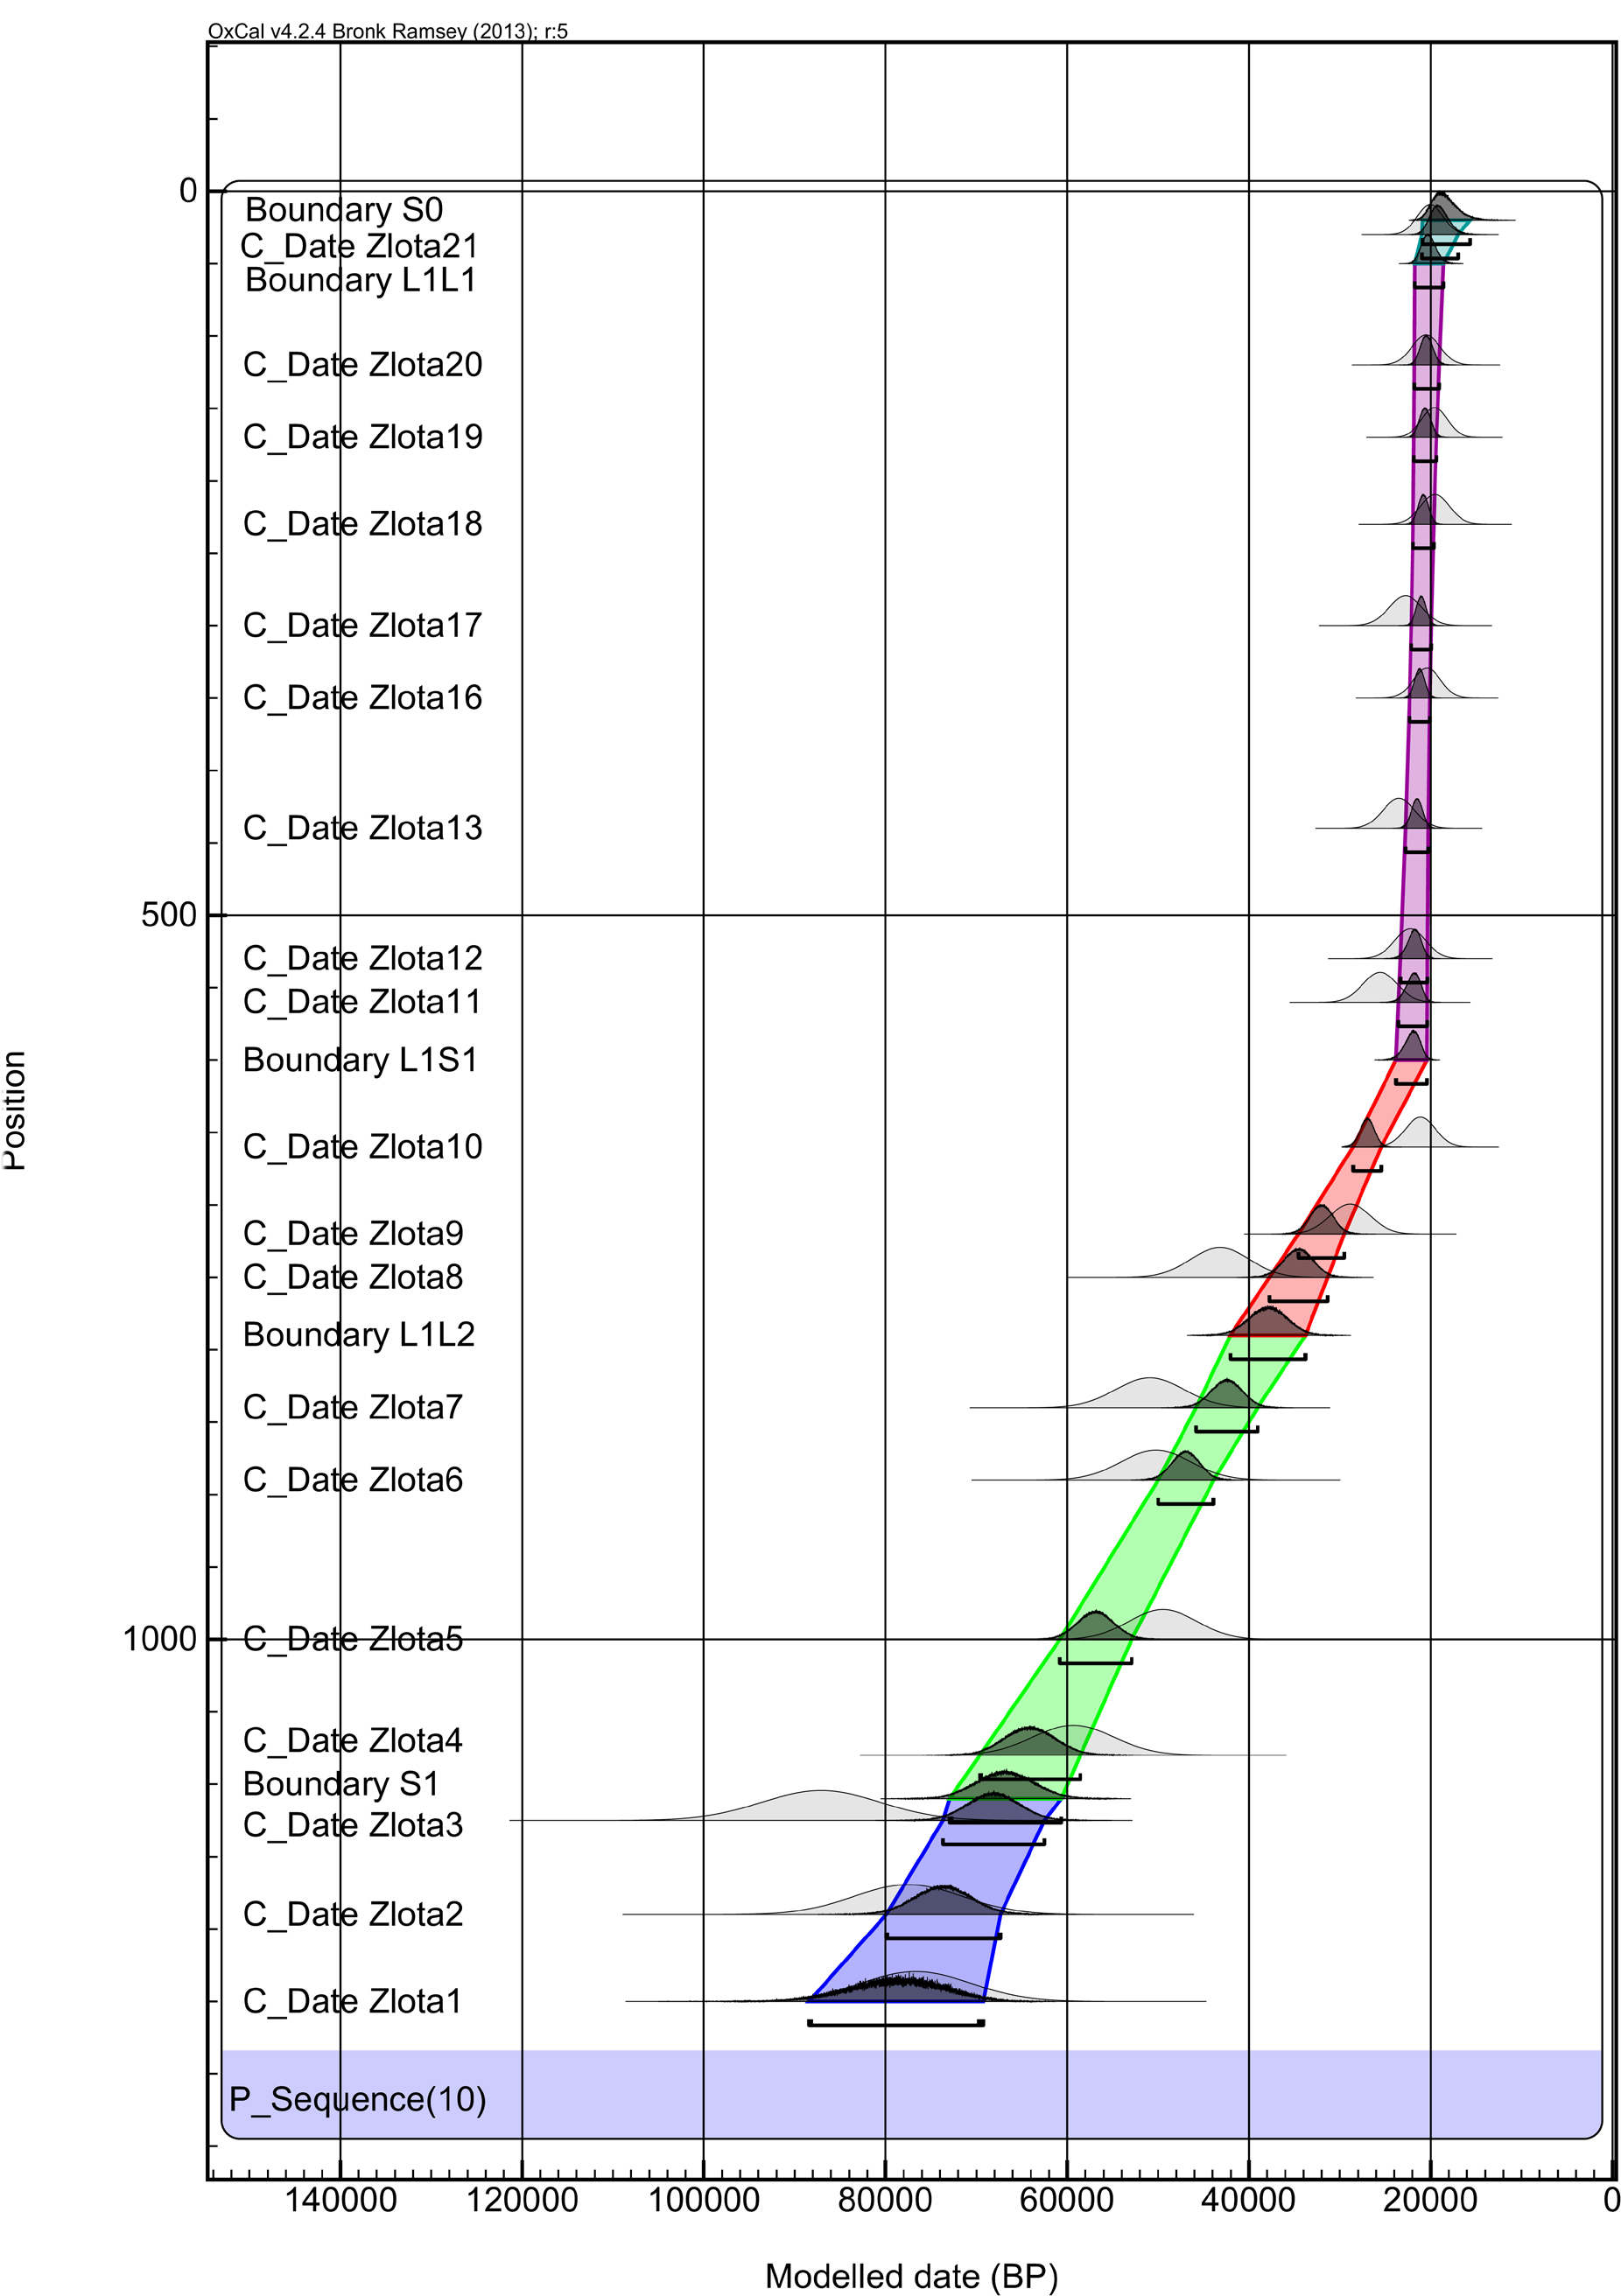
Fig. 4
OxCal age–depth model (Bronk Ramsey, 2009) for polimineral grains fraction.