
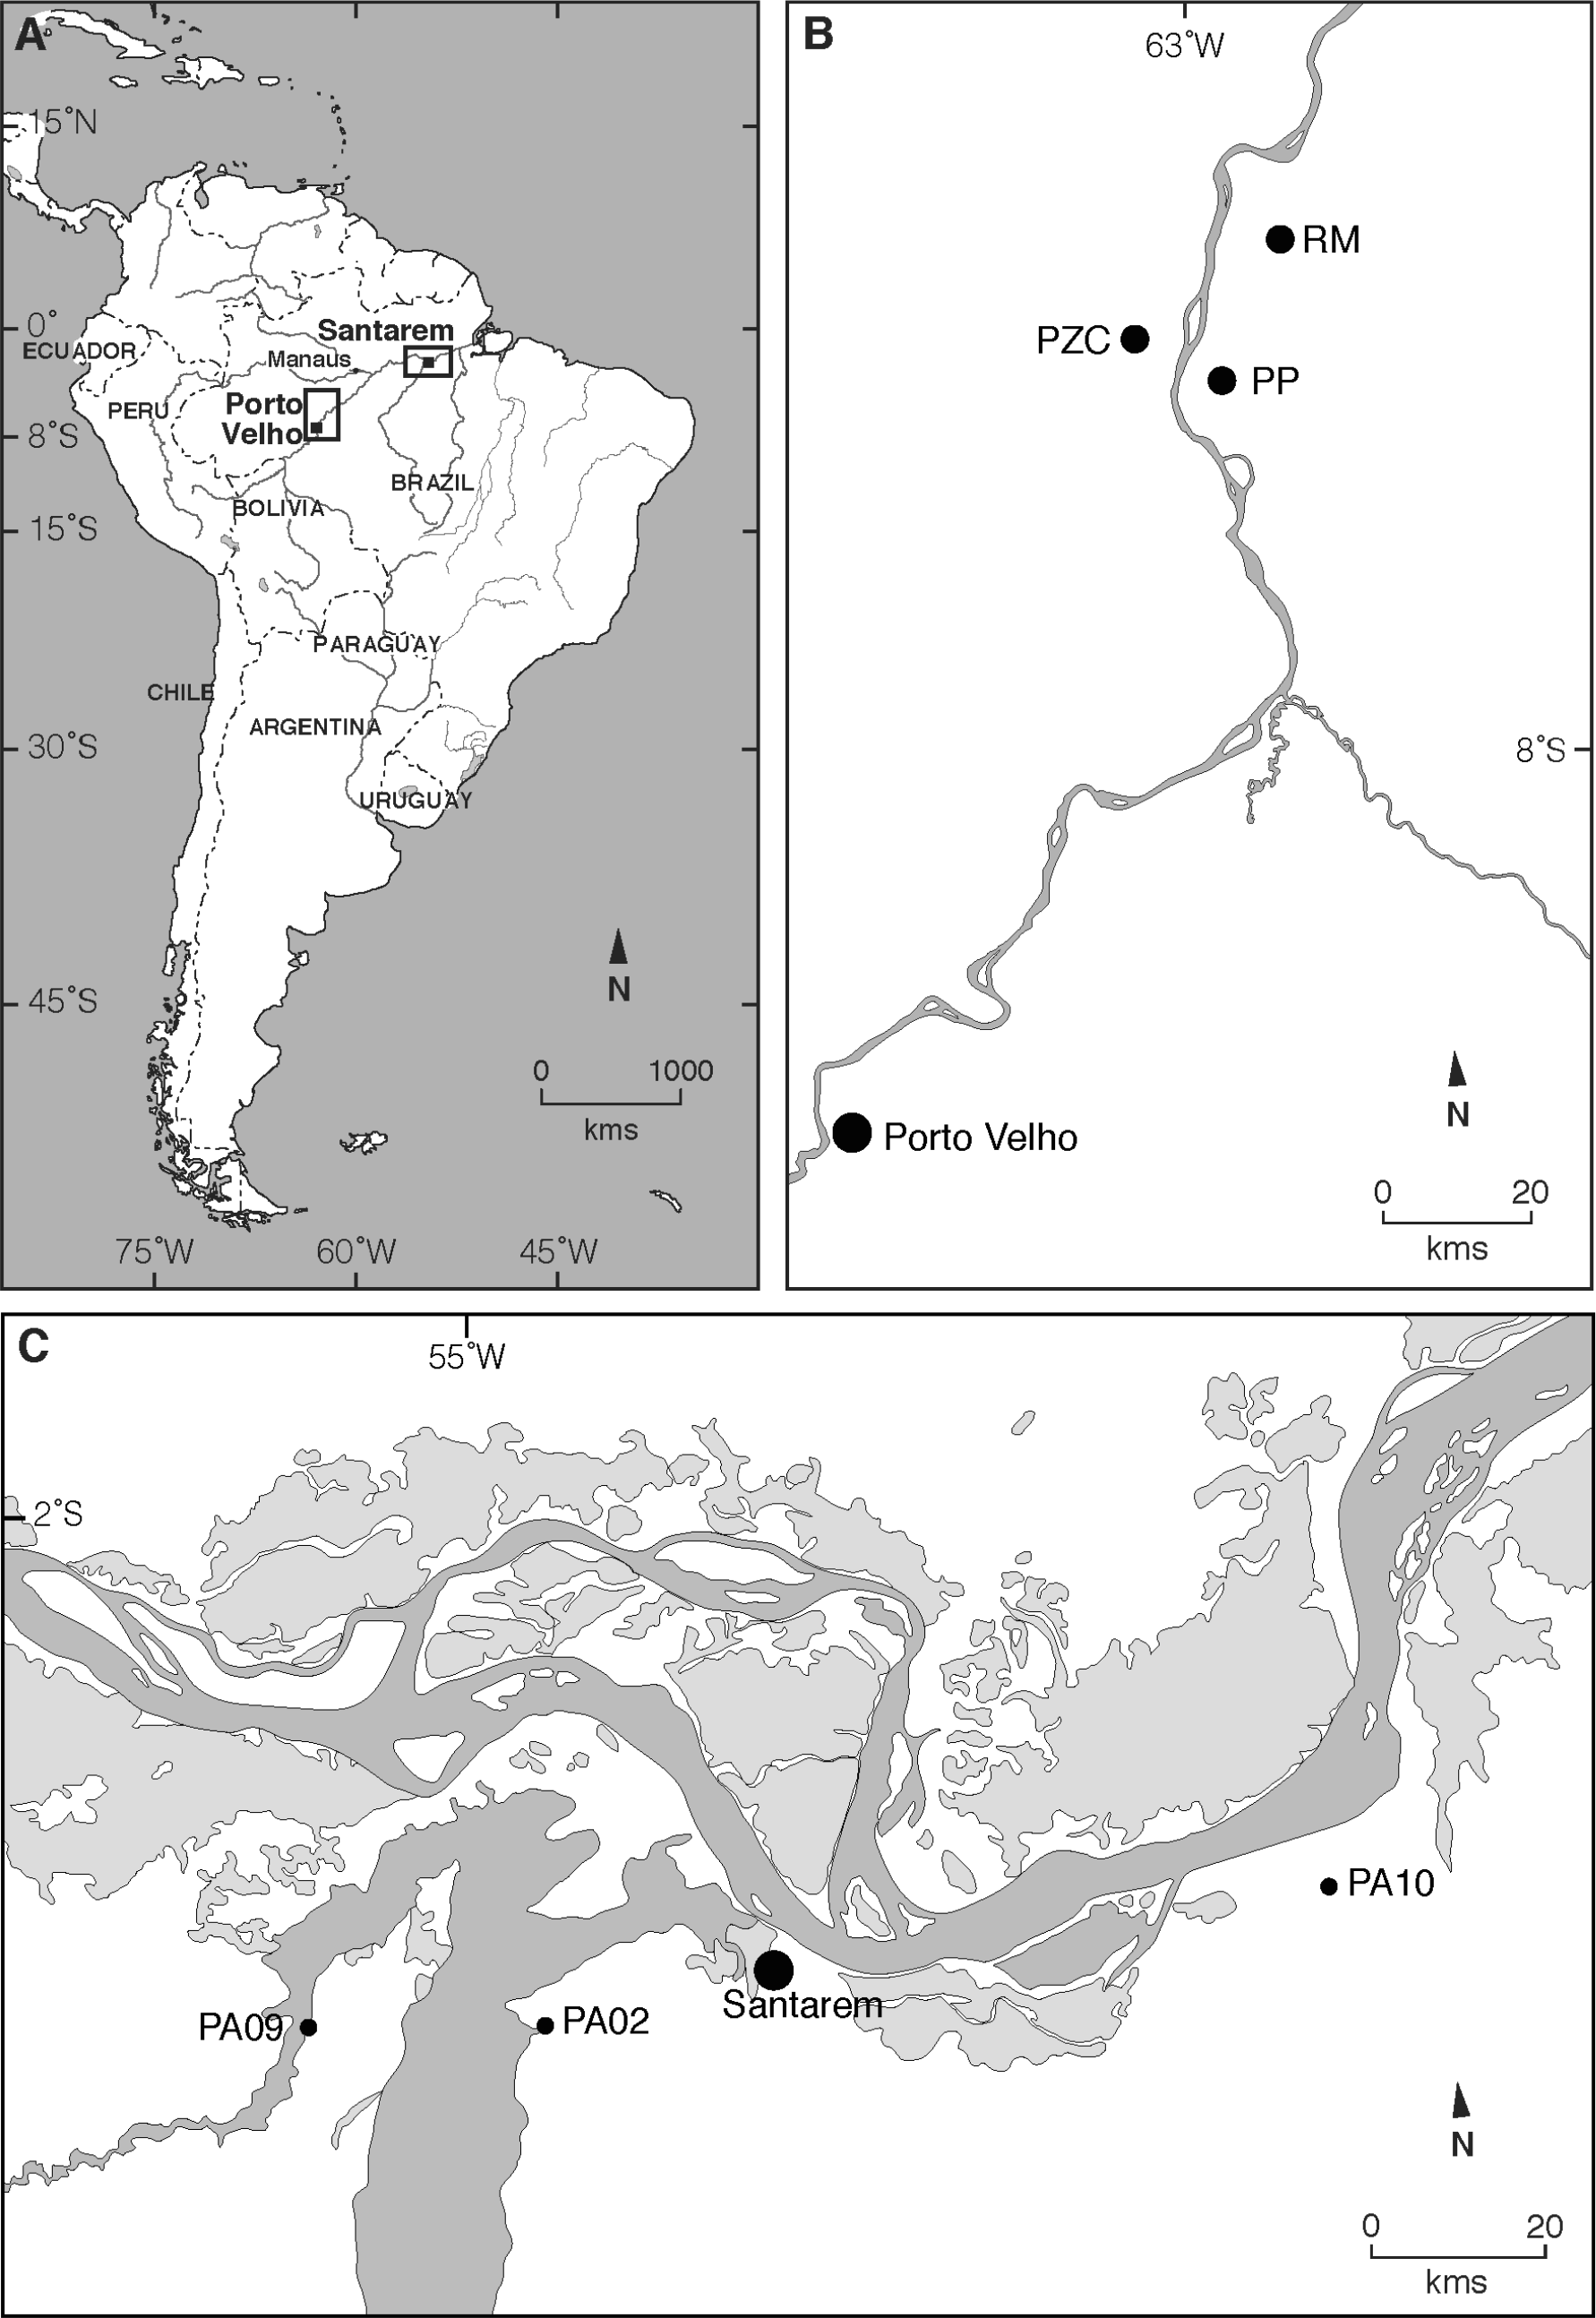
Figure 1
Study area: A) South America; B) Porto Velho region showing study sites RM, PP, PZC floodplain lakes adjacent to the Madeira River and; C) Santarem region showing study sites PA2 and PA9 floodplain lakes located near the Tapajos River, PA10 sediment core from a floodplain lake directly influenced by the Amazon River.
Table 1
Depth profiles of dry bulk density (DBD) (g cm-3) and mass accumulation rates (MAR) (g cm-2year-1) of the six sediment cores (PA2, PA9, PA10, RM, PP, PZC) studied in this work.
| Depth (cm) | PA2 | PA9 | PA10 | RM | PP | PZC | ||||||
|---|---|---|---|---|---|---|---|---|---|---|---|---|
| DBD | MAR | DBD | MAR | DBD | MAR | DBD | MAR | DBD | MAR | DBD | MAR | |
| 0–2 | 0.54 | 0.18 | 0.48 | 0.53 | 1.01 | 0.34 | 0.65 | 0.37 | 0.89 | 0.28 | 0.74 | 0.33 |
| 2–4 | 0.55 | 0.19 | 0.53 | 0.58 | 0.89 | 0.30 | 0.63 | 0.36 | 0.81 | 0.26 | 0.56 | 0.25 |
| 4–6 | 0.58 | 0.20 | 0.60 | 0.66 | 1.03 | 0.35 | 0.77 | 0.44 | 0.83 | 0.26 | 0.62 | 0.28 |
| 6–8 | 0.59 | 0.20 | 0.56 | 0.61 | 1.07 | 0.36 | 0.69 | 0.39 | 0.84 | 0.27 | 0.72 | 0.32 |
| 8–10 | 0.62 | 0.21 | 0.58 | 0.63 | 1.04 | 0.35 | 0.71 | 0.40 | 0.77 | 0.25 | 0.72 | 0.32 |
| 10–12 | 0.61 | 0.21 | 0.59 | 0.65 | 1.05 | 0.36 | 0.75 | 0.43 | 0.78 | 0.25 | 0.76 | 0.34 |
| 12–14 | 0.57 | 0.19 | 0.63 | 0.70 | 1.14 | 0.39 | 0.70 | 0.40 | 0.94 | 0.30 | 0.72 | 0.32 |
| 14–16 | 0.62 | 0.21 | 0.66 | 0.72 | 1.10 | 0.37 | 0.68 | 0.39 | 1.02 | 0.33 | 0.91 | 0.41 |
| 16–18 | 0.58 | 0.20 | 0.63 | 0.69 | 0.99 | 0.34 | 0.66 | 0.37 | 1.05 | 0.33 | 0.71 | 0.32 |
| 18–20 | 0.57 | 0.19 | 0.62 | 0.68 | 1.07 | 0.36 | 0.64 | 0.36 | 1.00 | 0.32 | 0.77 | 0.34 |
| 20–22 | 0.59 | 0.20 | 0.63 | 0.70 | 0.96 | 0.33 | 0.74 | 0.42 | 0.90 | 0.29 | 0.78 | 0.35 |
| 22–24 | 0.59 | 0.20 | 0.62 | 0.68 | 1.00 | 0.34 | 0.70 | 0.40 | 1.06 | 0.34 | 0.72 | 0.32 |
| 24–26 | 0.58 | 0.20 | 0.61 | 0.68 | 0.97 | 0.33 | 0.67 | 0.38 | 1.00 | 0.32 | 0.81 | 0.37 |
| 26–28 | 0.58 | 0.20 | 0.66 | 0.73 | 1.05 | 0.36 | 0.77 | 0.44 | 0.94 | 0.30 | 0.96 | 0.43 |
| 28–30 | 0.59 | 0.20 | 0.72 | 0.79 | 0.95 | 0.32 | 0.71 | 0.40 | 0.96 | 0.31 | 0.81 | 0.37 |
| 30–32 | 0.62 | 0.21 | 0.71 | 0.78 | 0.95 | 0.32 | 0.81 | 0.46 | 0.96 | 0.31 | 0.78 | 0.35 |
| 32–34 | 0.55 | 0.19 | 0.68 | 0.75 | 1.30 | 0.44 | 0.81 | 0.46 | 1.09 | 0.35 | 0.81 | 0.37 |
| 34–36 | 0.57 | 0.19 | 0.63 | 0.69 | 1.57 | 0.53 | 0.77 | 0.44 | 1.05 | 0.34 | 0.92 | 0.41 |
| 36–38 | 0.56 | 0.19 | 0.70 | 0.77 | 1.36 | 0.46 | 0.74 | 0.42 | 1.00 | 0.32 | 0.72 | 0.33 |
| 38–40 | 0.53 | 0.18 | 0.69 | 0.76 | 1.36 | 0.46 | 0.70 | 0.40 | 0.99 | 0.32 | 0.77 | 0.35 |
| 40–42 | 0.54 | 0.18 | 0.70 | 0.77 | 1.45 | 0.49 | 0.72 | 0.41 | 0.98 | 0.31 | 0.82 | 0.37 |
| 42–44 | 0.55 | 0.19 | 0.69 | 0.76 | 1.55 | 0.53 | 0.72 | 0.41 | 0.98 | 0.31 | 0.90 | 0.40 |
| 44–46 | 0.69 | 0.23 | 0.70 | 0.77 | 1.75 | 0.60 | 0.84 | 0.48 | 1.06 | 0.34 | 0.95 | 0.43 |
| 46–48 | 0.68 | 0.23 | 0.72 | 0.79 | 1.47 | 0.50 | 0.77 | 0.44 | 0.44 | 0.32 | 0.86 | 0.39 |
| 48–50 | 0.62 | 0.21 | 0.68 | 0.75 | 1.36 | 0.30 | 0.74 | 0.42 | 0.42 | 0.32 | 0.72 | 0.39 |
| Average | 0.59 | 0.20 | 0.64 | 0.70 | 1.18 | 0.39 | 0.72 | 0.41 | 0.91 | 0.31 | 0.78 | 0.35 |
| Stand Dev | 0.04 | 0.01 | 0.06 | 0.07 | 0.23 | 0.08 | 0.05 | 0.03 | 0.17 | 0.03 | 0.09 | 0.04 |
Table 2
Sediment accumulation rates (mm year-1) and inventories (mBq cm-2)based on the 210Pb and 239+240Pu sediment dating methods.
| Study Site | 210Pb (mm year-1) | 210Pb Bq cm-2 | 239+240Pu (mm year-1) | 239+240Pu (mBq cm-2) | Major River |
|---|---|---|---|---|---|
| PA2 | 2.7 | 6.5 | 2.4 | 4.9 | Tapajos |
| PA9 | 18.6 | 7.0 | 10.2 | 1.0 | Tapajos |
| PA10 | 8.2 | 53.6 | 2.3 | 0.5 | Amazon |
| PP | 6.2 | 22.4 | 3.4 | 2.7 | Madeiras |
| PZC | 5.8 | 3.1 | 4.2 | 2.0 | Madeiras |
| RM | 6.1 | 40.2 | 6.2 | 3.7 | Madeiras |
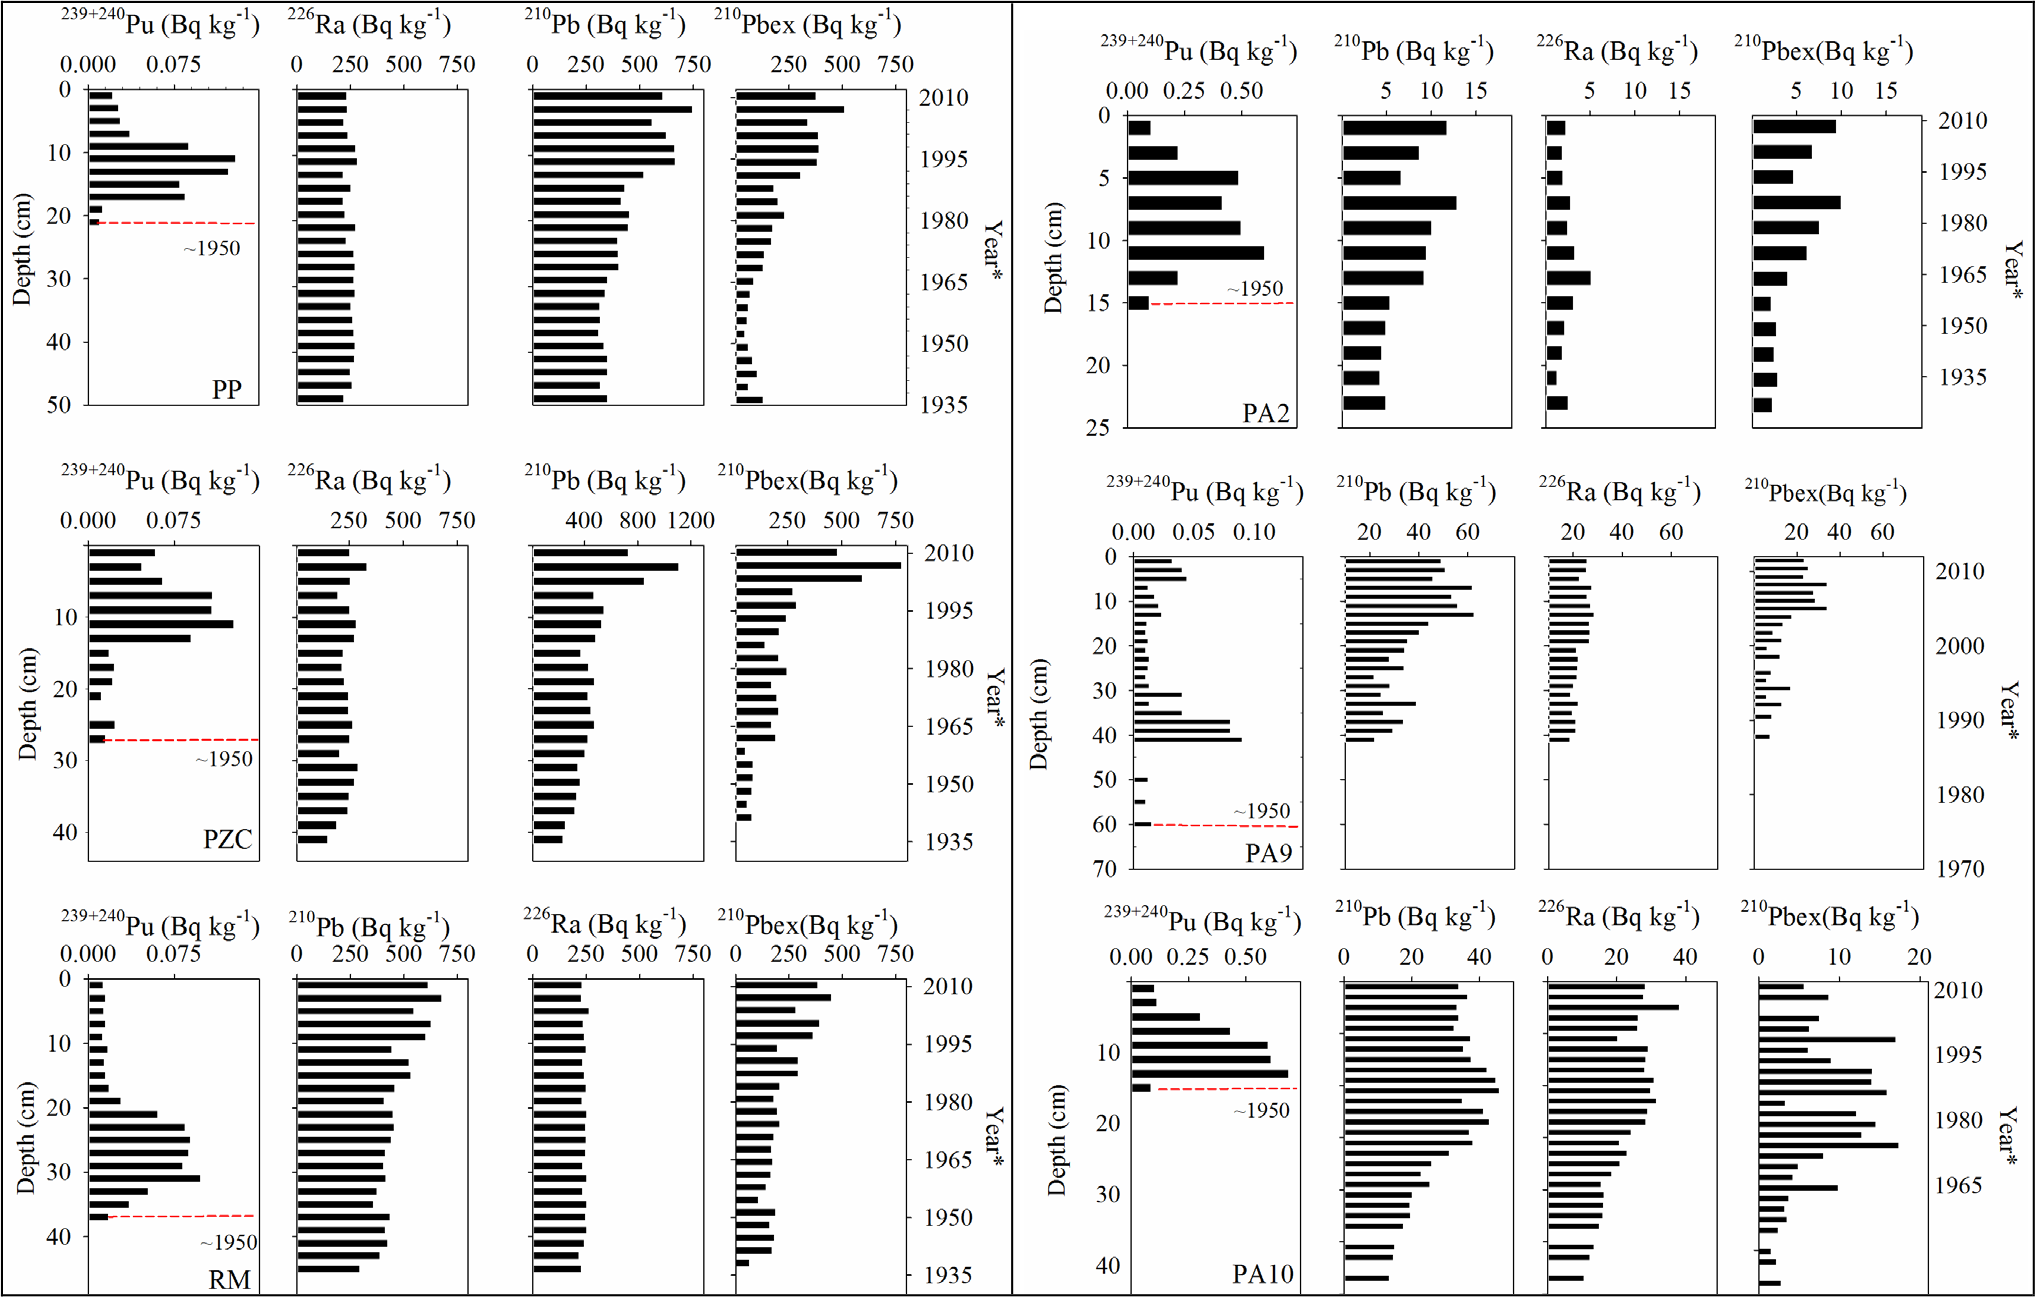
Figure 2
239+240Pu, 210Pb, 226Ra and 210Pbex profiles from the six sediment cores in this work. The first occurrence of 239+240Pu indicates ~1950 when these radionuclides were first introduced into the atmosphere. The ~1950 mark on the 210Pbex profiles are based on the sediment accumulation rates dated through the Constant Initial Concentration (CIC) approach (Appleby and Oldfield, 1992). PP, PZC, RM, PA2, PA9, PA10 - study sites.