
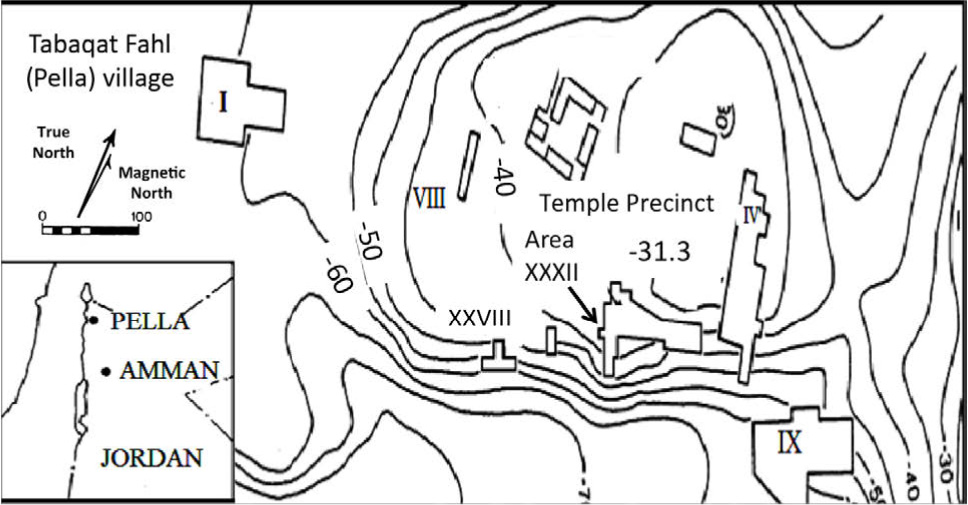
Figure 1
Contour map of Pella with location map shown inset.
Table 1
Relevant radiocarbon ages for samples from the destruction horizon. The calibration of 14C dates with the calibration software OxCal version 3.10., and the calibration curve lntCal09 (Fischer, 2013)1.
| VERA# (ABA)* | 14C age (BP) | Era and phase | Calibrated 2σ BCE | |
|---|---|---|---|---|
| Pella | VERA 5311 | 2940 ± 35 | IAI-II | 1270–1020 BCE (94%) |
| Pella | VERA 5301 | 2930 ± 35 | IAI-II | 1260–1010 BCE (91%) |
| Pella | VERA 5316 | 2925 ± 35 | IAI-II | 1260–1010 BCE (95%) |
| Pella | VERA 5310 | 2885 ± 35 | IAI-II | 1210–970 BCE (93%) |
1 Vera 5308 and 5316 were processed by Professor Peter Fischer at Vienna in 2011, as part of an SCIEM2000 project on the Iron Age chronology of the Jordan Valley (Wild and Fischer, 2013, 461, n.90). Bourke would like to thank Fischer for making these dates available for discussion here.
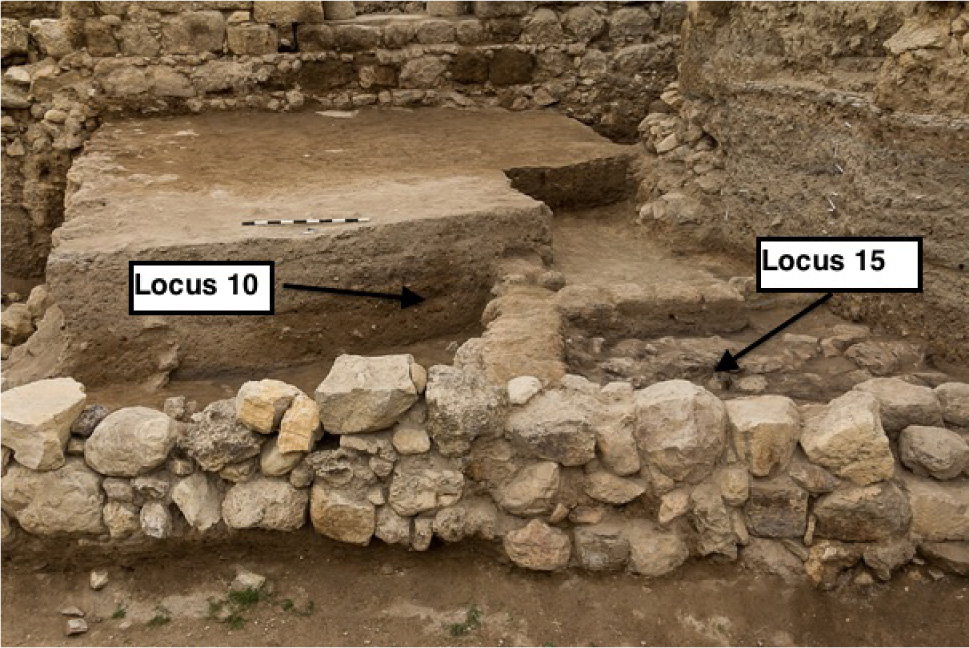
Figure 2
Potshards were collected from layer 10.6 and the stratigphicaly underlying layers 15.1 and 15.2 (bottom layer) (photograph by S. Bourke).
Table 2
Activities derived from gamma spectrometry for the standards used in Ankjærgaard and Murray (2007) together with a comparison of their conversion factors and those derived here using the modifactions discussed in the text.
| 238U (Bq·kg-1) | 232Th (Bq·kg-1) | 40K (Bq·kg-1) | Observed beta counts (cks-1) | CR/β (ks-1/(Gy·ka-1)) | MCR/β (ks-1/(Gy·ka-1)) | CR/α (ks-1/(Gy·ka-1)) | |
|---|---|---|---|---|---|---|---|
| 238U standard | 972 ± 9 | 14.7 ± 0.7 | 515 ± 10 | 739.4 ± 1.6 | 66.7 ± 3.1 | 53.05 ± 0.96 | 3.9 ± 0.1 |
| 232Th standard | 9.36 ± 1.23 | 1792 ± 30 | 571 ± 14 | 878.56 ± 1.84 | 61.3 ± 0.8 | 56.7 ± 1.9 | 2.4 ± 0.1 |
| 40K standard | - | - | 13767 ± 94 | 61.20 ± 1 | 61.20 ± 1 | - |
CR/β — Count rate/beta dose rate, (Ankjærgaard and Murray, 2007)
MCR/β — Modified Count rate/beta dose rate
CR/α — Count rate/alpha dose rate
Table 3
gamma spectrometry analyses of mixtures of 14 potshards from each layer, and the fractional contribution from each nuclide to beta count rate factors.
| Beta dose rate (Gy/ka) | Alpha dose rate (Gy/ka) | ||||
|---|---|---|---|---|---|
| 238U | 232Th | 40K | 238U | 232Th | |
| L10.6 | 1.21 ± 0.02 | 0.137 ± 0.006 | 1.13 ± 0.05 | 22.9 ± 0.3 | 3.6 ± 0.2 |
| L15.1 | 2.32 ± 0.04 | 0.182 ± 0.008 | 1.51 ± 0.12 | 44.1 ± 0.6 | 4.9 ± 0.3 |
| L15.2 | 0.843 ± 0.014 | 0.09 ± 0.01 | 0.79 ± 0.05 | 16.1 ±0.2 | 2.5 ± 0.2 |
| Fractional beta count rate contribution from each nuclide | |||||
| 238U | 232Th | 40K | Observed average beta count rate (cks-1) | ||
| L10.6 | 0.45 ± 0.02 | 0.055 ± 0.003 | 0.49 ± 0.03 | 150 ± 2 | |
| L15.1 | 0.55 ± 0.03 | 0.045 ± 0.005 | 0.41 ±0.05 | 180 ± 3 | |
| L15.2 | 0.45 ± 0.02 | 0.054 ± 0.005 | 0.5 ± 0.04 | 198 ± 2 | |
Table 4
Derived beta and alpha dose rates using the observed beta count rate from each shard. The gamma dose derived from gamma spectrometry analyses of sediment samples from each layer is given at the end of the table.
| Sample | Observed beta counts (cks-1) | Beta dose rate (Gy/ka) | Alpha dose rate (Gy/ka) | |
|---|---|---|---|---|
| L10.6.1 | 170 ± 2 | 2.98 ± 0.10 | 28.83 ± 0.04 | |
| L10.6.2 | 131 ± 2 | 2.30 ± 0.08 | 22.32 ± 0.03 | |
| L10.6.3 | 170 ± 2 | 2.98 ± 0.10 | 28.90 ± 0.04 | |
| L10.6.4 | 441 ± 3 | 7.7 ± 0.3 | 74.87 ± 0.09 | |
| L10.6.5 | 168 ± 2 | 2.94 ± 0.10 | 28.45 ± 0.04 | |
| L10.6.6 | 156 ± 2 | 2.73 ± 0.09 | 26.43 ± 0.04 | |
| L10.6.7 | 153 ± 2 | 2.68 ± 0.09 | 25.98 ± 0.03 | |
| L10.6.8 | 139 ± 2 | 2.44 ± 0.08 | 23.60 ± 0.03 | |
| L10.6.9 | 142 ± 2 | 2.49 ± 0.08 | 24.12 ± 0.03 | |
| L10.6.11 | 105 ± 2 | 1.85 ± 0.07 | 17.86 ± 0.02 | |
| L10.6.12 | 183 ± 2 | 3.22 ± 0.11 | 31.15 ± 0.04 | |
| L10.6.13 | 177 ± 2 | 3.11 ± 0.10 | 30.06 ± 0.04 | |
| L10.6.14 | 123 ± 2 | 2.16 ± 0.07 | 20.90 ± 0.03 | |
| L10.6.15 | 136 ± 2 | 2.39 ± 0.08 | 23.13 ± 0.03 | |
| L10.6.16 | 168 ± 2 | 2.95 ± 0.10 | 28.51 ± 0.04 | |
| L10.6.17 | 217 ± 3 | 3.81 ± 0.13 | 36.83 ± 0.05 | |
| L10.6.18 | 156 ± 2 | 2.74 ± 0.10 | 26.55 ± 0.04 | |
| L10.6.19 | 106 ± 2 | 1.85 ± 0.07 | 17.94 ± 0.03 | |
| L10.6.20 | 131.6 ± 2 | 2.31 ± 0.08 | 22.34 ± 0.03 | |
| L15.1.1 | 192 ± 3 | 3.4 ± 0.2 | 37.64 ± 0.08 | |
| L15.1.2 | 165 ± 3 | 2.9 ± 0.2 | 32.32 ± 0.07 | |
| L15.1.3 | 188 ± 3 | 3.3 ± 0.2 | 36.89 ± 0.07 | |
| L15.1.4 | 172 ± 3 | 3.1 ± 0.2 | 33.76 ± 0.07 | |
| L15.1.6 | 177 ± 2 | 3.2 ± 0.2 | 34.8 ± 0.8 | |
| L15.1.7 | 144 ± 2 | 2.55 ± 0.14 | 28.17 ± 0.06 | |
| L15.1.8 | 196 ± 2 | 3.5 ± 0.2 | 38.55 ± 0.08 | |
| L15.1.9 | 172 ± 2 | 3.1 ± 0.2 | 33.68 ± 0.07 | |
| L15.1.10 | 292 ± 3 | 5.2 ± 0.3 | 57.38 ± 0.11 | |
| L15.1.11 | 219 ± 3 | 3.9 ± 0.2 | 43.03 ± 0.08 | |
| L15.1.12 | 123 ± 2 | 2.19 ± 0.12 | 24.18 ± 0.08 | |
| L15.1.13 | 144 ± 2 | 2.56 ± 0.14 | 28.30 ± 0.06 | |
| L15.1.14 | 165 ± 2 | 2.9 ± 0.2 | 32.47 ± 0.06 | |
| L15.1.15 | 177 ± 2 | 3.2 ± 0.2 | 34.81 ± 0.07 | |
| L15.1.16 | 222 ± 2 | 3.9 ± 0.2 | 43.51 ± 0.08 | |
| L15.1.17 | 172 ± 2 | 3.1 ± 0.2 | 33.72 ± 0.07 | |
| L15.1.18 | 135 ± 2 | 2.41 ± 0.13 | 26.58 ± 0.05 | |
| L15.1.19 | 248 ± 3 | 4.4 ± 0.2 | 48.77 ± 0.09 | |
| L15.1.20 | 169 ± 3 | 3.0 ± 0.2 | 33.18 ± 0.07 | |
| L15.2.1 | 157 ± 2 | 2.76 ± 0.11 | 26.79 ± 0.04 | |
| L15.2.2 | 134 ± 2 | 2.34 ± 0.10 | 22.74 ± 0.04 | |
| L15.2.3 | 281 ± 3 | 4.9 ± 0.2 | 47.80 ± 0.07 | |
| L15.2.4 | 108 ± 2 | 1.89 ± 0.08 | 18.36 ± 0.03 | |
| L15.2.5 | 179 ± 3 | 3.13 ± 0.13 | 30.39 ± 0.05 | |
| L15.2.6 | 264 ± 3 | 4.6 ± 0.2 | 44.97 ± 0.07 | |
| L15.2.7 | 283 ± 3 | 5.0 ± 0.2 | 48.17 ± 0.05 | |
| L15.2.8 | 176 ± 2 | 3.08 ± 0.12 | 29.89 ± 0.05 | |
| L15.2.9 | 133 ± 2 | 2.34 ± 0.10 | 22.66 ± 0.04 | |
| L15.2.10 | 259 ± 3 | 4.6 ± 0.2 | 44.15 ± 0.07 | |
| L15.2.12 | 221 ± 2 | 3.9 ± 0.2 | 37.68 ± 0.06 | |
| L15.2.13 | 211 ± 2 | 3.7 ± 0.2 | 35.98 ± 0.06 | |
| L15.2.14 | 200 ± 2 | 3.50 ± 0.14 | 34.00 ± 0.05 | |
| L15.2.15 | 184 ± 2 | 3.23 ± 0.13 | 31.35 ± 0.05 | |
| L15.2.17 | 172 ± 2 | 3.01 ± 0.12 | 29.25 ± 0.05 | |
| L15.2.18 | 168 ± 2 | 2.94 ± 0.12 | 28.54 ± 0.05 | |
| L15.2.19 | 162 ± 2 | 2.84 ± 0.11 | 27.55 ± 0.04 | |
| L15.2.20 | 136 ± 2 | 2.39 ± 0.10 | 23.21 ± 0.04 | |
| External dose rate | ||||
| Soil samples | Gamma dose rate (Gy/ka) | 238U (Bq/kg) | 232Th (Bq/kg) | 40K (Bq/kg) |
| L10.6 | 1.01 ± 0.12 | 132 ± 32 | 13.8 ± 1.6 | 502 ± 25 |
| L15.1 | 1.64 ± 0.15 | 180 ± 24 | 12.9 ± 1.3 | 341 ± 21 |
| L15.2 | 1.26 ± 0.11 | 130 ± 23 | 11.4 ± 1.8 | 325 ± 24 |
Table 5
Summary of ages and related data for 52 potshards. The samples rejected because of low luminescence intensity (test dose response minus background, T-Bg, < 1000) are identified by italics, and the single underlined sample was rejected because of poor recycling ratio. The 3 outliers discussed in the text are highlighted in grey.
| Sample No. | Age (ka) | Rand. Error (ka) | De (Gy) | Dose rate (Gy/ka) | (T-Bg) | |
|---|---|---|---|---|---|---|
| 1 | L10.6.1 | 2.4 ± 0.2 | 0.2 | 12.7 ± 0.6 | 5.2 ± 0.4 | 2802 |
| 2 | L10.6.2 | 2.4 ± 0.2 | 0.2 | 10.5 ± 0.6 | 4.3 ± 0.3 | 2058 |
| 3 | L10.6.3 | 2.9 ± 0.3 | 0.2 | 15.2 ± 1.1 | 5.2 ± 0.4 | 1334 |
| 4 | L10.6.4 | 2.8 ± 0.3 | 0.2 | 37.4 ± 2.4 | 13.5 ± 0.9 | 1852 |
| 5 | L10.6.5 | 2.7 ± 0.3 | 0.2 | 13.9 ± 0.9 | 5.2 ± 0.4 | 3256 |
| 6 | L10.6.6 | 2.4 ± 0.2 | 0.11 | 12.0 ± 0.2 | 5.0 ± 0.4 | 11175 |
| 7 | L10.6.7 | 2.4 ± 0.2 | 0.11 | 12.04 ± 0.2 | 5.1 ± 0.4 | 11127 |
| 8 | L10.6.8 | 3.0 ± 0.2 | 0.13 | 14.2 ± 0.2 | 4.6 ± 0.3 | 2870 |
| 9 | L10.6.9 | 5.0 ± 0.7 | 0.6 | 22.2 ± 2.7 | 4.5 ± 0.4 | 547 |
| 10 | L10.6.11 | 10.7 ± 3.5 | 3.4 | 38.7 ± 12.3 | 3.6 ± 0.3 | 549 |
| 11 | L10.6.12 | 3.8 ± 0.5 | 0.4 | 22.1 ± 1.9 | 5.8 ± 0.4 | 2995 |
| 12 | L10.6.13 | 3.2 ± 0.6 | 0.6 | 17.5 ± 3.1 | 5.5 ± 0.5 | 670 |
| 13 | L10.6.15 | 6.6 ± 2.3 | 2.3 | 29.1 ± 9.9 | 4.4 ± 0.3 | 448 |
| 14 | L10.6.16 | 2.6 ± 0.2 | 0.11 | 13.7 ± 0.3 | 5.2 ± 0.4 | 3210 |
| 15 | L10.6.17 | 3.1 ± 0.3 | 0.2 | 19.3 ± 0.7 | 6.3 ± 0.5 | 4630 |
| 16 | L15.1.1 | 3.7 ± 0.6 | 0.5 | 25.2 ± 2.8 | 6.8 ± 0.6 | 1275 |
| 17 | L15.1.2 | 2.9 ± 0.3 | 0.2 | 16.89 ± 1.0 | 5.8 ± 0.5 | 1126 |
| 18 | L15.1.3 | 2.4 ± 0.3 | 0.2 | 15.5 ± 0.8 | 6.6 ± 0.6 | 2601 |
| 19 | L15.1.4 | 2.3 ± 0.2 | 0.14 | 14.2 ± 0.3 | 6.2 ± 0.6 | 8952 |
| 20 | L15.1.6 | 2.5 ± 0.2 | 0.15 | 15.6 ± 0.3 | 6.3 ± 0.6 | 5894 |
| 21 | L15.1.7 | 3.4 ± 0.6 | 0.5 | 18.3 ± 2.6 | 5.5 ± 0.5 | 659 |
| 22 | L15.1.8 | 3.0 ± 0.4 | 0.3 | 20.8 ± 1.8 | 6.9 ± 0.6 | 3714 |
| 23 | L15.1.9 | 3.5 ± 0.4 | 0.3 | 22.1 ± 1.3 | 6.3 ± 0.5 | 1257 |
| 24 | L15.1.10 | 3.7 ± 0.4 | 0.2 | 32.7 ± 0.7 | 8.9 ± 0.9 | 3879 |
| 25 | L15.1.11 | 4.1 ± 0.5 | 0.3 | 29.3 ± 1.5 | 7.2 ± 0.7 | 3146 |
| 26 | L15.1.12 | 8.7 ± 1.3 | 1.1 | 38.8 ± 4.4 | 4.5 ± 0.4 | 3631 |
| 27 | L15.1.13 | 3.2 ± 0.4 | 0.3 | 16.1 ± 1.2 | 5.0 ± 0.5 | 4649 |
| 28 | L15.1.14 | 5.9 ± 3.0 | 2.9 | 35.7 ± 17.6 | 6.1 ± 0.5 | 381 |
| 29 | L15.1.15 | 1.7 ± 0.8 | 0.8 | 10.3 ± 4.9 | 6.1 ± 0.6 | 353 |
| 30 | L15.1.16 | 2.5 ± 0.3 | 0.3 | 18.6 ± 1.8 | 7.4 ± 0.7 | 1164 |
| 31 | L15.1.17 | 4.1 ± 0.5 | 0.4 | 25.2 ± 1.7 | 6.2 ± 0.6 | 782 |
| 32 | L15.1.18 | 2.7 ± 0.9 | 0.9 | 13.9 ± 4.3 | 5.1 ± 0.5 | 616 |
| 33 | L15.1.19 | 1.5 ± 0.2 | 0.2 | 11.9 ± 1.2 | 8.0 ± 0.8 | 1221 |
| 34 | L15.1.20 | 4.0 ± 0.4 | 0.3 | 24.3 ± 0.9 | 6.1 ± 0.5 | 3073 |
| 35 | L15.2.1 | 2.6 ± 0.3 | 0.2 | 13.3 ± 0.9 | 5.2 ± 0.4 | 1498 |
| 36 | L15.2.2 | 2.7 ± 0.2 | 0.12 | 12.3 ± 0.3 | 4.6 ± 0.3 | 3561 |
| 37 | L15.2.3 | 2.3 ± 0.2 | 0.14 | 18.9 ± 0.9 | 8.4 ± 0.7 | 1617 |
| 38 | L15.2.4 | 6.5 ± 0.6 | 0.4 | 25.3 ± 1.4 | 3.9 ± 0.3 | 1284 |
| 39 | L15.2.5 | 2.9 ± 0.3 | 0.2 | 16.1 ± 0.8 | 5.6 ± 0.4 | 1322 |
| 40 | L15.2.6 | 1.69 ± 0.14 | 0.12 | 13.6 ± 0.5 | 8.1 ± 0.6 | 5259 |
| 41 | L15.2.7 | 6.7 ± 0.7 | 0.6 | 58.2 ± 4.7 | 8.7 ± 0.6 | 3657 |
| 42 | L15.2.8 | 2.5 ± 0.4 | 0.4 | 14 ± 2 | 5.6 ± 0.4 | 1245 |
| 43 | L15.2.9 | 2.8 ± 0.6 | 0.6 | 12.8 ± 2.8 | 4.6 ± 0.3 | 756 |
| 44 | L15.2.10 | 2.5 ± 0.2 | 0.10 | 19.5 ± 0.3 | 7.7 ± 0.6 | 10969 |
| 45 | L15.2.12 | 4.2 ± 1.0 | 1.0 | 28.5 ± 6.6 | 6.8 ± 0.5 | 903 |
| 46 | L15.2.13 | 1.8 ± 0.2 | 0.13 | 12.1 ± 0.8 | 6.8 ± 0.5 | 2987 |
| 47 | L15.2.14 | 4.8 ± 0.6 | 0.5 | 31.5 ± 2.9 | 6.5 ± 0.5 | 523 |
| 48 | L15.2.15 | 4.4 ± 0.3 | 0.2 | 26.2 ± 0.6 | 6.0 ± 0.4 | 12303 |
| 49 | L15.2.17 | 4.5 ± 0.5 | 0.4 | 23.9 ± 1.8 | 5.3 ± 0.4 | 1065 |
| 50 | L15.2.18 | 1.95 ± 0.2 | 0.2 | 10.9 ± 0.8 | 5.6 ± 0.4 | 4011 |
| 51 | L15.2.19 | 2.0 ± 0.2 | 0.12 | 10.9 ± 0.3 | 5.4 ± 0.4 | 2620 |
| 52 | L15.2.20 | 3.0 ± 0.6 | 0.6 | 14.0 ± 2.6 | 4.7 ± 0.3 | 956 |
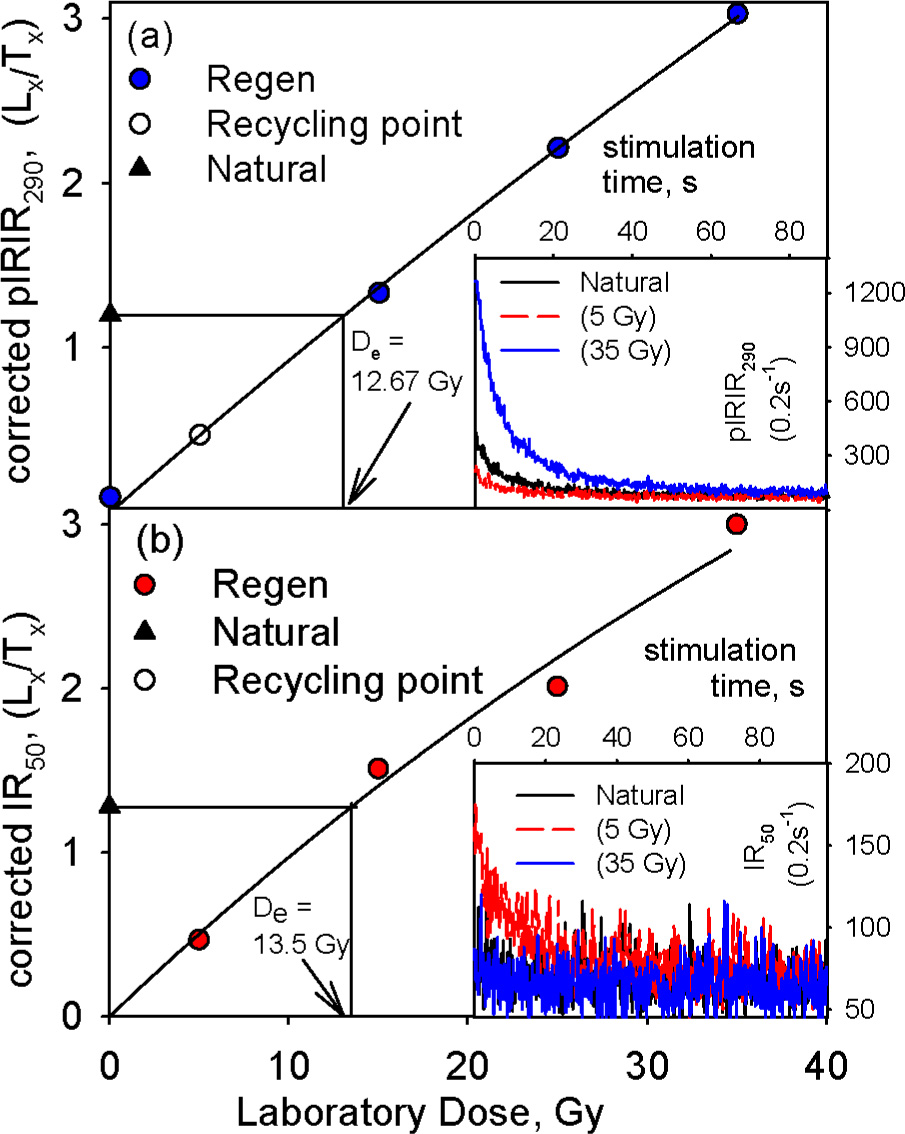
Figure 3
Representative dose response curve and (inset) natural and regenerated stimulation curves (a) for post-IR IRSL signals at 290°C and(b) for IR signal at 50°C for shard L15.1.4, from layer L15.1.
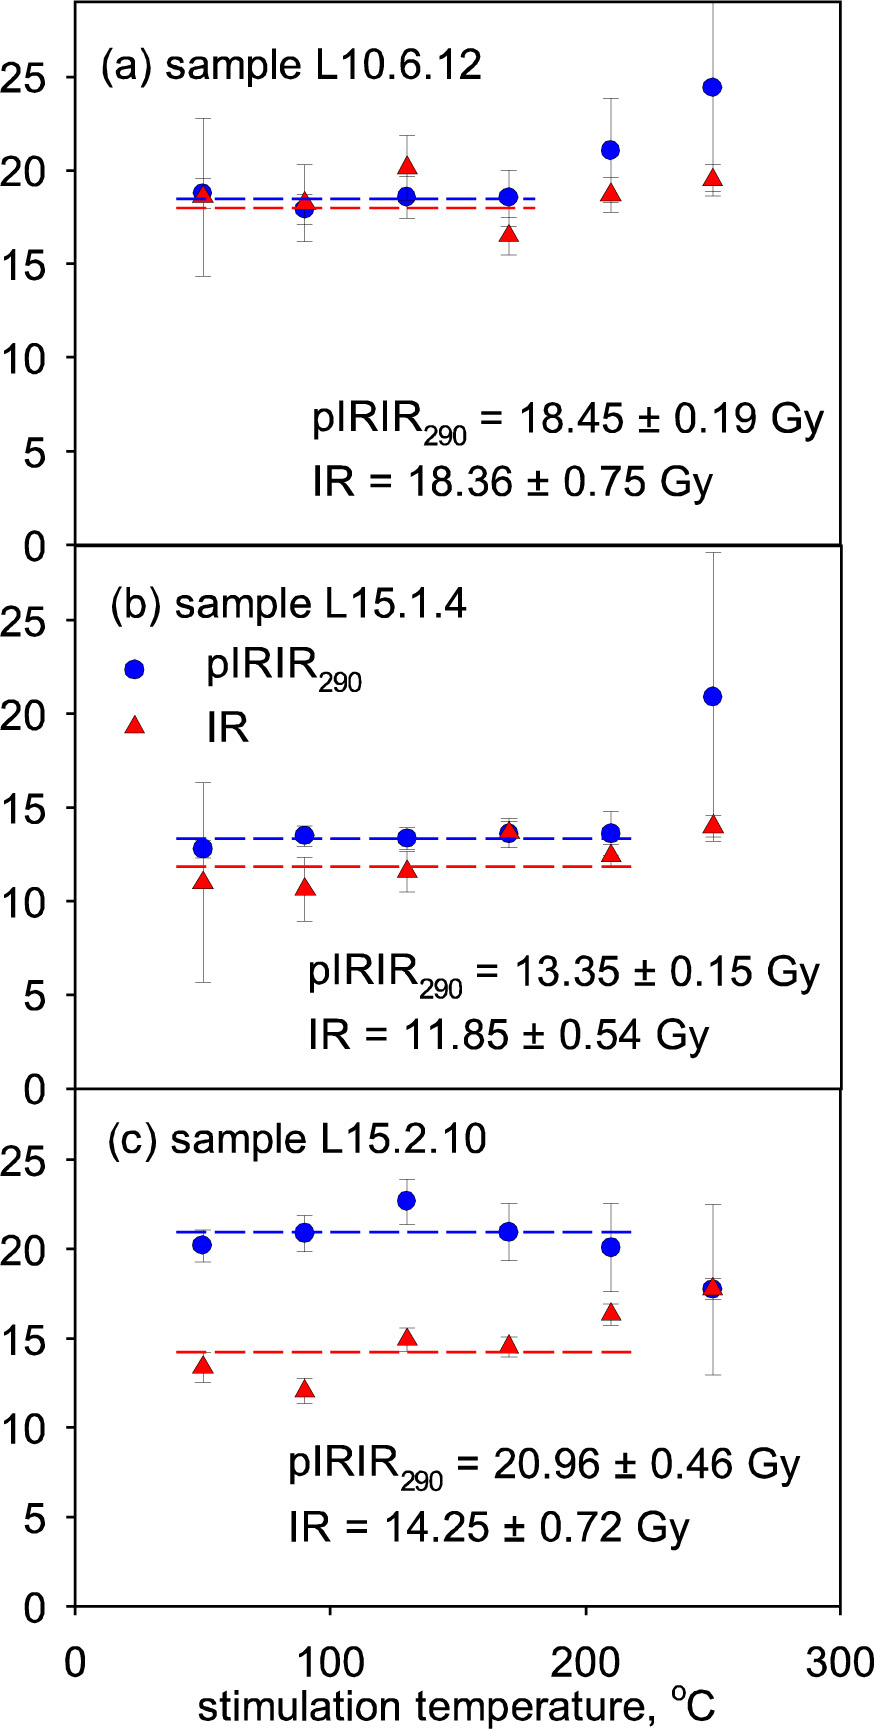
Figure 4
Dependence of De values on the first IR stimulation temperature for three representative samples (a) L10.6.12, (b) L15.14 and (c) L15.2.10. Red symbols — IR and blue symbols — pIRIR290.
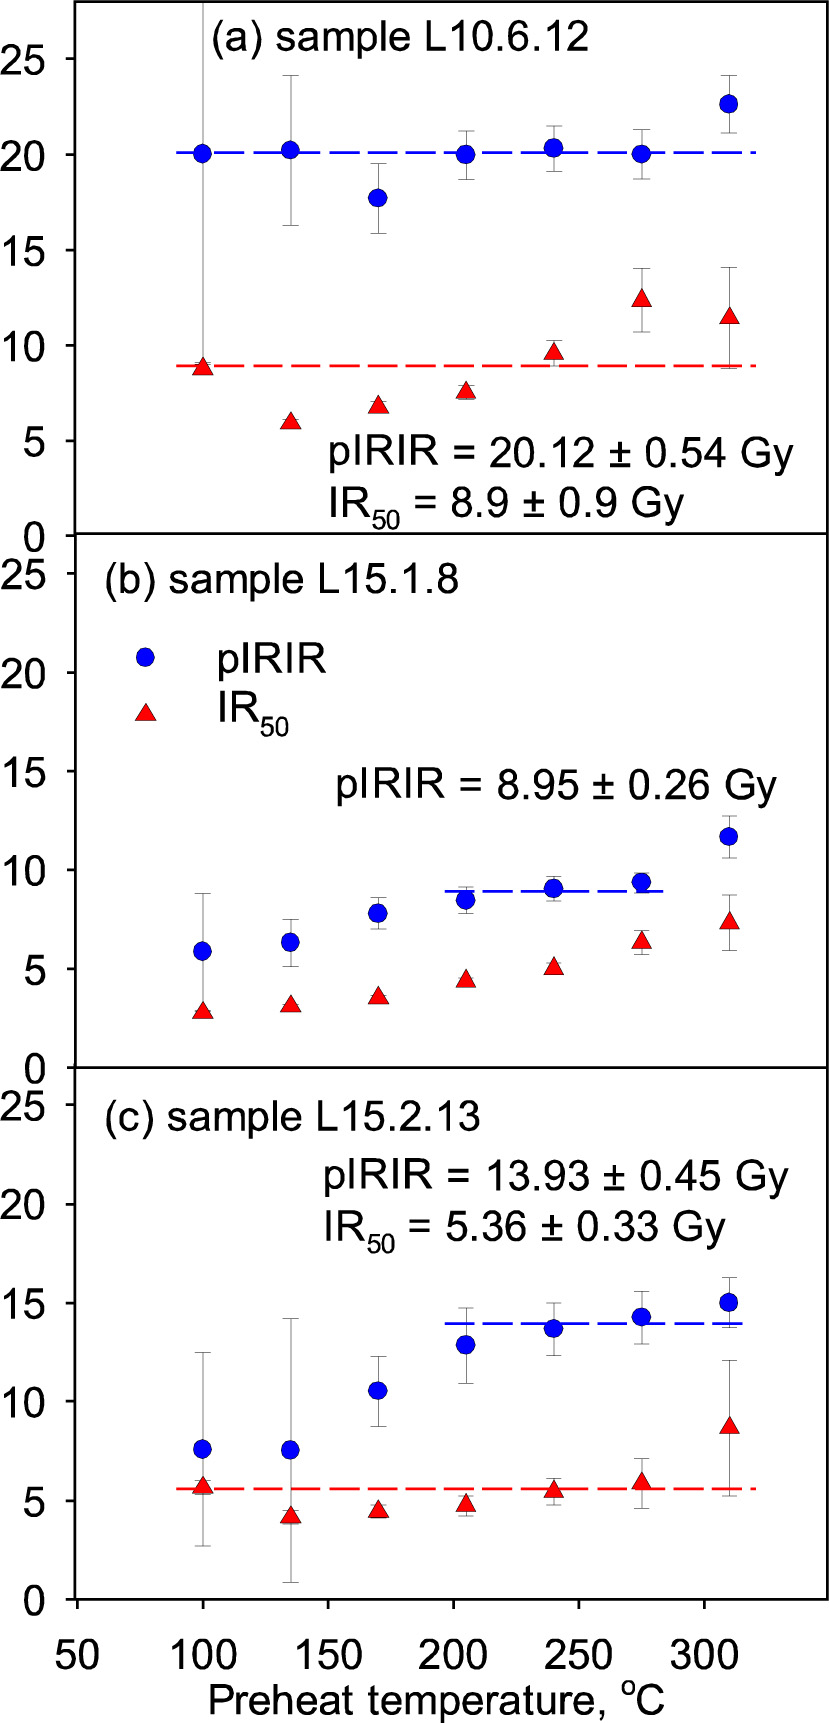
Figure 5
Dependence of De values on the preheat temperature for three representative samples (a) L10.6.12, (b) L15.1.8 and (c) L15.2.13. Red symbols — IR50, blue symbols — pIRIR.
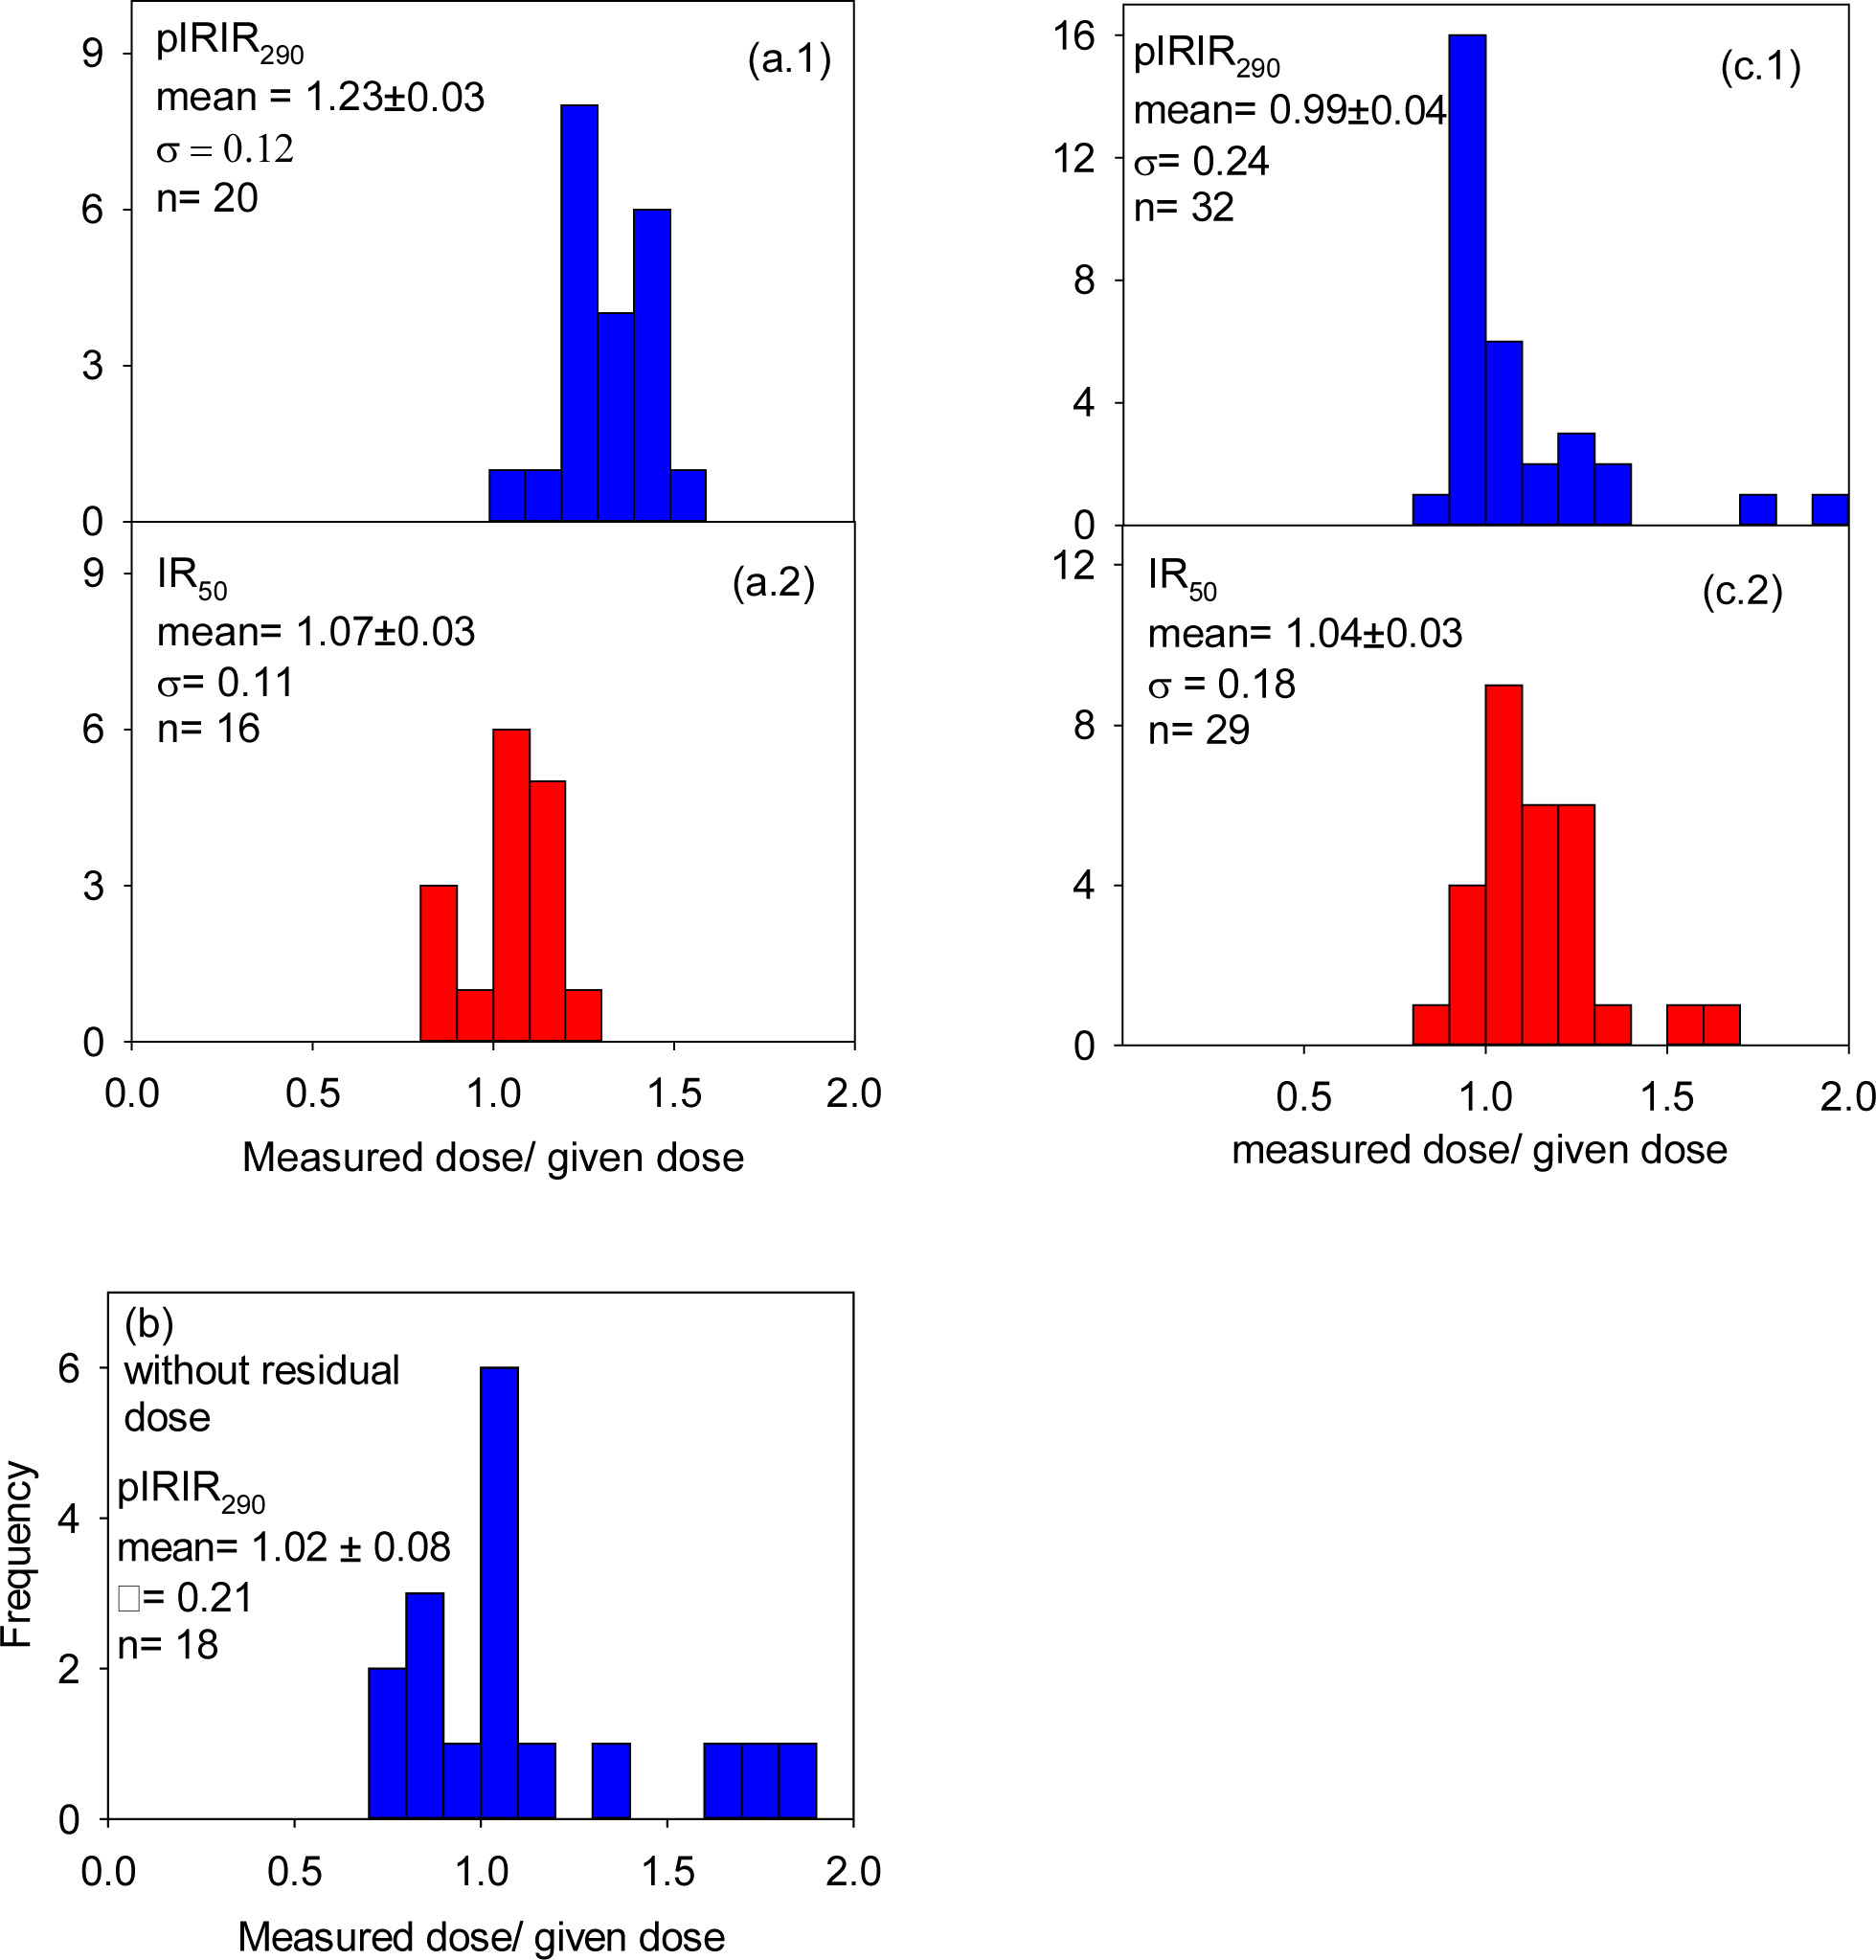
Figure 6
Ratios of measured equivalent dose to the given dose for both signals in dose recovery measurements: (a) samples heated to 500°C in oven before giving laboratory dose (a. 1 for pIRIR290 signal and a.2 for IR50 signal); (b) samples exposed in solar stimulator for 4 hours before giving laboratory. Note that the IR50 signals were too weak to derive a meaningful dose recovery histogram; (c) samples given laboratory dose in addition to their natural dose, the measured dose to the given dose ratio was calculated after subtracting the natural dose from the total measured dose (c. 1 and c.2 for pIRIR290 and IR50 respectively).
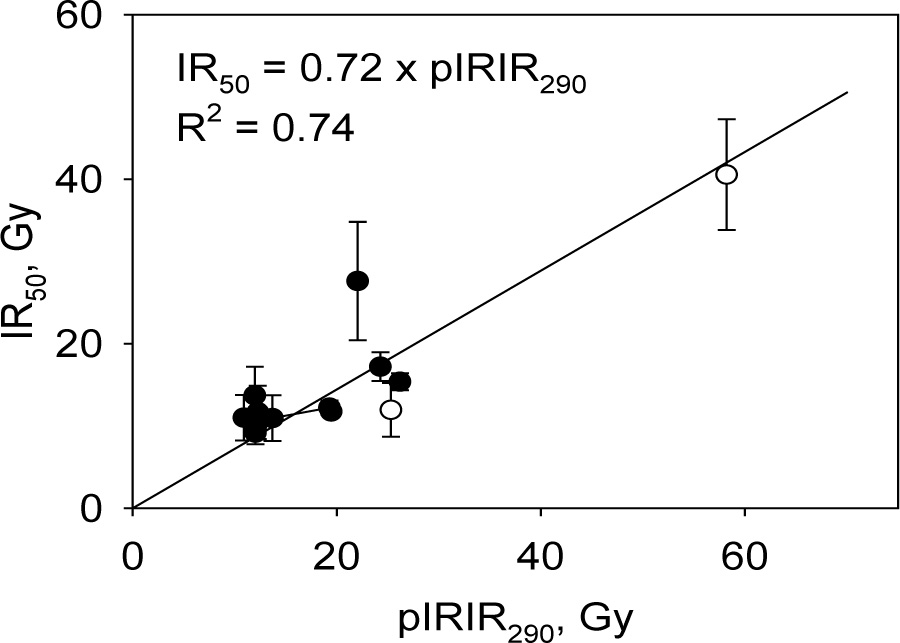
Figure 7
Comparison of IR50 De and pIRIR290 De; open circles represent age outliers (see text).
Table 6
Summary of average ages of each layer and the site average age.
| Layer | Number of accepted samples | Age average (ka) | Random uncertainty (ka) | Total uncertainty (ka) | Over-dispersion (ka) | Over-dispersion % |
|---|---|---|---|---|---|---|
| With outliers | ||||||
| L10.6 | 11 | 2.79 | 0.13 | 0.24 | 0.29 | 10.5 |
| L15.1 | 14 | 3.45 | 0.45 | 0.54 | 1.14 | 36.1 |
| L15.2 | 13 | 3.32 | 0.49 | 0.51 | 1.27 | 42.2 |
| Without outliers | ||||||
| L10.6 | 11 | 2.79 | 0.13 | 0.24 | 0.29 | 10.5 |
| L15.1 | 13 | 3.02 | 0.21 | 0.30 | 0.74 | 25.1 |
| L15.2 | 11 | 2.72 | 0.28 | 0.34 | 0.75 | 28.6 |
| Site Average Age | ||||||
| Including outliers | 38 | 3.20 | 0.20 | 0.30 | 1.0 | 33.8 |
| Excluding outliers | 35 | 2.85 | 0.12 | 0.22 | 0.66 | 24.1 |