

Tab. 1
The descriptive statistics for Nikkei 225 index returns for samples with and without opening jump effects
| sample with opening jump effects | sample without opening and mid-session jump effects | ||||
|---|---|---|---|---|---|
| N | 6745 | 6504 | |||
| Mean | -0,000025394 | -0,000014111 | |||
| Median | 0,000032644 | 0,000036116 | |||
| Standard Deviation | 0,0030907 | 0,0028429 | |||
| Minimum | -0,0319108 | -0,0319108 | |||
| Maximum | 0,0216127 | 0,0216127 | |||
| Kurtosis | 10,4364219 | 12,7560437 | |||
| Skewness | -0,6227228 | 0,7206586 | |||
| Normality tests | |||||
| Kolmogorov-Smirnov | Statistic | 0,093349 | 0,086497 | ||
| Jarque-Berra | Statistic | 30995,9195 | 44584,7971 | ||
Tab. 2
Number of theoretical premiums for different classes of MR and TTM for BRV model*
| option | moneyness | 0–15 days | 16–30 days | 31–60 days | 61–90 days | 91+ days | Total |
|---|---|---|---|---|---|---|---|
| CALL | deep OTM | 372 | 4327 | 27089 | 23799 | 10494 | 66081 |
| OTM | 6501 | 11635 | 22572 | 19567 | 8959 | 69234 | |
| ATM | 8199 | 9681 | 17385 | 12141 | 5368 | 52774 | |
| ITM | 3880 | 4510 | 5373 | 1484 | 761 | 16008 | |
| deep ITM | 1205 | 1935 | 3032 | 1044 | 1335 | 8551 | |
| total CALL | 20157 | 32088 | 75451 | 58035 | 26917 | 212648 | |
| PUT | deep OTM | 6964 | 20580 | 44831 | 31225 | 7768 | 111368 |
| OTM | 6109 | 8142 | 15466 | 12674 | 5631 | 48022 | |
| ATM | 8028 | 9669 | 17014 | 12001 | 6413 | 53125 | |
| ITM | 4278 | 4826 | 7427 | 1790 | 1096 | 19417 | |
| deep ITM | 2411 | 3002 | 3098 | 1161 | 1962 | 11634 | |
| total PUT | 27790 | 46219 | 87836 | 58851 | 22870 | 243566 | |
| total CALL and PUT | 47947 | 78307 | 163287 | 116886 | 49787 | 456214 |
[i] *456 thousand for BIV, Heston and GARCH(1,1) model and 445 thousand for BHV
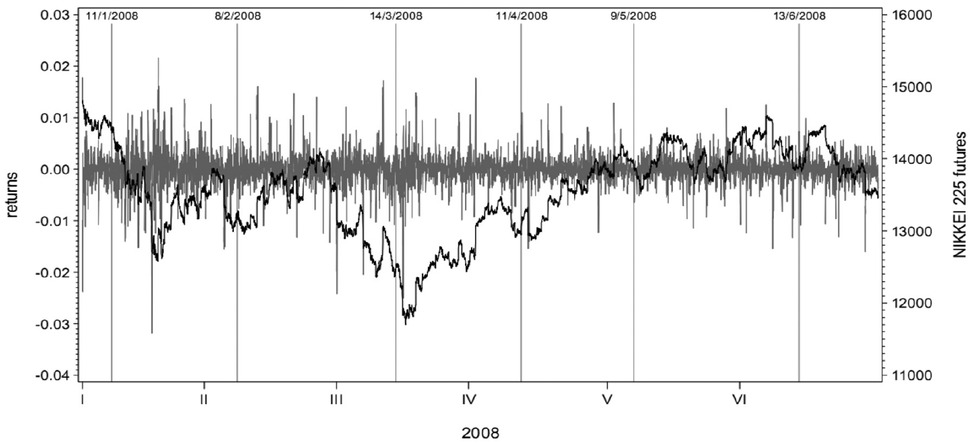
Fig. 1
Index returns with the opening jump effect
a The returns and index prices cover the data span between 2 January, 2008 to 30 June, 2008.
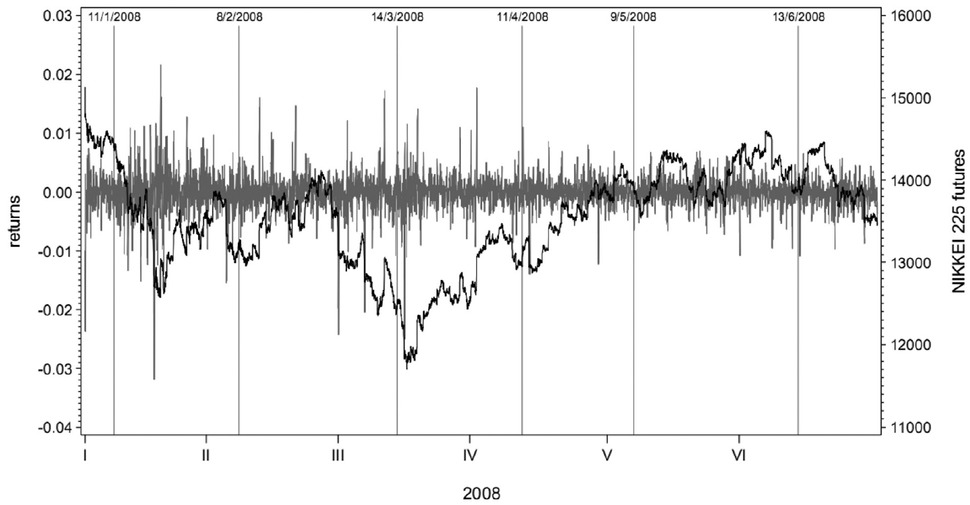
Fig. 2
Index returns without the opening and mid-session jump effect
a The 10-second returns between the closing price from each day and the opening price from the next day have been excluded. The same was done with the mid-session jump. The returns cover the data span from 2 January, 2008 to 30 June, 2008.
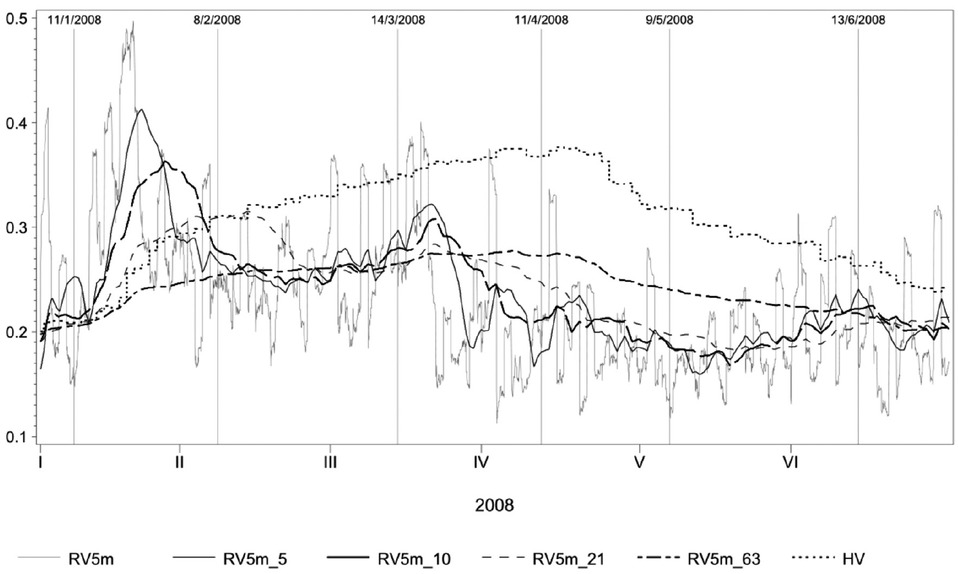
Fig. 3
Historical and realized volatility (5m, 5m_5, 5m_10, 5m_21, 5m_63)
a The volatility time series cover the data period between 2nd January, 2008 and 30th June, 2008. Vertical lines represent end of month and additionally the day of 11th January, 8th February, 14th March, 11th April, 9th May and 13th June, when the option series expired.
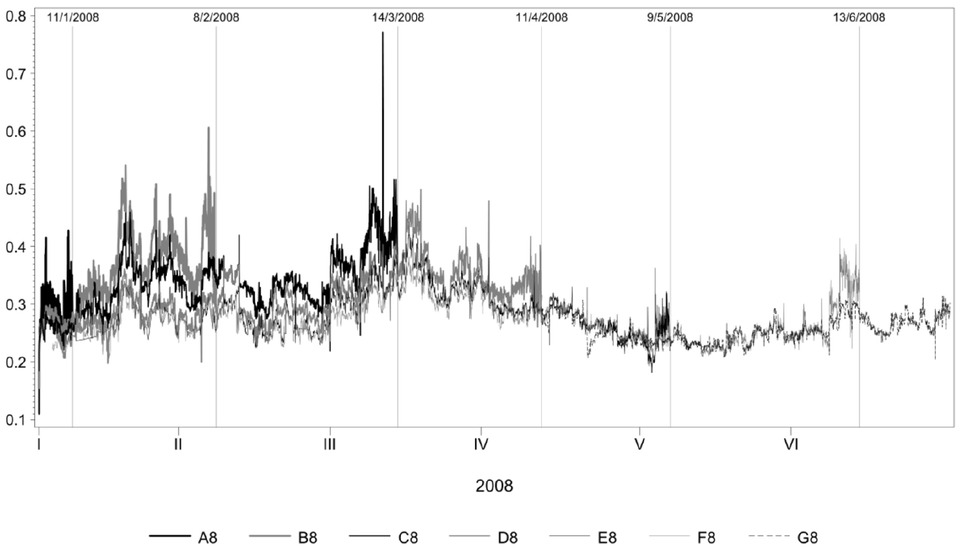
Fig. 4
Implied volatility for ATM call options
a The volatility time series cover the data period between 2nd January, 2008 and 30th June, 2008. IV are presented for 7 series of options. Vertical lines represent end of month and additionally the day of 11th January, 8th February, 14th March, 11th April, 9th May and 13th June, when the option series expired.
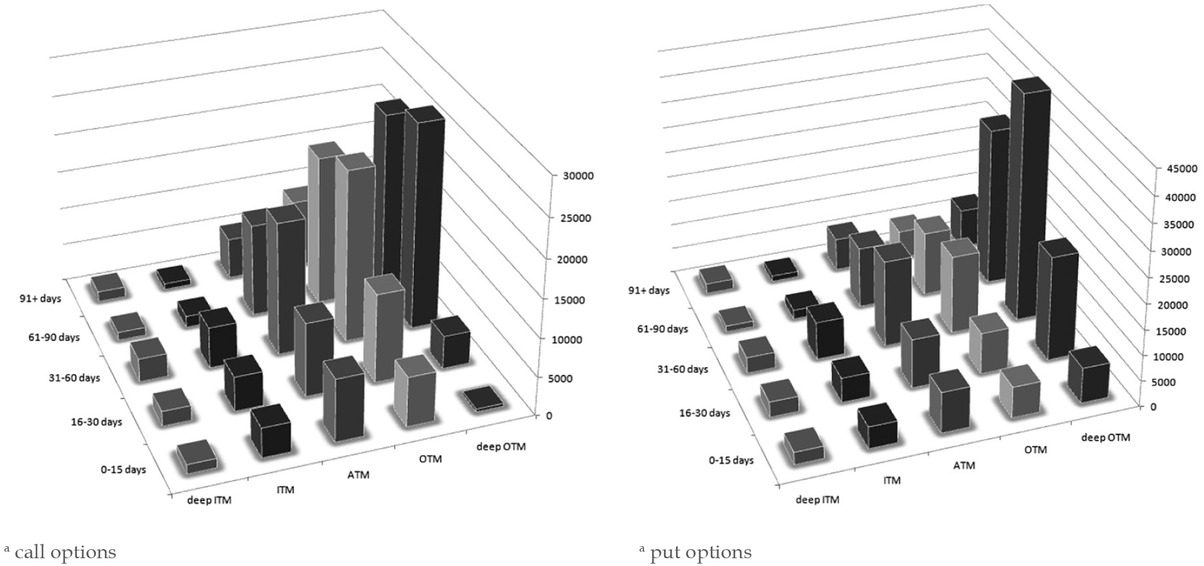
Fig. 5
The number of theoretical values for call and put options with respect to TTM i MR ratioa,b
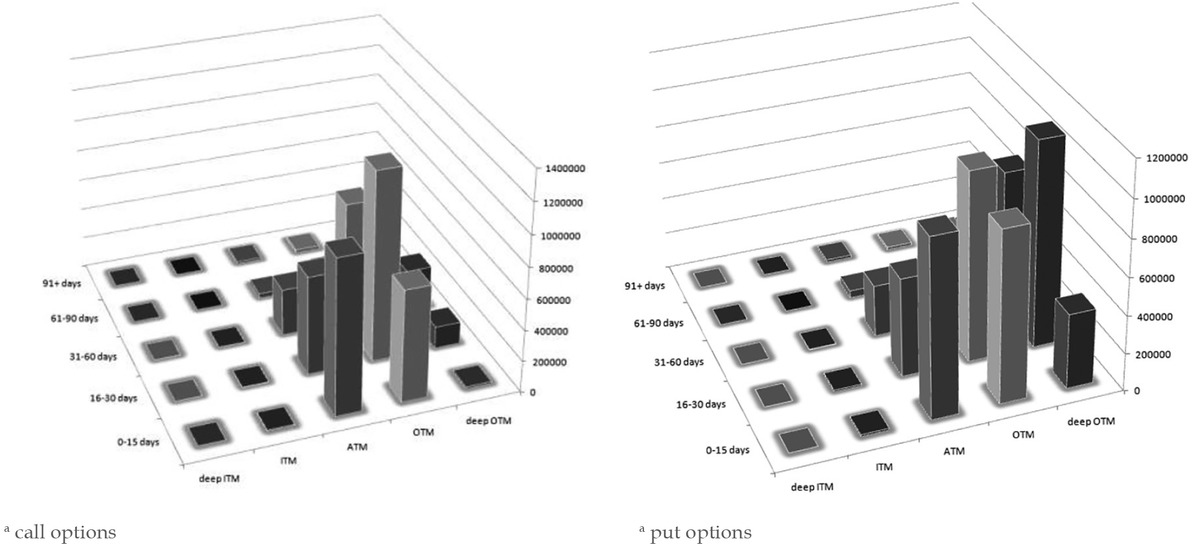
Fig. 6
The distribution of volume for call and put optionsa,b
bthe volume for both call and put options quoted in the period between 2nd January, 2008 and 30th June, 2008.
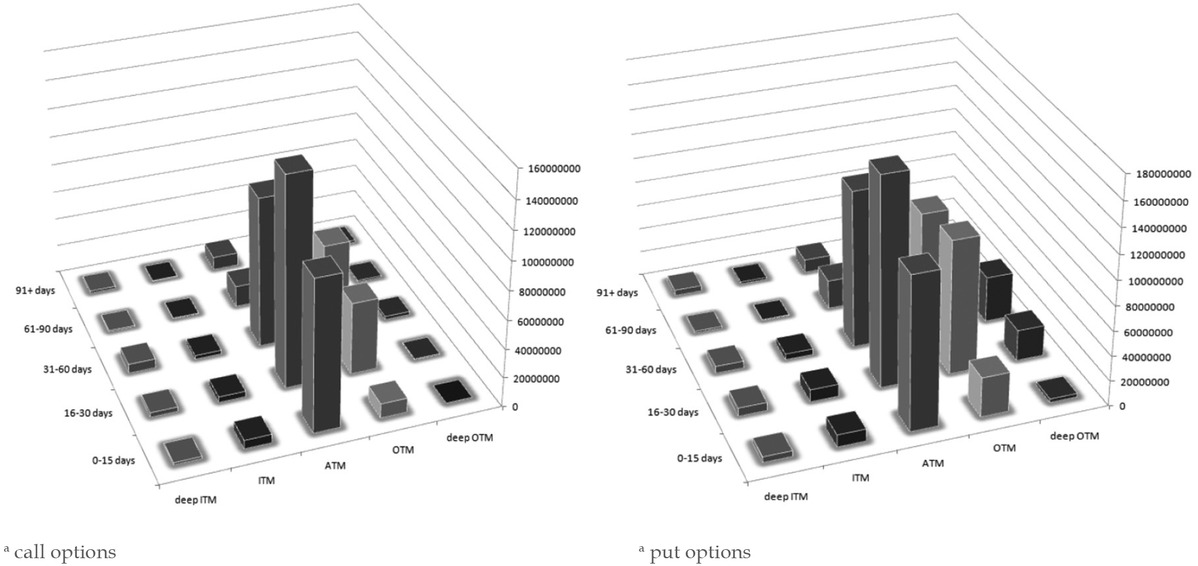
Fig. 7
The volume of turnover for call and put optionsa
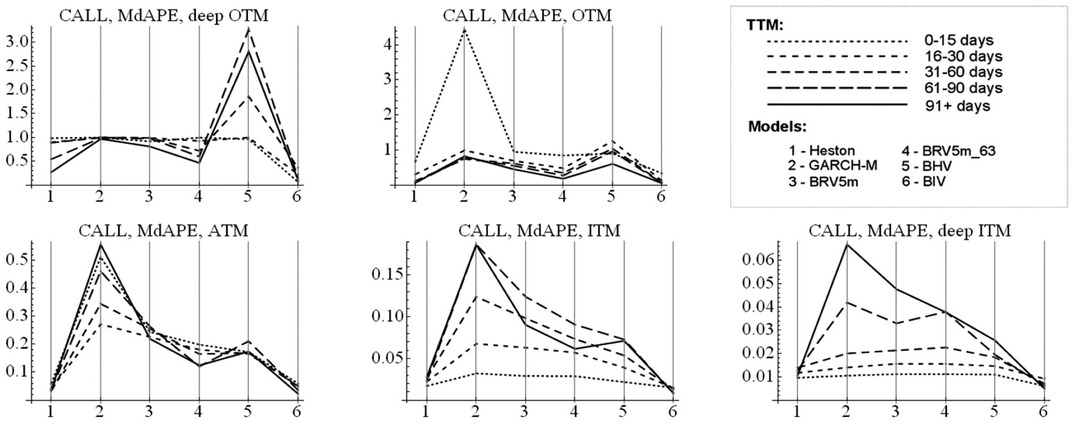
Fig. 8
MdAPE statistics for call options with respect to MR and TTM classes
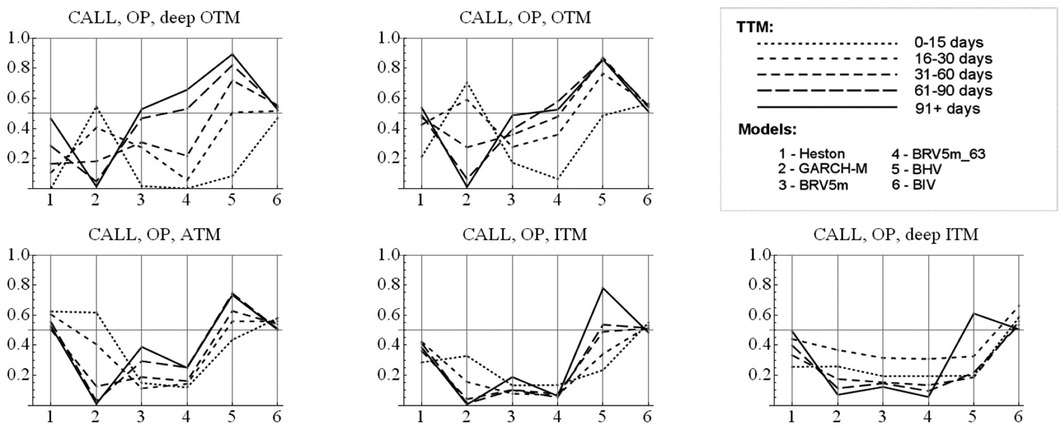
Fig. 9
OP statistics for call options with respect to MR and TTM classes
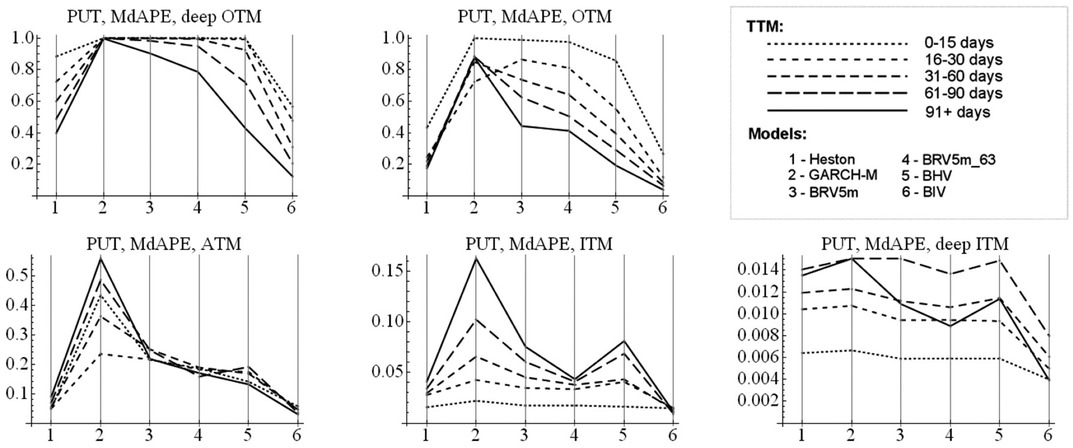
Fig. 10
MdAPE statistics for put options with respect to MR and TTM classes
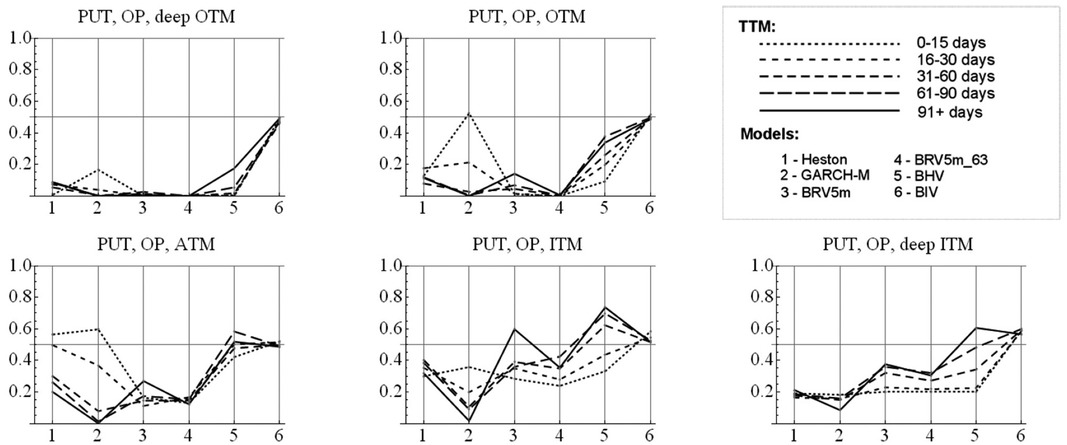
Fig. 11
OP statistics for put options with respect to MR and TTM classes
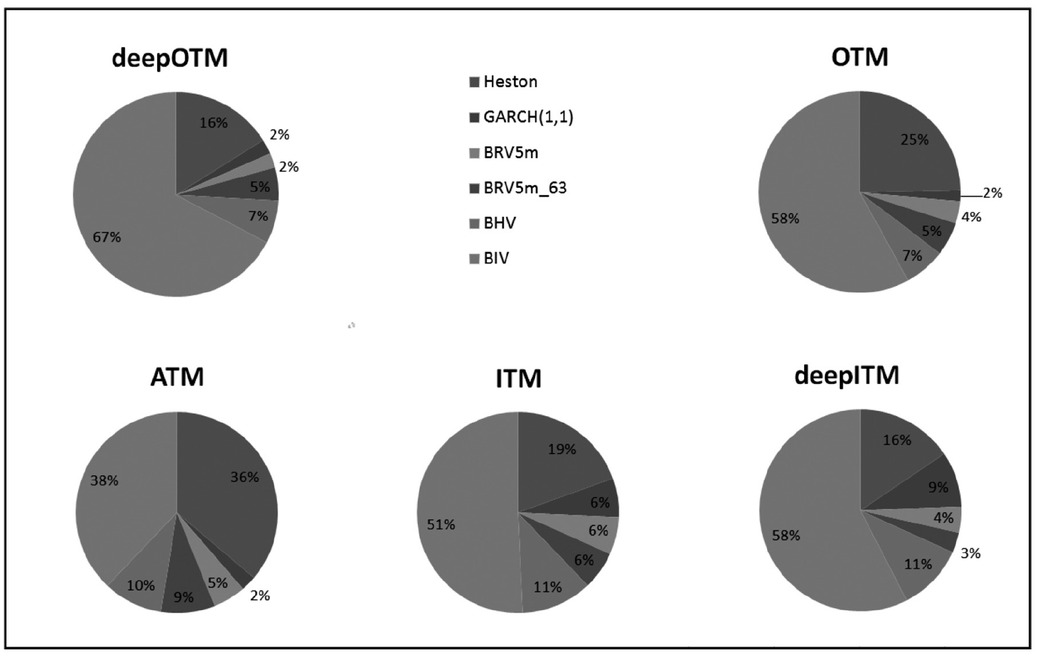
Fig. 12
The frequency of the best option pricing for Nikkei 225 index options with respect to MR based on MdAPE error statistic
a The charts present the data for call and put options together. On each panel, the order of the models is the same: we start with the Heston model at the top and going clockwise end up with the BIV model.
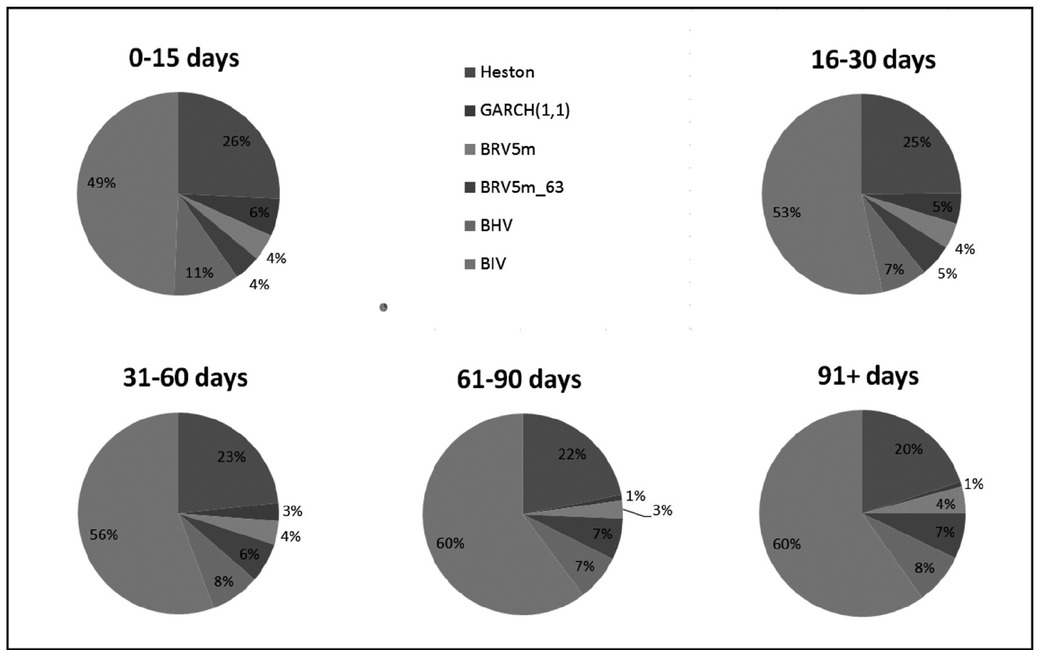
Fig. 13
The frequency of the best option pricing for Nikkei 225 index options with respect to TTM on MdAPE error statistic
a The charts present the data for call and put options together. On each panel, the order of the models is the same: we start with the Heston model at the top and going clockwise end up with the BIV model.
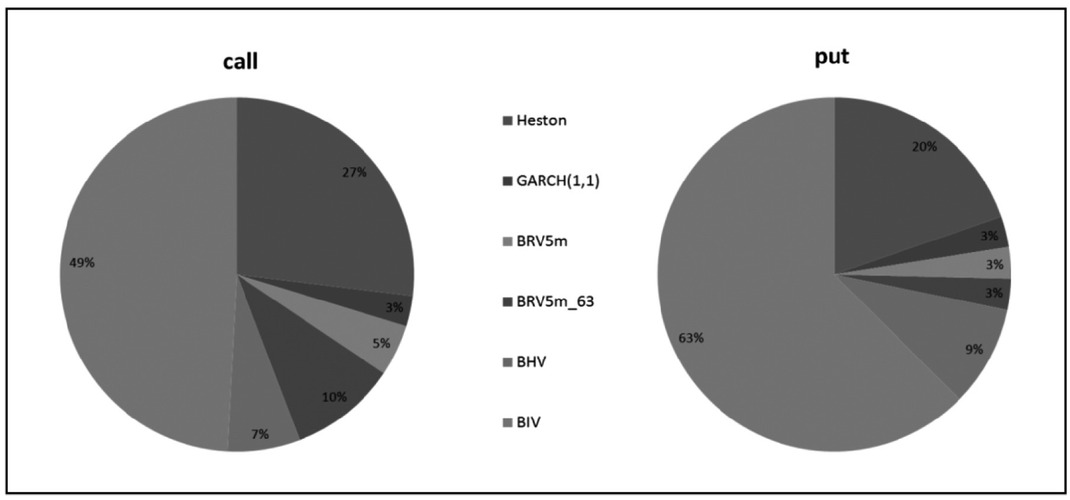
Fig. 14
The frequency of the best option pricing for Nikkei 225 index options with respect to the type of option on MdAPE error statistic
aOn each panel, the order of the models is the same: we start with the Heston model at the top and going clockwise end up with the BIV model.