

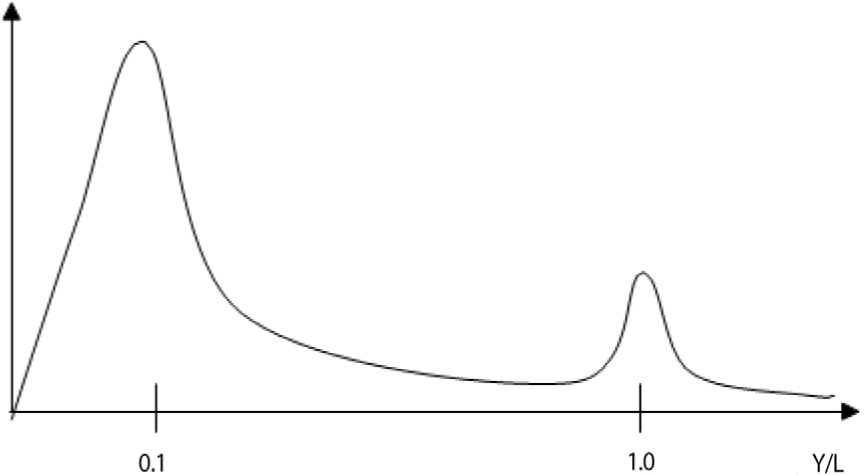
Fig. 1
Density of the distribution of global employment according to the level of value-added per working hour, schematic diagram.
Note: The area below the diagram is total global employment.
Source: Author’s own elaboration.
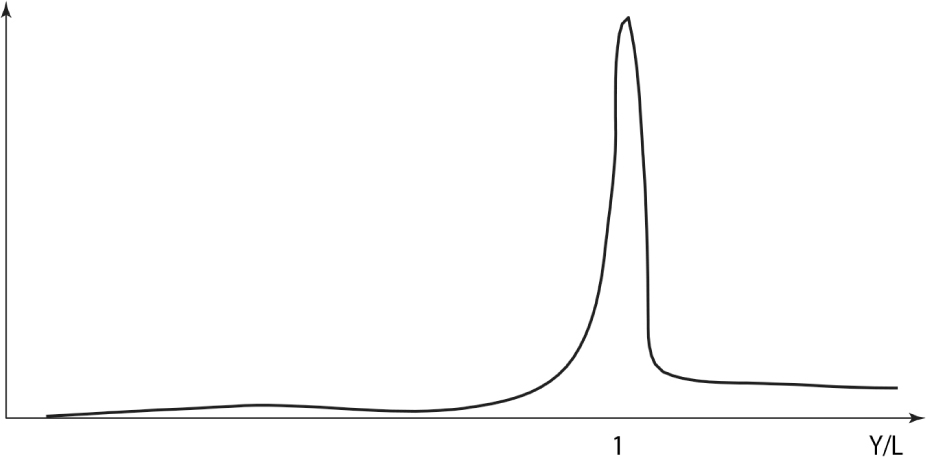
Fig. 2
Density of the distribution of internationally registered patents with respect to value-added per working hour in the countries of origin of the patents, schematic diagram.
Note: The area below the diagram represents global number of important patents per year.
Source: Author’s own elaboration.
Tab. 1
Key changes in the 21st century
| 2000 | 2100 | |
|---|---|---|
| Population (bn) | ||
| TFA | 1 | 2 |
| Non-TFA | 5 | 8 |
| GDP per capita, index (TFA in 2000 = 1) | ||
| TFA | 1 | 4 |
| Non-TFA | 0.2 | 2.4 |
| Total | 0.3 | 2.7 |
| Total GDP, index (TFA in 2000 = 1) | ||
| TFA | 1 | 8 |
| Non-TFA | 1 | 19 |
[i] Note: gross domestic product (GDP) according to purchasing
power parity (PPP).
TFA: technology frontier area.
Source: Author’s own elaboration.