
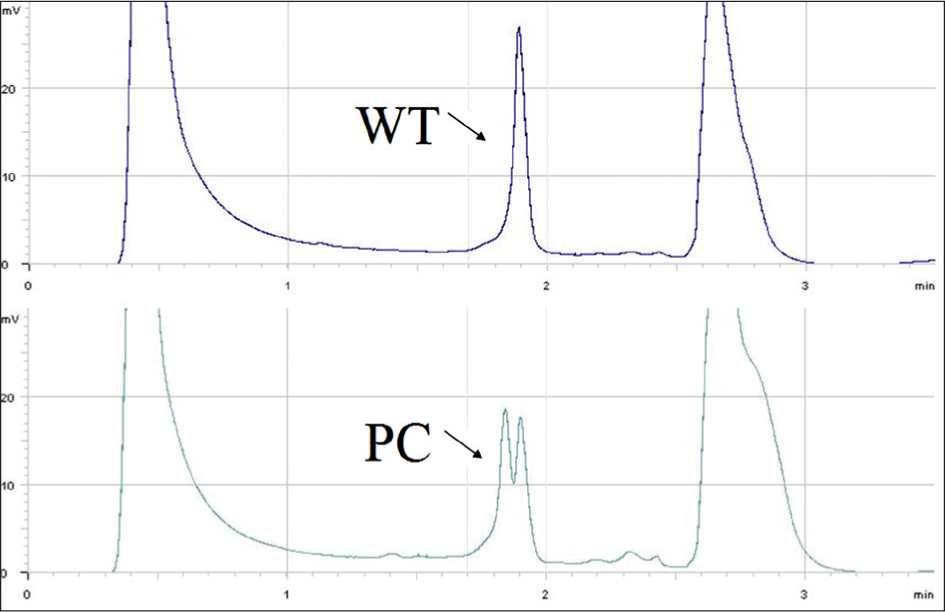
Figure 1
Chromatographic analysis of POLD1 in negative control DNA sample (WT) and positive control DNA sample (PC).
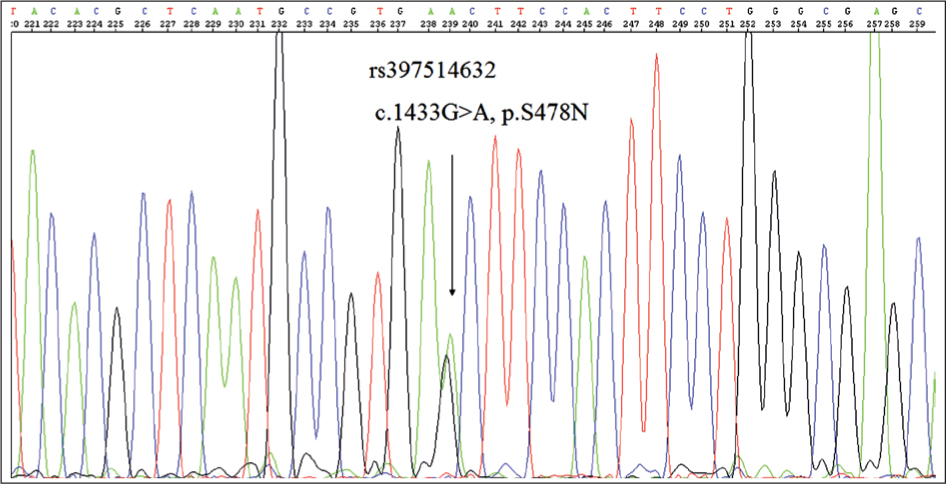
Figure 2
Capillary electrophoresis of POLD1 positive control DNA sample.
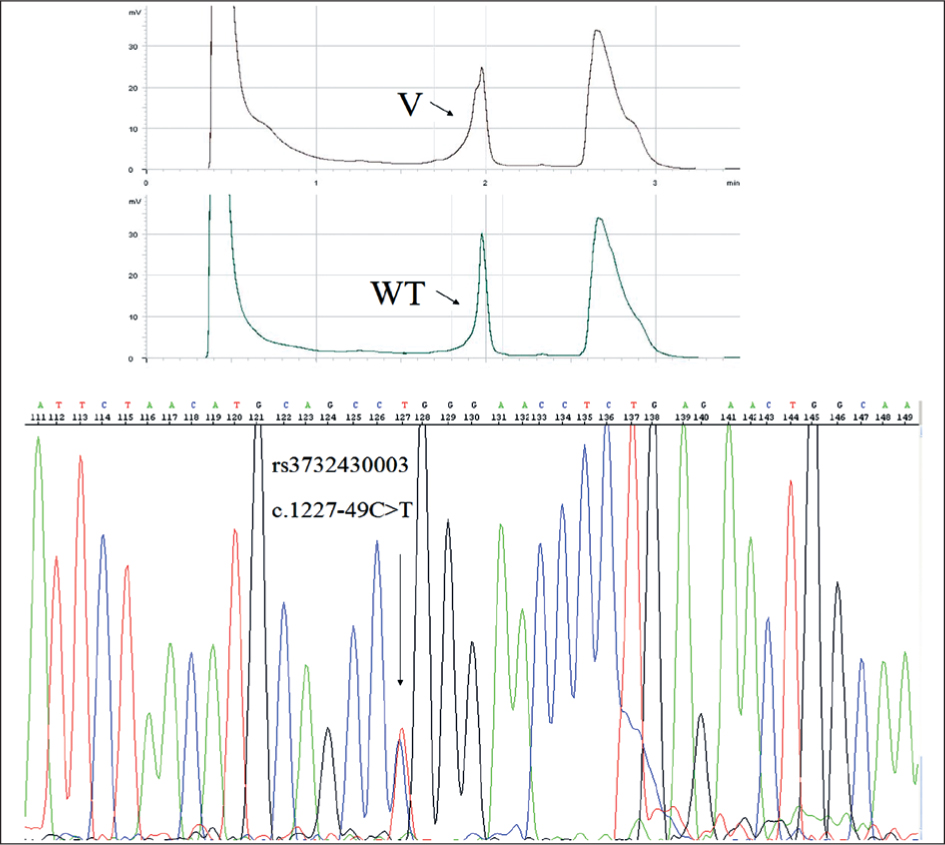
Figure 3
Chromatographic analysis of POLE, positive sample (V) compared to negative control sample (WT) and capillary electrophoresis of positive sample, revealing the POLE c.1227-49C>T variant.
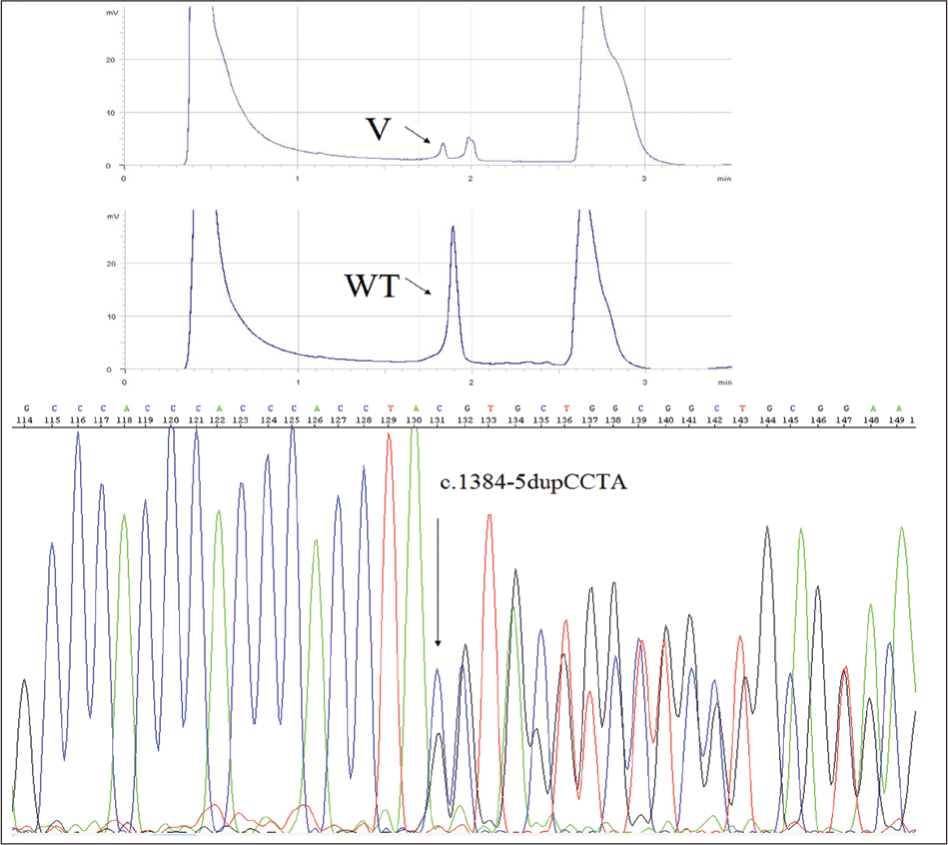
Figure 4
Chromatographic analysis of POLD1, positive sample (V) compared to negative control sample (WT) and capillary electrophoresis of positive sample, revealing the POLD1 c.1384-5dupCCTA variant.