
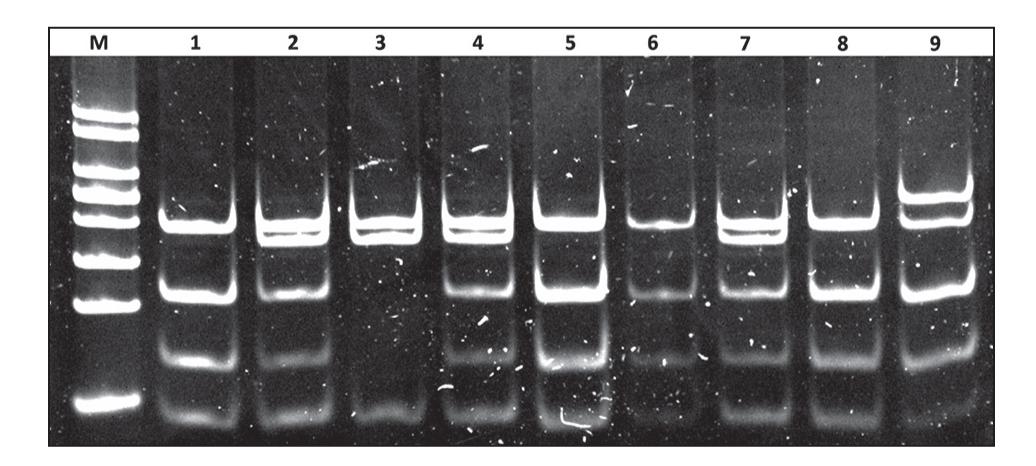
Figure 1
Baseline characteristics of the study subjects_ (Values are expressed as mean ± SD or n (%)_ Categorical variables were compared by the χ2 test_ Continuous variables were compared by unpaired t-test_)
| Study Subjects (n = 200) | |||
|---|---|---|---|
| Variables | Case Group (n = 100) | Control Group (n = 100) | p Value |
| Age (years) | 43.12 ± 11.64 | 42.95 ± 11.60 | 0.92 |
| Sex | |||
| males | 66 (66.0%) | 61 (61.0%) | 0.56 |
| females | 34 (34.0%) | 39 (39.0%) | |
| Smokers | |||
| yes | 35 (35.0%) | 25 (25.0%) | 0.16 |
| no | 65 (65.0%) | 75 (75.0%) | |
| Alcohol use | |||
| yes | 20 (20.0%) | 32 (32.0%) | 0.08 |
| no | 80 (80.0%) | 68 (68.0%) | |
| Body mass index (kg/m2) | 24.79 ± 3.08 | 22.07 ± 3.18 | <0.05 |
| Waist circumference (cm) | 87.14 ± 5.89 | 80.72 ± 6.06 | <0.05 |
| Systolic blood pressure (mmHg) | 133.58 ± 16.44 | 117.86 ± 8.53 | <0.05 |
| Diastolic blood pressure (mmHg) | 84.32 ± 8.84 | 77.20 ± 5.92 | <0.05 |
| HDL-C (mg/dL) | 30.87 ± 5.19 | 54.61 ± 12.17 | <0.05 |
| Total cholesterol (mg/dL) | 175.54 ± 35.98 | 160.79 ± 25.70 | <0.05 |
| Triglycerides (mg/dL) | 145.95 ± 29.39 | 95.35 ± 23.55 | <0.05 |
| LDL-C (mg/dL) | 116.41 ± 28.19 | 87.37 ± 22.96 | <0.05 |
| VLDL-C (mg/dL) | 29.12 ± 7.62 | 19.03 ± 5.90 | <0.05 |
| Non-HDL-C (mg/dL) | 144.67 ± 32.47 | 106.18 ± 24.83 | <0.05 |
| Castelli’s risk index I | 5.71 ± 0.87 | 3.04 ± 0.65 | <0.05 |
| Castelli’s risk index II | 3.78 ± 0.79 | 1.68 ± 0.56 | <0.05 |
| Atherogenic index of plasma | 0.66 ± 0.13 | 0.26 ± 0.14 | <0.05 |
| Atherogenic coefficient | 4.71 ± 0.87 | 2.04 ± 0.65 | <0.05 |
Influence of C+83T polymorphism on cardiovascular risk factors_ [Values are expressed as adjusted mean±SE_ Adjusted means compared between genotypes by analysis of covariance (ANCOVA)_ Statistically significant (p <0_05) differences among genotypes are highlighted in bold_ Furthermore, means in a genotype column bearing an ‘a’ or ‘b’ as a superscript are significantly different_]
| Phenotypic Variables | Case Group (n = 100) | Control Group (n = 100) | Study Subjects (n = 200) | |||
|---|---|---|---|---|---|---|
| Lipid Profile | ||||||
| CC | CT | CC | CT | CC | CT | |
| HDL-C Means adjusted taking age, gender, smoking, alcohol use, TC, TG, WC and BMI as covariates. | 30.8 ± 0.4 | 31.1 ± 1.1 | 54.7 ± 1.2 | 53.7 ± 3.1 | 43.1 ± 0.9 | 39.9 ± 2.5 |
| TC Means adjusted taking age, gender, smoking, alcohol use, WC and BMI as covariates. | 176.5 ± 3.9 | 167.8 ± 11.2 | 162.6 ± 2.7 | 148.4 ± 7.1 | 169.7 ± 2.4 | 157.2 ± 6.5 |
| TG Means adjusted taking age, gender, smoking, alcohol use, WC and BMI as covariates. | 148.8a ± 123.2 | 123.2b ± 11.4 | 96.6 ± 3.0 | 87.1 ± 7.9 | 122.7a± 2.9 | 105.3b ± 7.9 |
| LDL-C Means adjusted taking age, gender, smoking, alcohol use, WC and BMI as covariates. | 116.9 ± 3.2 | 112.4 ± 9.1 | 88.7 ± 2.5 | 78.6 ± 6.4 | 102.9 ± 2.2 | 94.8 ± 5.9 |
| VLDL-C Means adjusted taking age, gender, smoking, alcohol use, WC and BMI as covariates. | 29.7a ± 0.8 | 24.7b ± 2.3 | 19.3 ± 0.6 | 17.3 ± 1.6 | 24.5a ± 0.6 | 21.1b ± 1.6 |
| Atherogenic Indices | ||||||
| Non-HDL-C Means adjusted taking age, gender, smoking, alcohol use, WC and BMI as covariates. | 145.6 ± 3.5 | 137.5 ± 10.1 | 107.7 ± 2.7 | 95.9 ± 6.9 | 126.7 ± 2.5 | 116.2 ± 6.8 |
| CRI-I Means adjusted taking age, gender, smoking, alcohol use, WC and BMI as covariates. | 5.7 ± 0.1 | 5.6 ± 0.3 | 3.1 ± 0.1 | 2.9 ± 0.2 | 4.4 ± 0.1 | 4.2 ± 0.3 |
| CRI-II Means adjusted taking age, gender, smoking, alcohol use, WC and BMI as covariates. | 3.8 ± 0.1 | 3.8 ± 0.2 | 1.7 ± 0.1 | 1.5 ± 0.2 | 2.7 ± 0.1 | 2.7 ± 0.2 |
| AIP Means adjusted taking age, gender, smoking, alcohol use, WC and BMI as covariates. | 0.67a ± 0.01 | 0.59b ± 0.04 | 0.27 ± 0.01 | 0.23 ± 0.04 | 0.47a ± 0.01 | 0.41b ± 0.03 |
| AC Means adjusted taking age, gender, smoking, alcohol use, WC and BMI as covariates. | 4.7 ± 0.1 | 4.6 ± 0.3 | 2.1 ± 0.1 | 1.8 ± 0.2 | 3.4 ± 0.1 | 3.2 ± 0.2 |
| Obesity Indices | ||||||
| BMI Means adjusted taking age, gender, smoking, alcohol use, TC, HDL-C and TG as covariates. | 24.9 ± 0.3 | 23.5 ± 0.9 | 22.1 ± 0.3 | 22.1 ± 0.9 | 23.5 ± 0.3 | 22.8 ± 0.7 |
| WC Means adjusted taking age, gender, smoking, alcohol use, TC, HDL-C and TG as covariates. | 87.3 ± 0.6 | 85.5 ± 1.7 | 80.6 ± 0.6 | 81.4 ± 1.7 | 84.0 ± 0.5 | 83.3 ± 1.4 |
| Blood Pressure | ||||||
| Systolic BP Means adjusted taking age, gender, smoking, alcohol use, TC, HDL-C, TG, BMI and WC as covariates. | 133.6 ± 1.7 | 133.7 ± 4.9 | 117.7 ± 0.8 | 119.1 ± 2.2 | 125.6 ± 1.0 | 126.3 ± 28 |
| Diastolic BP Means adjusted taking age, gender, smoking, alcohol use, TC, HDL-C, TG, BMI and WC as covariates. | 83.8 ± 0.9 | 88.3 ± 2.7 | 77.0 ± 0.6 | 77.9 ± 1.5 | 80.4 ± 0.6 | 82.9 ± 1.6 |
Influence of G-75A polymorphism on cardiovascular risk factors_ [Values are expressed as adjusted mean±standard error (SE)_ Adjusted means compared between genotypes by analysis of covariance (ANCOVA)_ Statistically significant (p <0_05) differences among genotypes are highlighted in bold_ Furthermore, means in a genotype column bearing an ‘a’ or ‘b’ as a superscript are significantly different_]
| Phenotypic Variables | Case Group (n = 100) | Control Group (n = 100) | Study Subjects (n = 200) | ||||||
|---|---|---|---|---|---|---|---|---|---|
| Lipid Profile | |||||||||
| GG | GA | AA | GG | GA | AA | GG | GA | AA | |
| HDL-C Means adjusted taking age, gender, smoking, alcohol use, TC, TG, WC and BMI as covariates. | 30.7±0.5 | 31.3±0.6 | 29.5±2.3 | 55.4±1.5 | 54.8±2.0 | 47.0±4.6 | 42.7±1.1 | 42.9±1.5 | 42.2±3.9 |
| TC Means adjusted taking age, gender, smoking, alcohol use, WC and BMI as covariates. | 179.0±4.7 | 172.9±6.3 | 134.9±21.9 | 156.5±3.3 | 166.1±4.5 | 172.9±10.1 | 168.2±2.9 | 169.2±3.9 | 161.3±10.5 |
| TG Means adjusted taking age, gender, smoking, alcohol use, WC and BMI as covariates. | 145.5±4.9 | 148.1±6.7 | 129.6±23.2 | 93.8±3.7 | 94.9±4.9 | 110.3±11.2 | 120.4±3.5 | 121.1±4.8 | 121.5±12.7 |
| LDL-C Means adjusted taking age, gender, smoking, alcohol use, WC and BMI as covariates. | 120.7±3.8 | 113.3±5.1 | 87.2±17.8 | 82.7a±2.9 | 92.2b±3.9 | 105.1b±8.9 | 102.4±2.7 | 101.6±3.6 | 97.9±9.6 |
| VLDL-C Means adjusted taking age, gender, smoking, alcohol use, WC and BMI as covariates. | 29.0±0.9 | 29.6±1.3 | 25.8±4.7 | 18.7±0.7 | 18.9±0.9 | 21.9±2.2 | 24.2±2.5 | 24.2±0.9 | 24.0±0.7 |
| Atherogenic Indices | |||||||||
| Non-HDL-C Means adjusted taking age, gender, smoking, alcohol use, WC and BMI as covariates. | 147.9±4.2 | 141.9±5.7 | 109.5±19.8 | 101.1a±3.2 | 111.3a, b±4.3 | 125.9b±9.7 | 125.5±3.1 | 126.1±4.1 | 120.2±10.9 |
| CRI-I Means adjusted taking age, gender, smoking, alcohol use, WC and BMI as covariates. | 5.8±0.1 | 5.6±0.2 | 5.4±0.5 | 2.9a±0.1 | 3.1a±0.1 | 3.7b±0.2 | 4.4±0.1 | 4.3±0.2 | 4.1±0.5 |
| CRI-II Means adjusted taking age, gender, smoking, alcohol use, WC and BMI as covariates. | 3.9±0.1 | 3.6±0.1 | 3.4±0.5 | 1.6a±0.1 | 1.8a, b±0.1 | 2.2b±0.2 | 2.8±0.1 | 2.7±0.1 | 2.5±0.4 |
| AIP Means adjusted taking age, gender, smoking, alcohol use, WC and BMI as covariates. | 0.66±0.02 | 0.67±0.02 | 0.69±0.08 | 0.24±0.02 | 0.26±0.02 | 0.36±0.05 | 0.46±0.02 | 0.46±0.03 | 0.48±0.07 |
| AC Means adjusted taking age, gender, smoking, alcohol use, WC and BMI as covariates. | 4.8±0.1 | 4.6±0.2 | 4.4±0.5 | 1.9a±0.1 | 2.1a±0.1 | 2.7b±0.2 | 3.4±0.1 | 3.3±0.2 | 3.1±0.5 |
| Obesity Indices | |||||||||
| BMI Means adjusted taking age, gender, smoking, alcohol use, TC, HDL-C and TG as covariates. | 24.5±0.4 | 25.1±0.5 | 26.3±1.9 | 21.9±0.4 | 22.3±0.6 | 21.9±1.3 | 23.3±0.3 | 23.7±0.4 | 23.1±1.1 |
| WC Means adjusted taking age, gender, smoking, alcohol use, TC, HDL-C and TG as covariates. | 86.7±0.7 | 88.3±0.9 | 83.7±3.4 | 80.6±0.8 | 80.8±1.1 | 81.2±2.4 | 83.7±0.6 | 84.6±0.8 | 81.7±2.2 |
| Blood Pressure | |||||||||
| Systolic BP Means adjusted taking age, gender, smoking, alcohol use, TC, HDL-C, TG, BMI and WC as covariates. | 135.4±2.1 | 130.7±2.8 | 129.1±9.7 | 118.1±1.0 | 117.2±1.4 | 118.7±3.1 | 127.0±1.2 | 124.0±1.6 | 121.5±4.5 |
| Diastolic BP Means adjusted taking age, gender, smoking, alcohol use, TC, HDL-C, TG, BMI and WC as covariates. | 85.1±1.1 | 83.7±1.6 | 77.2±5.4 | 77.1±0.7 | 77.1±0.9 | 78.3±2.2 | 120.4±3.5 | 80.3±0.9 | 78.4±2.4 |
Association of decreased high density lipoprotein cholesterol with G-75A and C+83T polymorphisms under different genetic models_ [Values are expressed as n (%) or OR (95% CI)_]
| SNPs | Model | Genotype/Allele | Case | Control | Crude OR (95% CI) | Adjusted OR Odds ratio was adjusted for gender, age, smoking, alcohol use, WC, BMI, TC and TG. In every model, for each OR value, the corresponding 95% CI extended across 1. None of the OR values were statistically significant (p >0.05). |
|---|---|---|---|---|---|---|
| G-75A | Additive: GG vs. GA vs. AA | GG | 62 (62.0%) | 60 (60.0%) | reference | reference |
| Dominant: GG vs. (GA + AA) | GG | 62 (62.0%) | 60 (60.0%) | reference | reference | |
| Recessive: (GG + GA) vs. AA | GG + GA | 97 (97.0%) | 93 (93.0%) | reference | reference | |
| Allelic: G vs. A | G | 159 (79.5%) | 153 (76.5%) | reference | reference | |
| C+83 T | CC vs. CT | CC | 89 (89.0%) | 87 (87.0%) | reference | reference |
| Allelic: C vs.T | C | 189 (94.5%) | 187 (93.5%) | reference | reference |
The distribution of G-75A and C+83T polymorphisms in the case and control groups_ [Values are expressed as n (%)_]
| Genotype Frequency | Allelic Frequency | |||||
|---|---|---|---|---|---|---|
| SNPs | Group | GG | GA | AA | G | A |
| G-75A | Case | 62 (62.0%) | 35 (35.0%) | 3 (3.0%) | 159 (79.5%) | 41 (20.5%) |
| Control | 60 (60.0%) | 33 (33.0%) | 7 (7.0%) | 153 (76.5%) | 47 (23.5%) | |
| χ2 = 1.692 (df = 2; p = 0.43 | χ2 = 0.364 (df = 1; p = 0.55) | |||||
| CC | CT | TT | C | T | ||
| C+83T | Case | 89 (89.0%) | 11 (11.0%) | – | 189 (94.5%) | 11 (5.5%) |
| Control | 87 (87.0%) | 13 (13.0%) | – | 187 (93.5%) | 13 (6.5%) | |
| χ2 = 0.047 (df = 1; p = 0.83) | χ2 = 0.044 (df = 1; p = 0.83) | |||||
| Diplotype Frequency | ||||||
| GG/CC | GA/CC | AA/CC | GG/CT | GA/CT | ||
| Combined | Case | 54 (54.0%) | 32 (32.0%) | 3 (3.0%) | 8 (8.0%) | 3 (3.0%) |
| Control | 50 (50.0%) | 30 (30.0%) | 7 (7.0%) | 10 (10.0%) | 3 (3.0%) | |
| χ2 = 2.041 (df = 4; p = 0.73) | ||||||