
Table 1
Main characteristics (number, gender distribution, mean age, BMI, Hb A1c, diabetes duration, presence of MetS, arterial hypertension, chronic complications of diabetes of the participants in the subgroups according to diabetes duration: newly-diagnosed T2DM, T2DM duration of <5 years, and T2DM duration >5 years).
| Parameters | Newly-Diagnosed T2DM | T2DM Duration <5 Years | T2DM Duration >5 Years |
|---|---|---|---|
| Number | 9 | 9 | 9 |
| Sex | 6 males; 3 females | 5 males; 4 females | 5 males; 4 females |
| Age (years) (mean + SD) | 62.0 + 7.5 | 51.3 + 14.0 | 55.7 + 7.7 |
| BMI (kg/m2) | 34.8 + 8.4 | 38.1 + 13.7 | 34.0 + 2.7 |
| Hb A1c (%) | 7.9 + 2.3 | 8.8 + 1.8 | 8.7 + 2.1 |
| Duration (years) | 0.0 | 2.2 + 0.8 | 6.8 + 1.9 |
| MetS (%) | 7/9 (77.8) | 6/9 (66.7) | 9/9 (100.0) |
| Arterial hypertension (%) | 6/9 (66.7) | 8/9 (88.9) | 8/9 (88.9) |
| Chronic complications of diabetes (%) | 2/9 (22.2) | 8/9 (88.9) | 8/9 (88.9) |
T2DM: type 2 diabetes mellitus; mean + SD: mean + standard deviation; BMI: body mass index; MetS: metabolic syndrome.
Table 2
List of 22 analyzed genes and the processes they mediate.
| Genes | Processes Mediated by the Genes |
|---|---|
| Bnip3, Cyp1a1, Gpx3, Prdx2, Ptgs2 (Cox2) | Oxidative stress |
| Atm, Brca1, Ccnd1, Gadd45a, Gadd45g, Mlh1, Msh2, Tp53 | DNA damage |
| Insig1, Ube2g2 | Unfolded protein response |
| Cstb, Rara | Hypoxia |
| Dnajc15 | Heat shock protein |
| Atm, Cdkn1a (P21cip1/Waf1), Gadd45a (Plab), Msh2, Tp53 | Growth arrest and senescence |
| Prdx2, Ptgs2 (Cox2) | Inflammation |
| Bnip3, Cdkn1a (P21cip1/Waf1), Prdx2 | Anti-apoptosis |
| Brca1, Ccnd1, Cdkn1a (P21cip1/Waf1), Cyp1a1, Prdx2 | Proliferation and carcinogenesis |
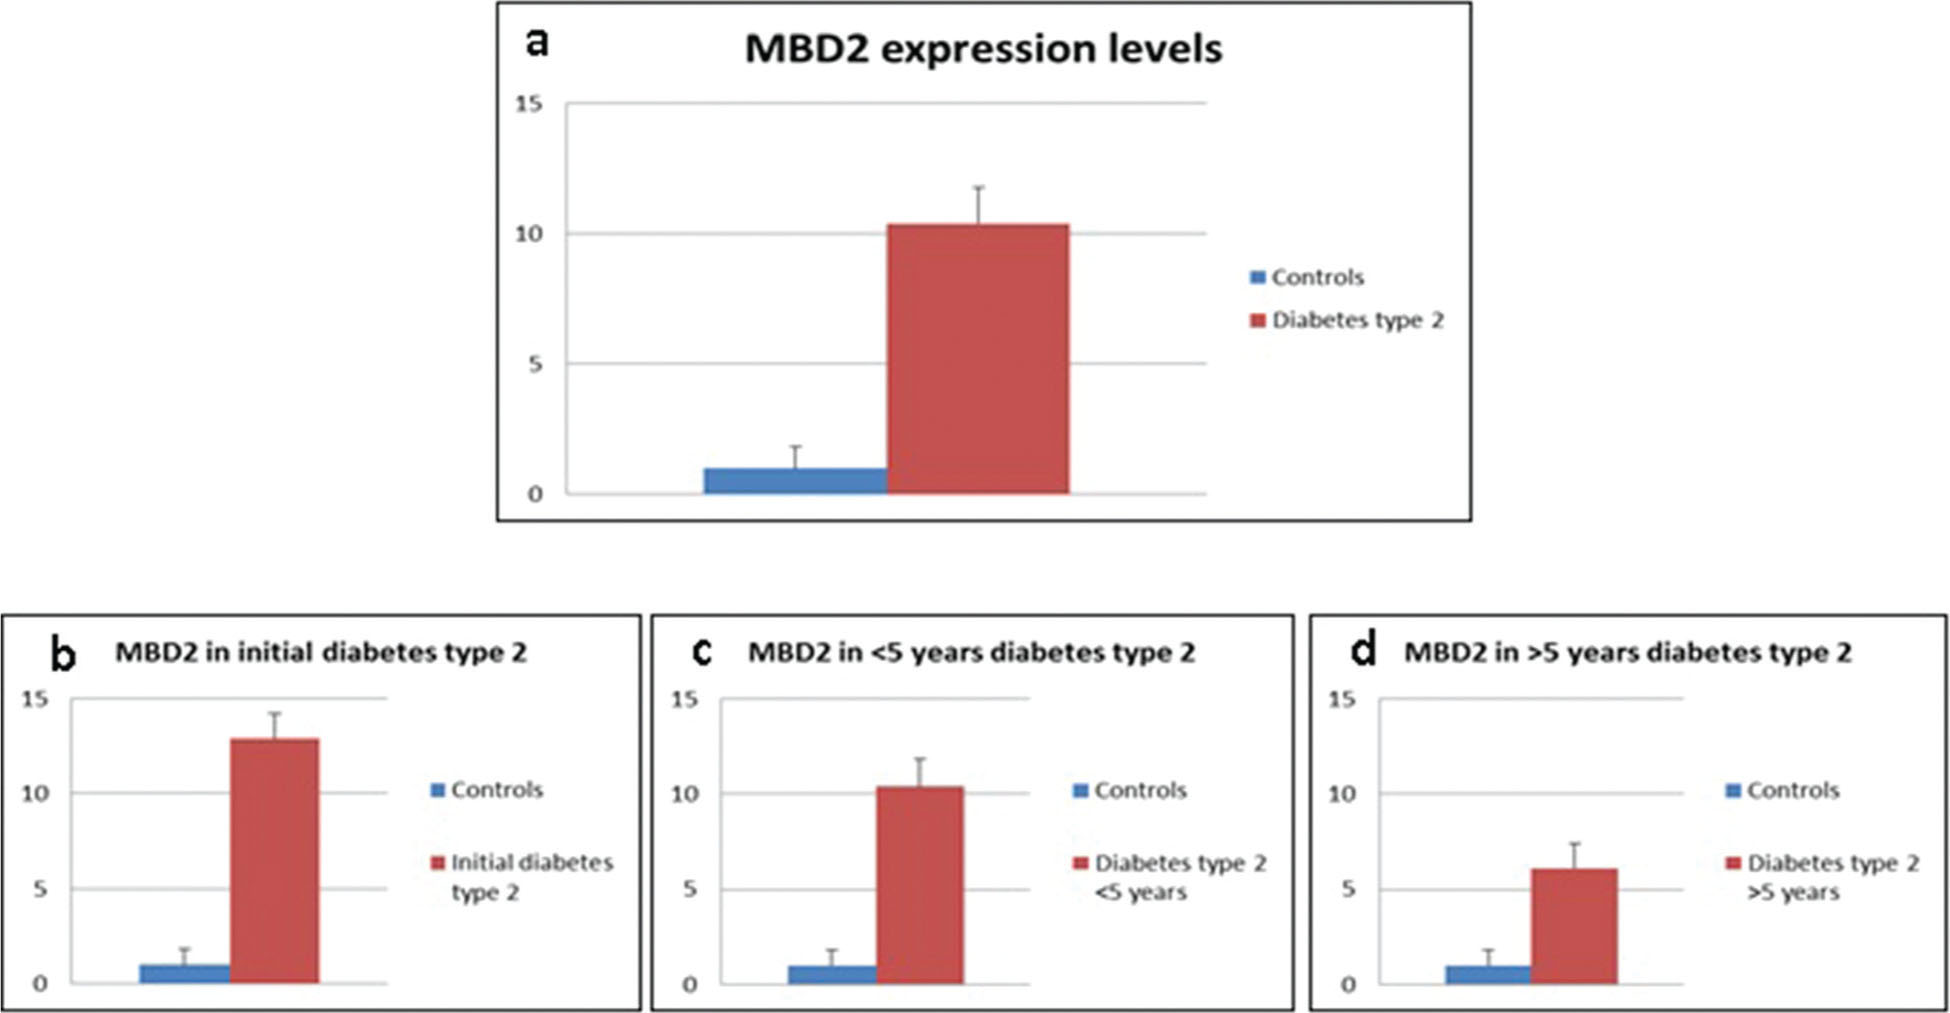
MBD2 expression levels in patients with T2DM compared to control subjects: a) in all patients; b) in patients with newly-diagnosed T2DM; c) in patients with T2DM duration of less than 5 years; d) in patients with T2DM duration of more than 5 years.
Table 3
Methylated (M) fraction of the analyzed genes in four DNA pools.
| Genes | Controls M Fraction (%) | Newly-Diagnosed T2DM M Fraction (%) | T2DM Duration <5 Years M Fraction (%) | T2DM Duration >5 Years M Fraction (%) |
|---|---|---|---|---|
| BRCA1 | 0.0 | 5.9 | 0.5 | 47.8 |
| CCND1 | 0.0 | 13.6 | 14.7 | 34.1 |
| Gadd45A | 0.0 | 0.0 | 0.7 | 0.0 |
| Gadd45G | 0.0 | 4.9 | 4.8 | 0.0 |
| GDF15 | 98.5 | 98.4 | 97.7 | 95.9 |
| Gpx3 | 1.4 | 23.6 | 13.1 | 9.5 |
| Insig1 | 2.4 | 10.4 | 4.9 | 15.7 |
| Prdx2 | 7.3 | 22.3 | 22.4 | 32.0 |
| Rara | 0.0 | 13.2 | 6.6 | 7.6 |
| SCARA3 | 3.5 | 8.1 | 20.2 | 23.3 |
| Tp53 | 0.0 | 5.9 | 6.4 | 10.2 |
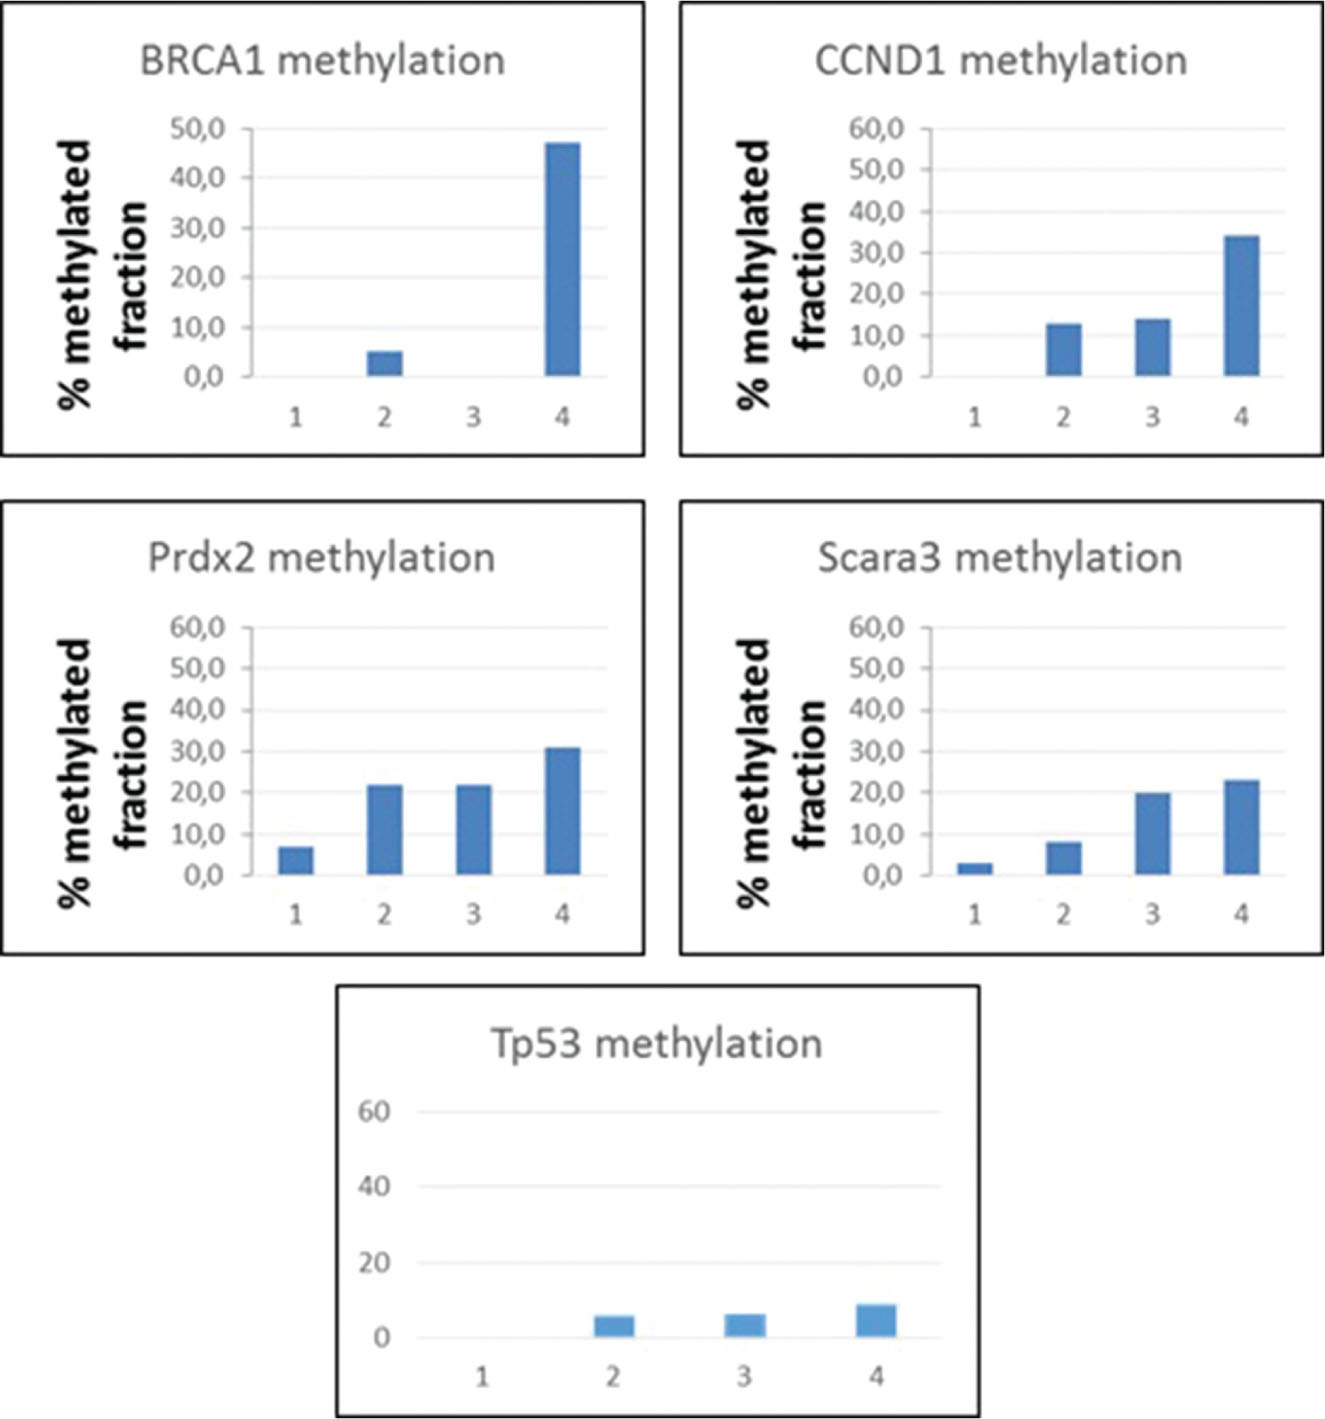
Increase in the methylated fraction of BRCA1, CCND1, Prdx2, SCARA3 and Tp53 during the course of T2DM.