
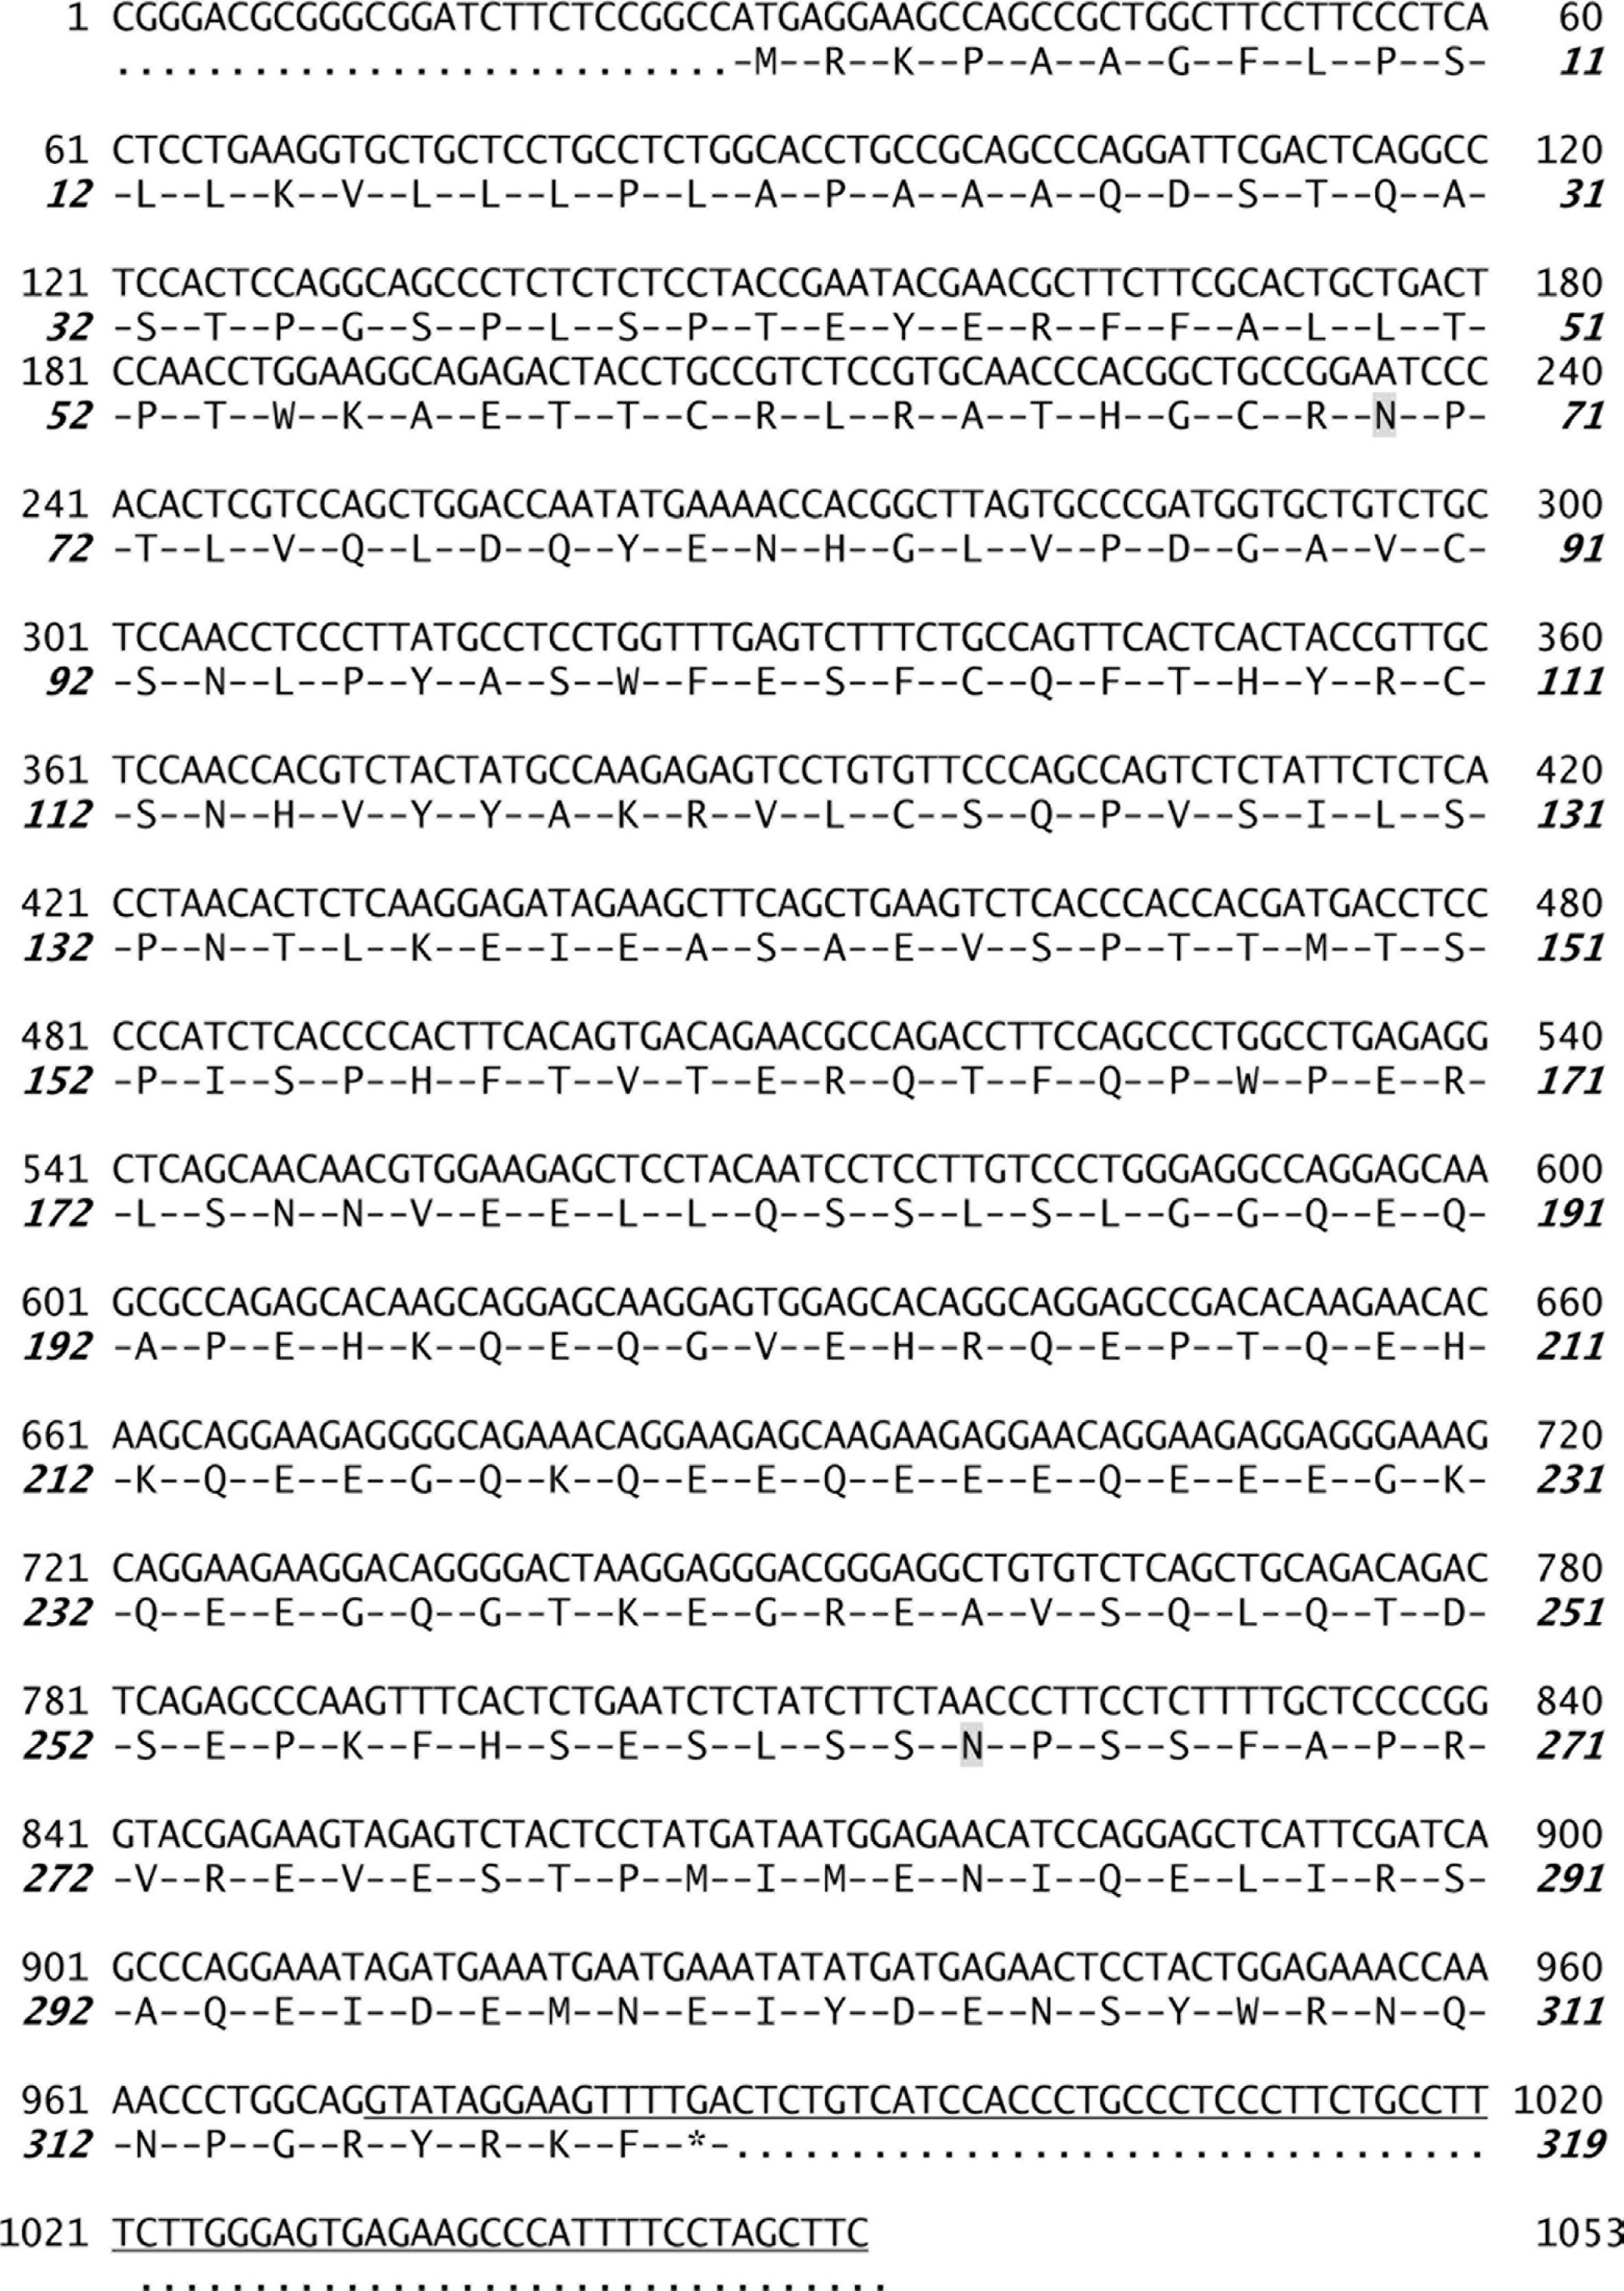
Figure 1
Nucleotide and predicted amino acid sequences for the variant of the gene for acrosomal binding protein, ACRBP-V5a. The nucleotide sequence is shown above the predicted amino acid sequence. Numbers on both sides correspond to nucleotides (roman) and amino acid residues (bold italic). The exon 5a is underlined. Two potential N-glycosylation sites are shaded (based on the NetNGlyc1.0 Server).
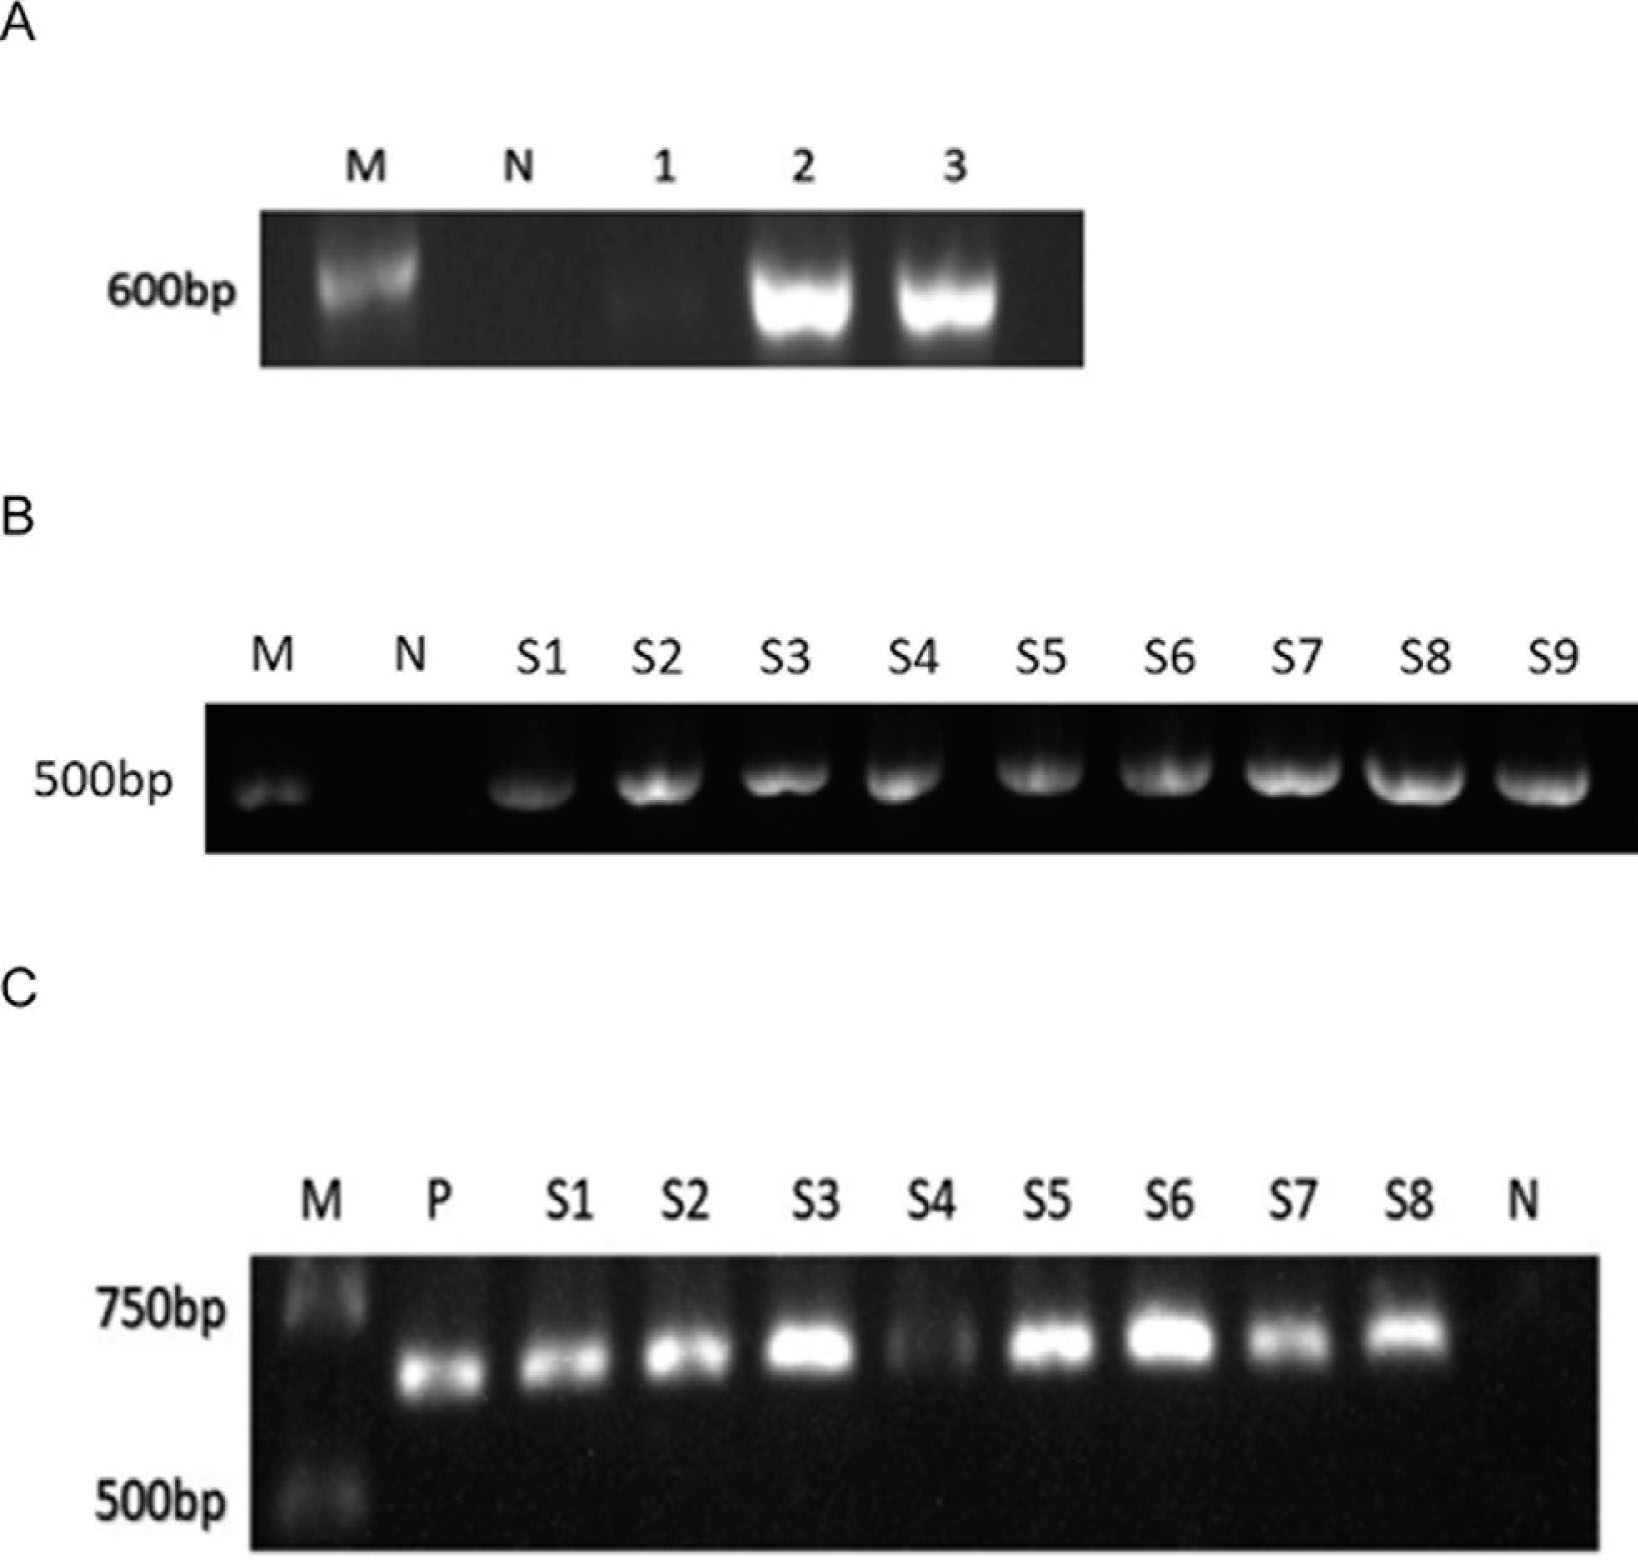
Figure 2
Expression of the variant of the gene for acrosomal binding protein, ACRBP-V5a and the gene for human glyceraldehyde 3-phosphate dehydrogenase (GAPDH) in tissues and cell lines. Left of the DNA ladder (lane M, catalog Nos. MD101-01 or MD104-01; Vazyme Biotech) are the respective numbers of base pairs. Lane N, reaction mixture with H2O alone. (A) Primers located around the human ACRBP-V5a cDNA region are encoded by exons 4–5a and bands of 600 bp represent the splice variant. Lane 1 cDNA of SHG-44 (glioma cell line), lanes 2 and 3 hep G2 and 3 SMMC7721 (both hepatocarcinoma cell lines), respectively. (B) Lanes S1–9 represent tumor tissues of 9 patients and cloned 496 bp of GAPDH cDNA. (C) Positive control testis sample (lane P) derived from SMMC7721 cDNA.
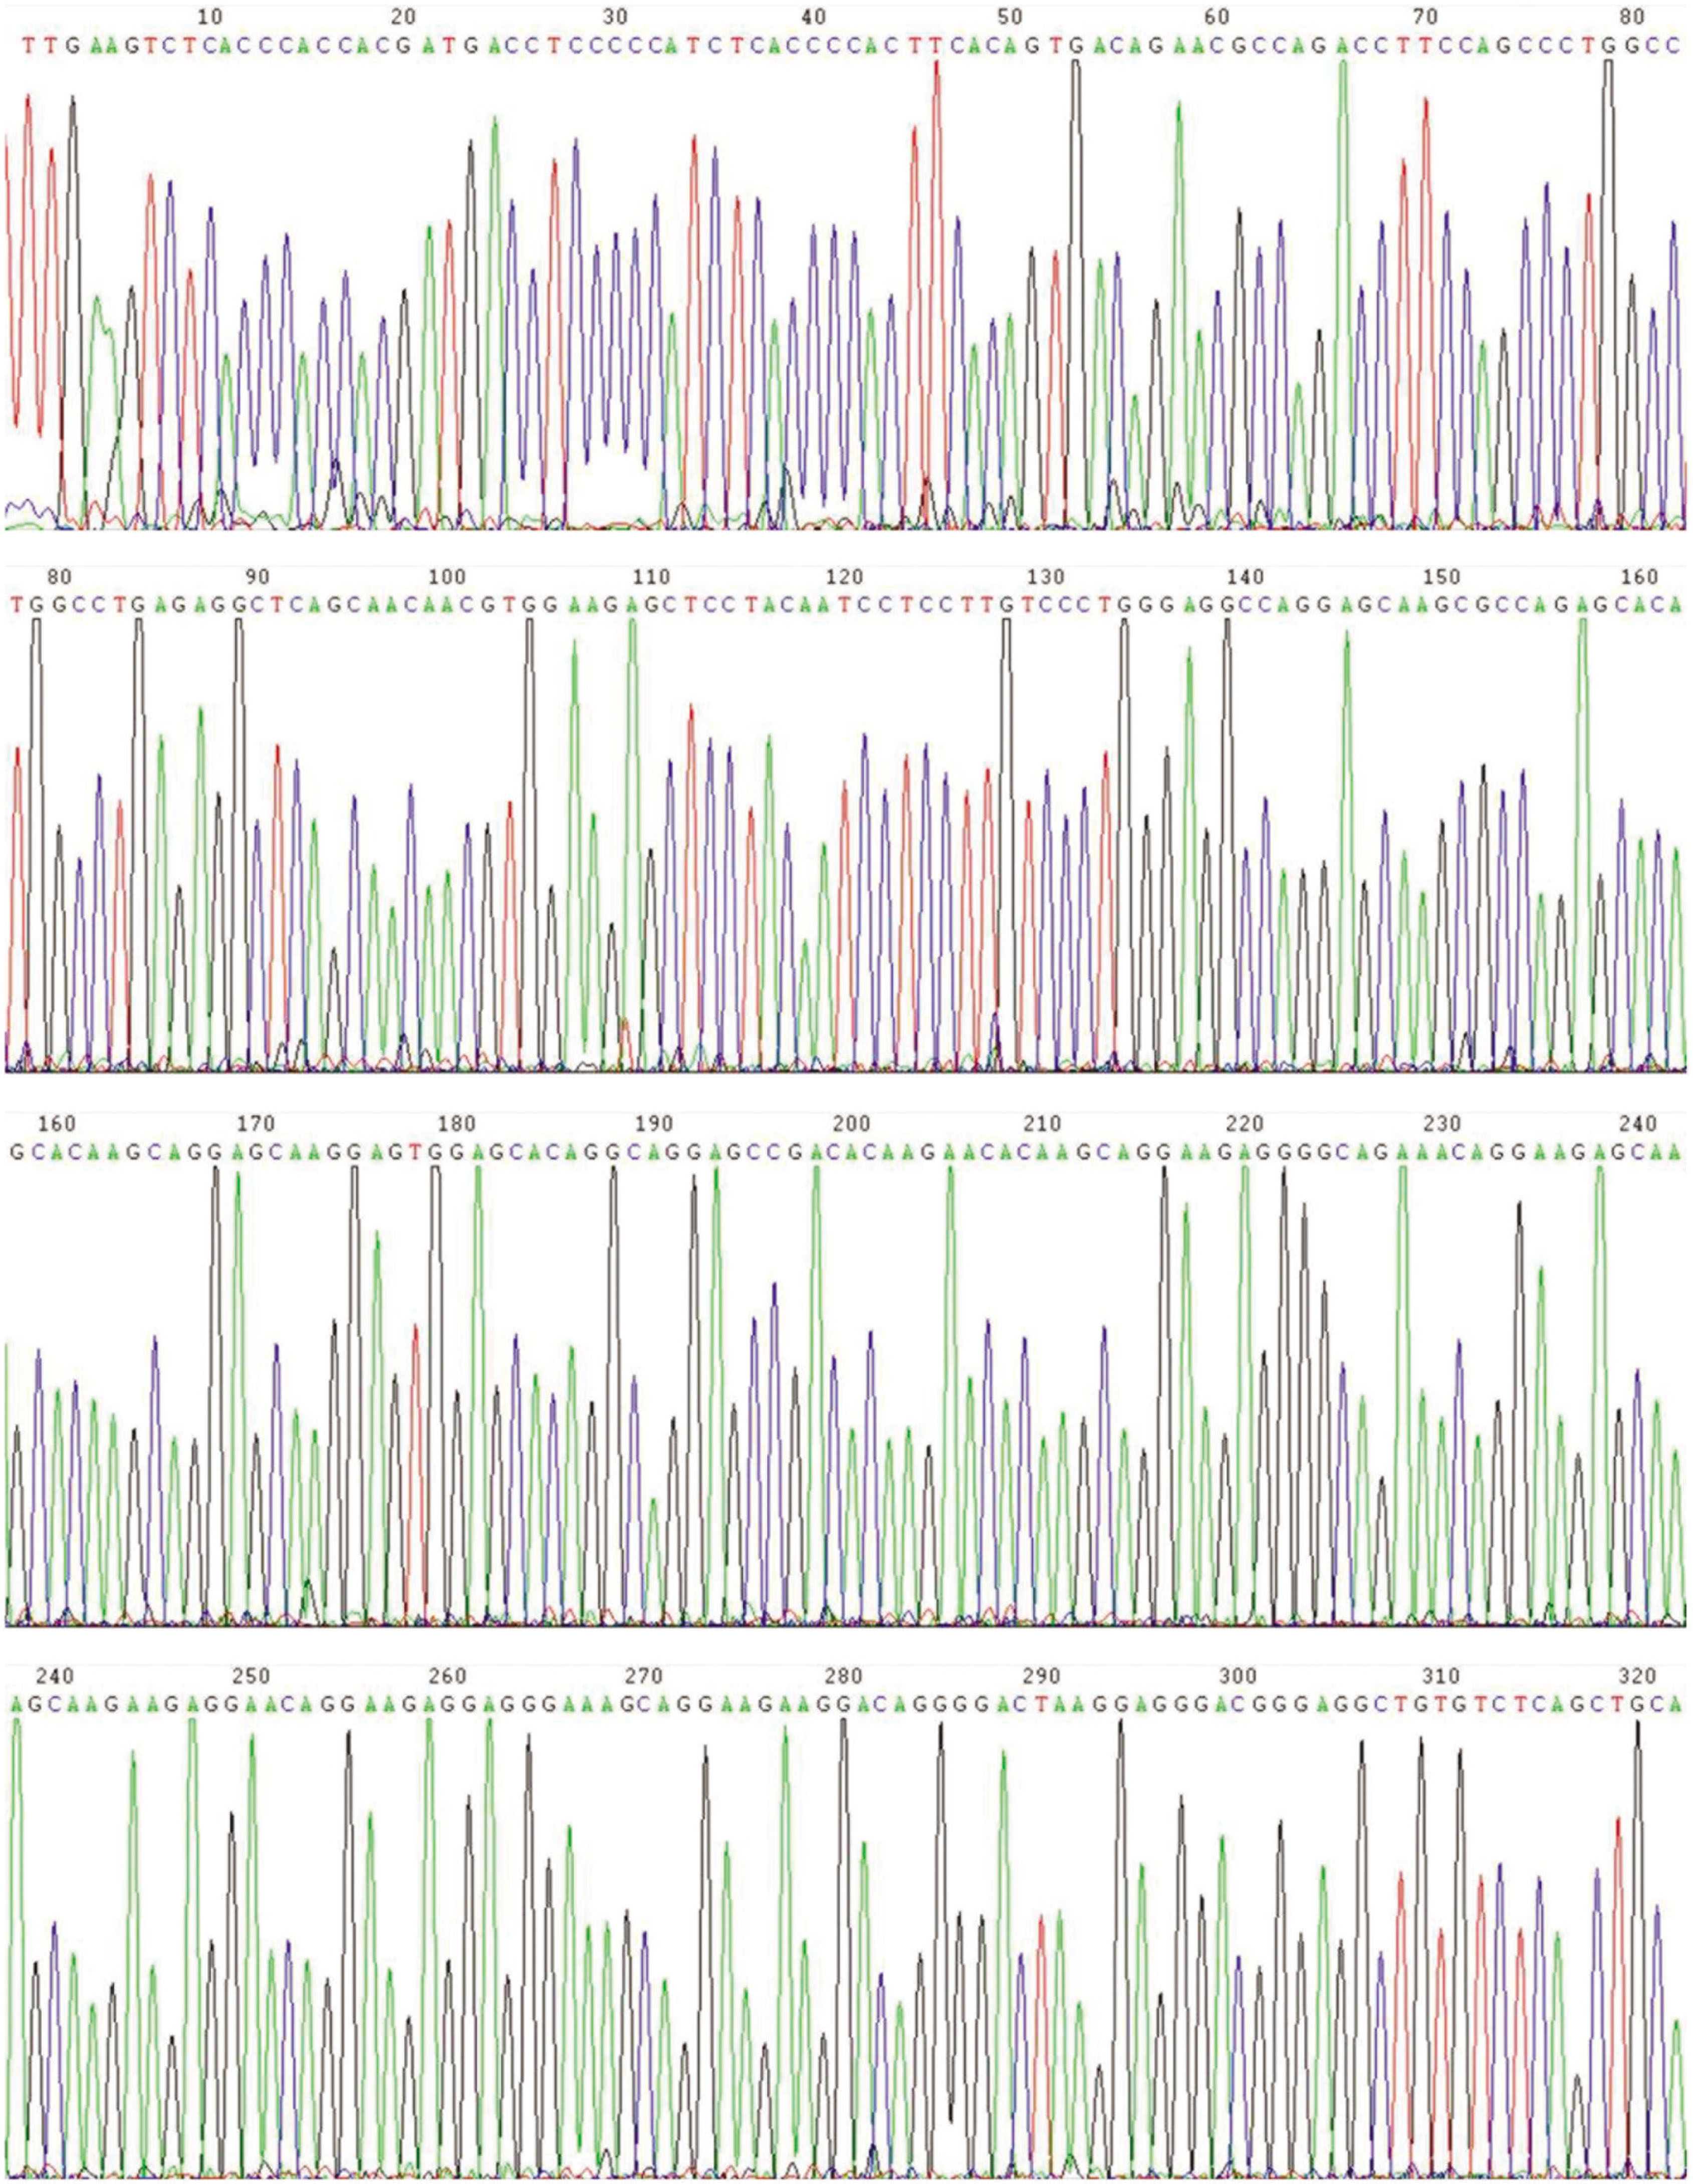
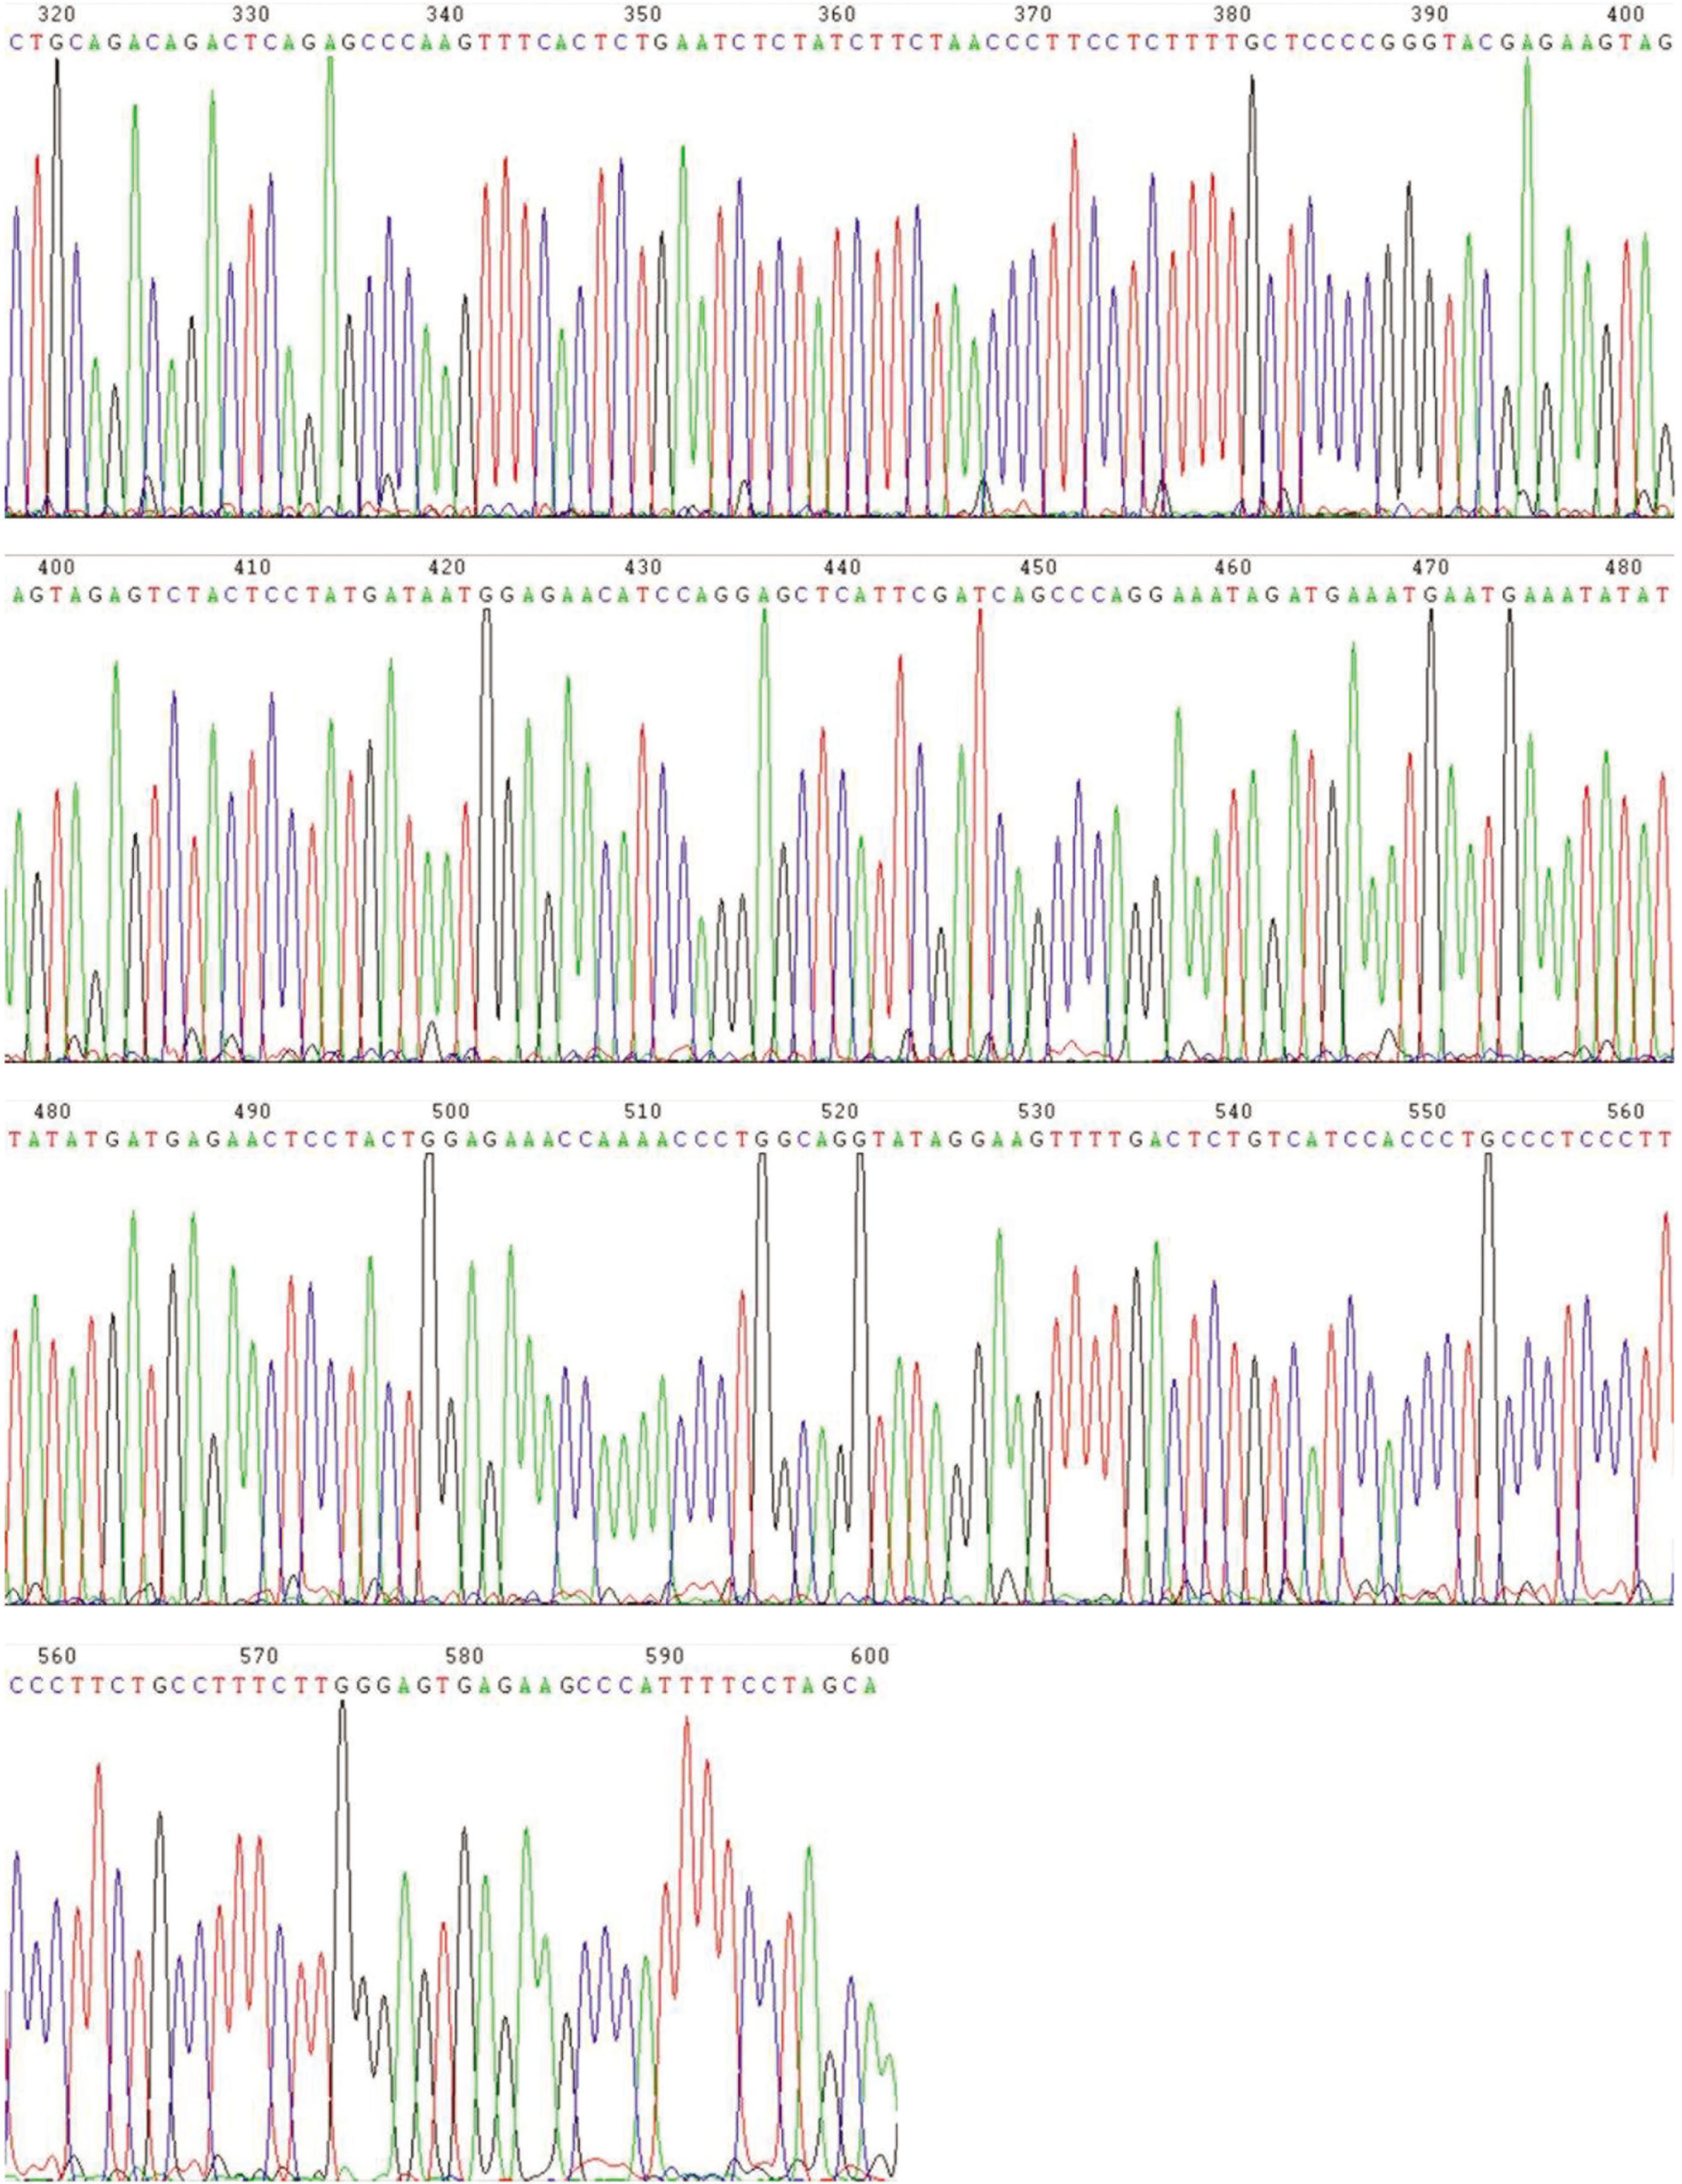
Figure 3
Sequence of the TA cloning result for the variant of the gene for acrosomal binding protein, ACRBP-V5a.

Figure 4
Genomic structure of the gene for acrosomal binding protein, ACRBP. The exons are shown as boxes and the introns as lines. The dark box is exon 5a. Two double-headed arrows represent the cloning sequences of E5, E8, and V5a respectively.
Table 1
Analysis of ACRBP-V5a expression and clinicopathological characteristics
| Clinicopathological characteristic | No. of mRNA positive patient samples/total samples (%) | †P | Relative expression Mean ± SE | ‡P |
|---|---|---|---|---|
| Sex | ||||
| Male | 21/63 (33.3) | 0.29 | 46.7 ± 14.0 | 0.81 |
| Female | 13/29 (44.8) | 41.7 ± 11.3 | ||
| Age (years) | ||||
| <34 | 20/46 (43.5) | 0.20 | 50.7 ± 9.5 | 0.47 |
| ≥34 | 14/46 (30.4) | 36.4 ± 19.1 | ||
| KPS§ | ||||
| <70 | 15/34 (44.1) | 0.28 | 57.6 ± 18.7 | 0.24 |
| ≥70 | 19/58 (32.8) | 34.7 ± 8.5 | ||
| Tumor grade‖ | ||||
| II | 10/33 (30.3) | 0.32 | 17.7 ± 3.8 | 0.01* |
| IV | 24/59 (40.7) | 56.1 ± 12.8 | ||
| Tumor type | ||||
| Astrocytoma | 10/33 (30.3) | 0.30¶ | 17.7 ± 3.8 | 0.02* |
| Glioblastoma | 10/30 (33.3) | 50.4 ± 26.1 | ||
| Medulloblastoma | 14/29 (48.3) | 60.2 ± 12.7 | ||
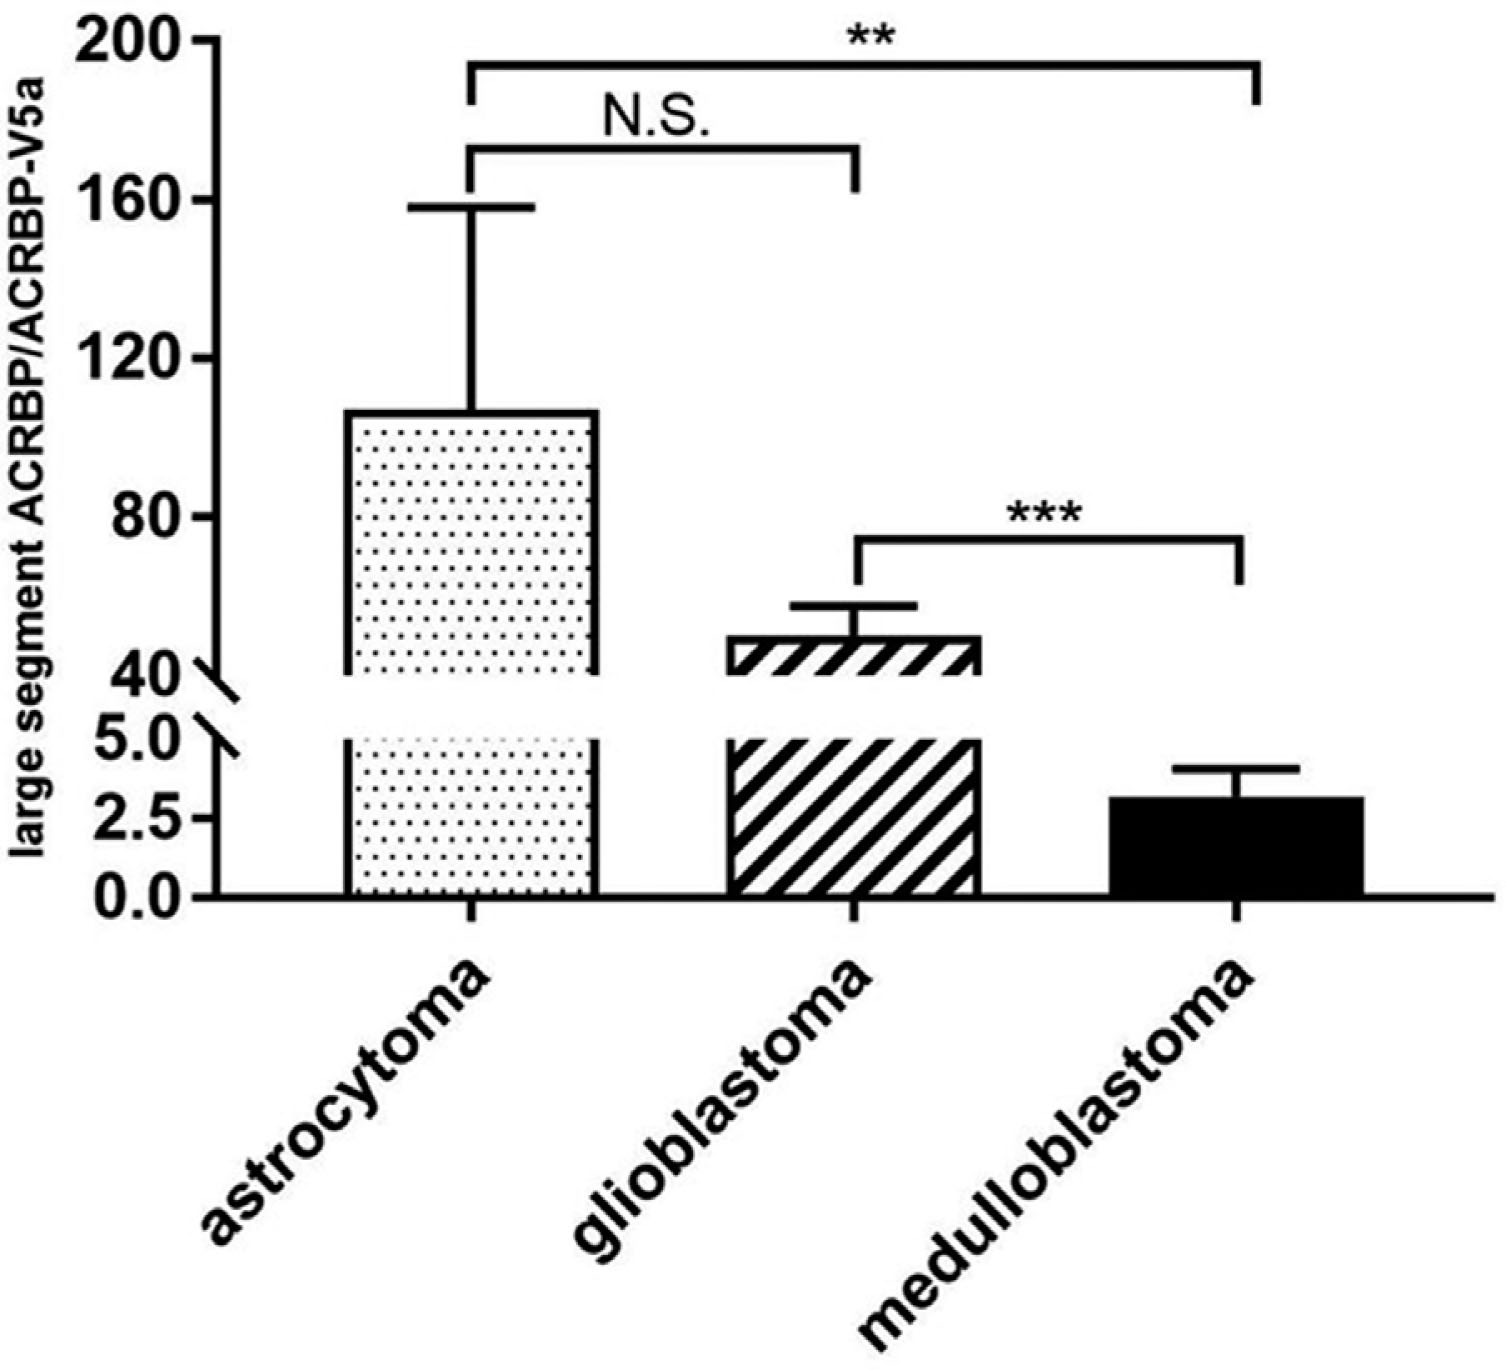
Figure 5
The ratios of ACRBP to ACRBP-V5a in the 3 types of brain tumors. Data represent mean ± SE. A Mann–Whitney U test was used to determine the differences between the 3 different types. N.S.: not significant; **P < 0.01, ***P < 0.001.
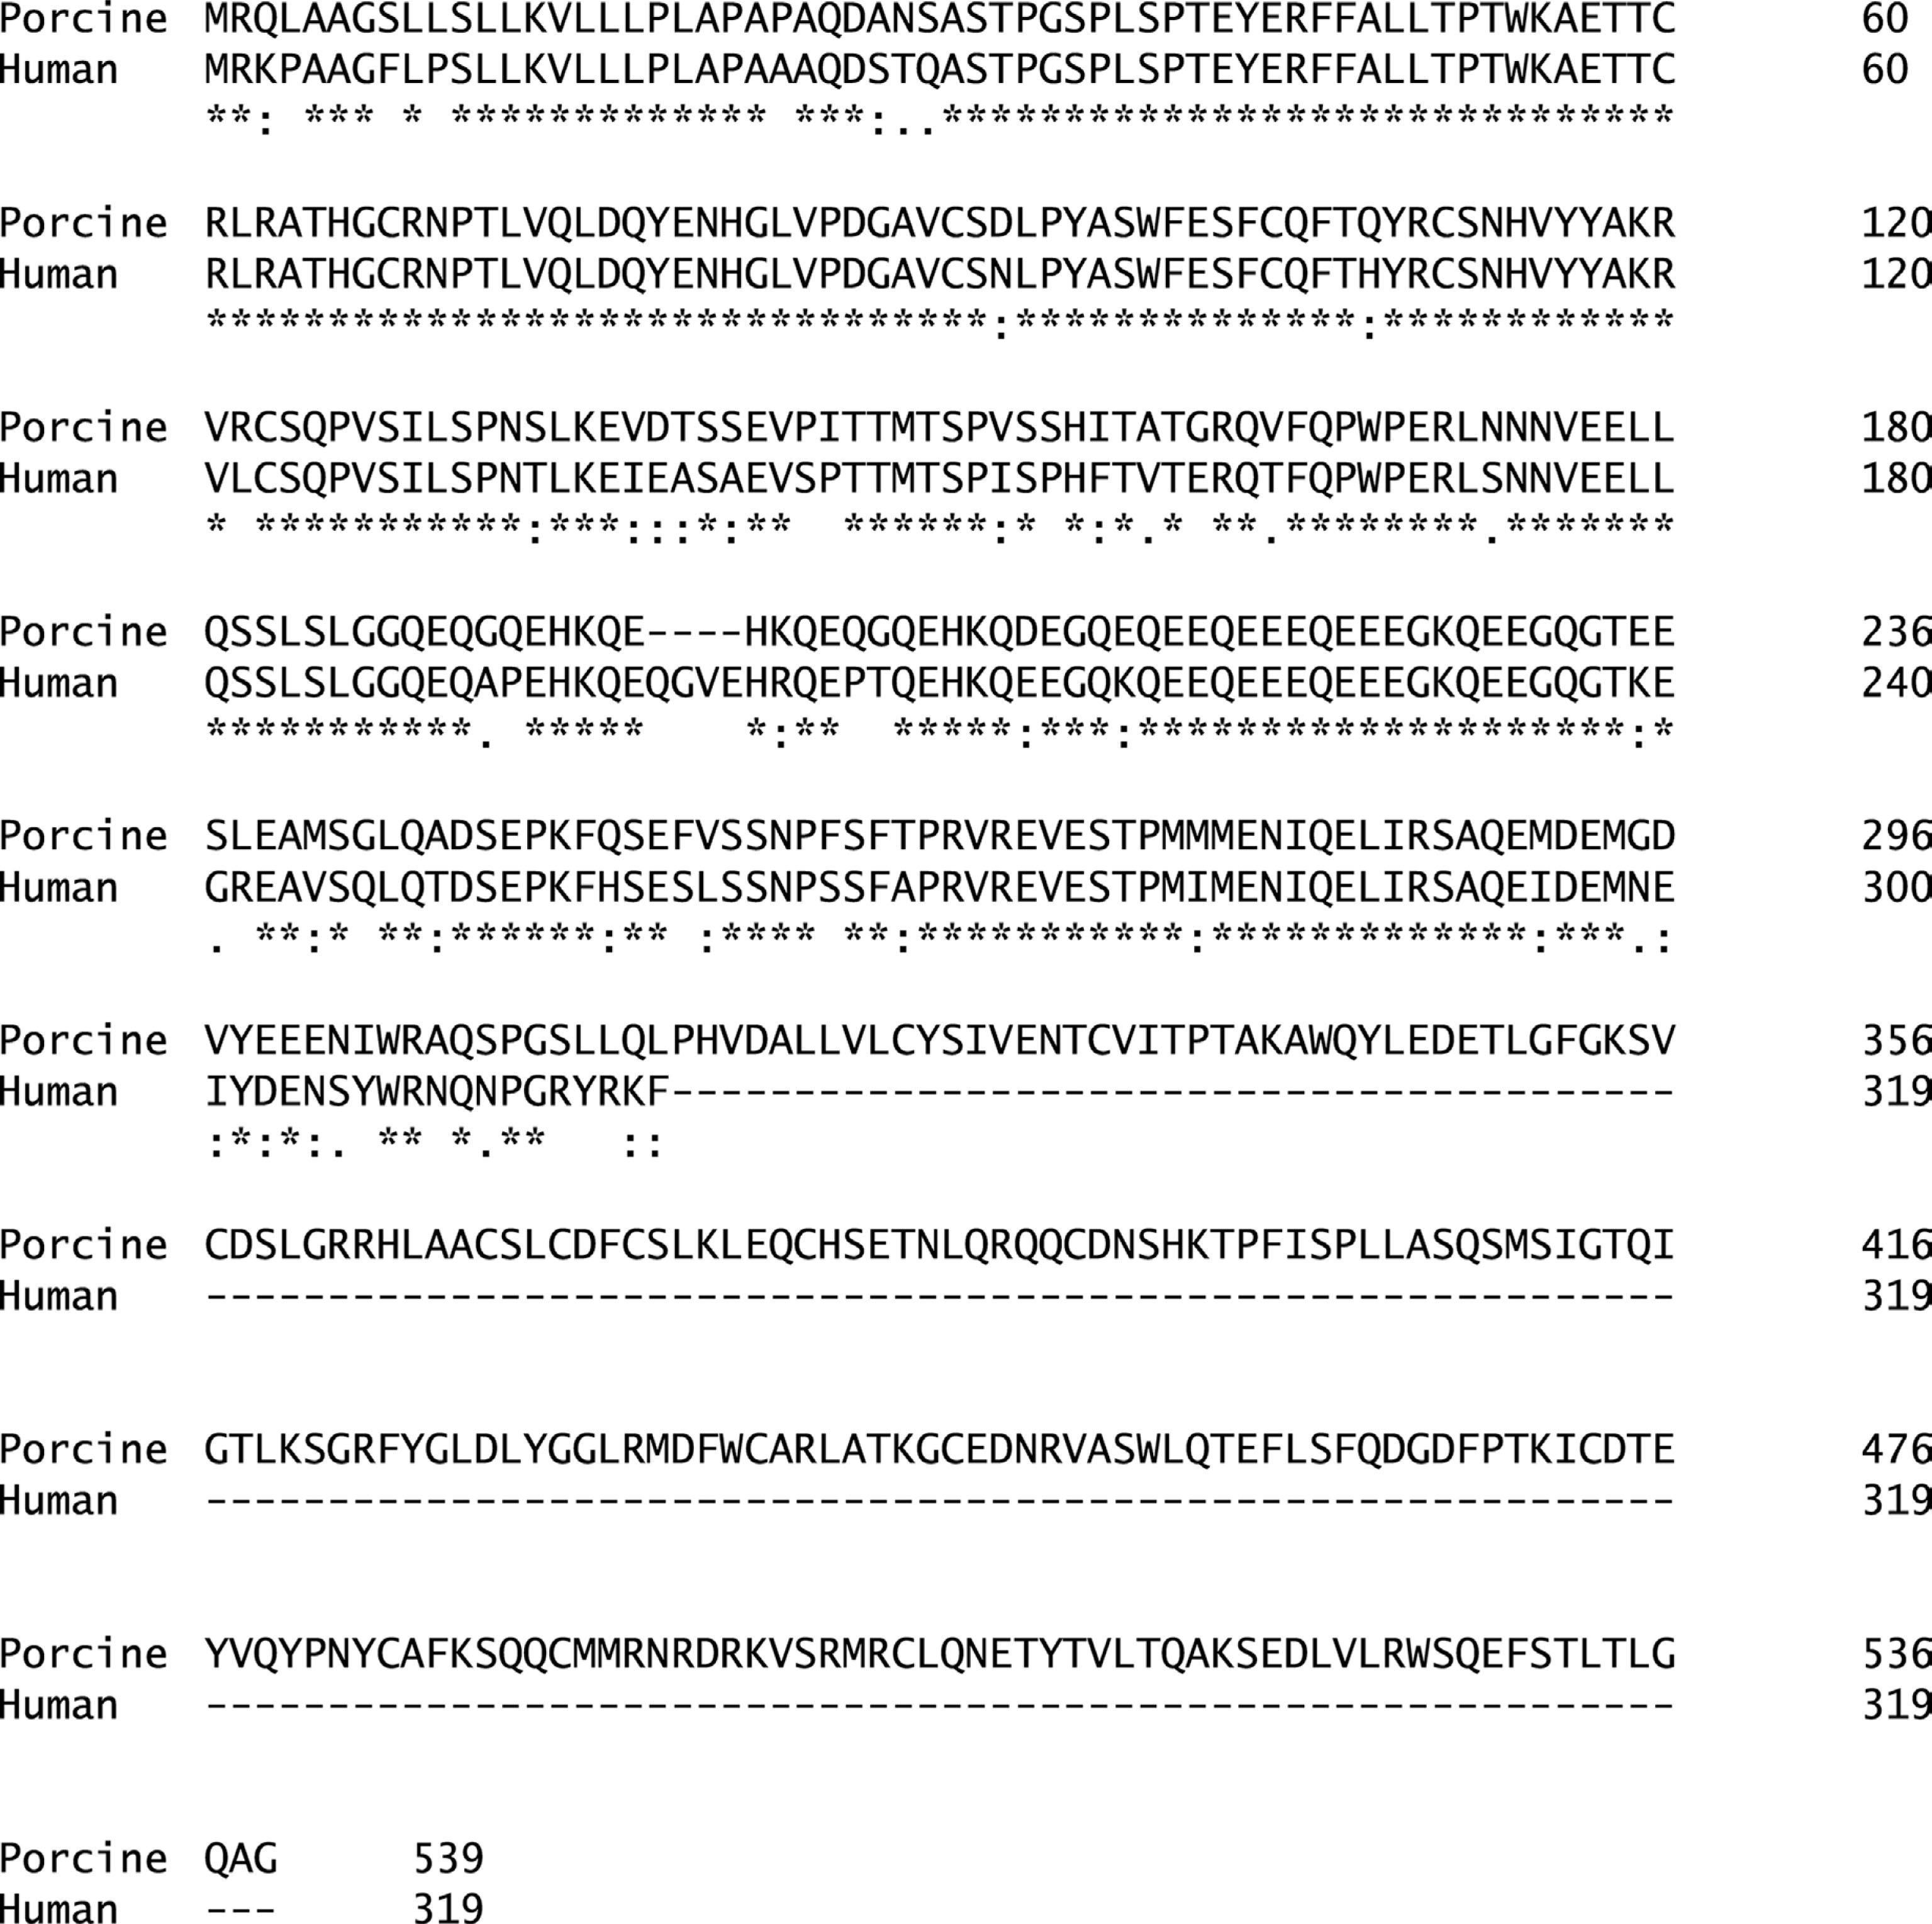
Figure 6
Comparison of porcine (full-length) and human (V5a) amino acid sequences for acrosomal binding protein (ACRBP; Clustal Omega alignment program, https://www.ebi.ac.uk/Tools/msa/clustalo/). An * (asterisk) indicates positions that have a single, fully conserved residue. A: (colon) indicates conservation between groups (porcine and human) of strongly similar properties. A. (period) indicates conservation between groups of weakly similar properties.