
Table 1
Real-time PCR primer sequences
| Primers | Sequence | Product size |
|---|---|---|
| β-catenin | F: AAAATGGCAGTGCGTTTAG | 100 bp |
| R: TTTGAAGGCAGTCTGTCGTA | ||
| Twist | F: TGCGGAAGATCATCCCCACG | 137 bp |
| R: GCTGCAGCTTGCCATCTTGGA | ||
| ZEB1 | F: TGCACTGAGTGTGGAAAAGC | 237 bp |
| R: TGGTGATGCTGAAAGAGACG | ||
| Vimentin | F: ACCCGCACCAACGAGAAGGT | 90 bp |
| R: ATTCTGCTGCTCCAGGAAGCG | ||
| Fibronectin | F: TCCTTGCTGGTATCATGGCAG | 74 bp |
| R: AGACCCAGGCTTCTCATACTTGA | ||
| ICAM1 | F: AGGCCACCCCAGAGGACAAC | 406 bp |
| R: CCCATTATGACTGCGGCTGCTA | ||
| VEGF | F: CCTTGCTGCTCTACCTCCAC | 280 bp |
| R: ATCTGCATGGTGATGTTGGA | ||
| GAPDH | F: AAGGTGAAGGTCGGAGTCAAC | 102 bp |
| R: GGGGTCATTGATGGCAACAATA |
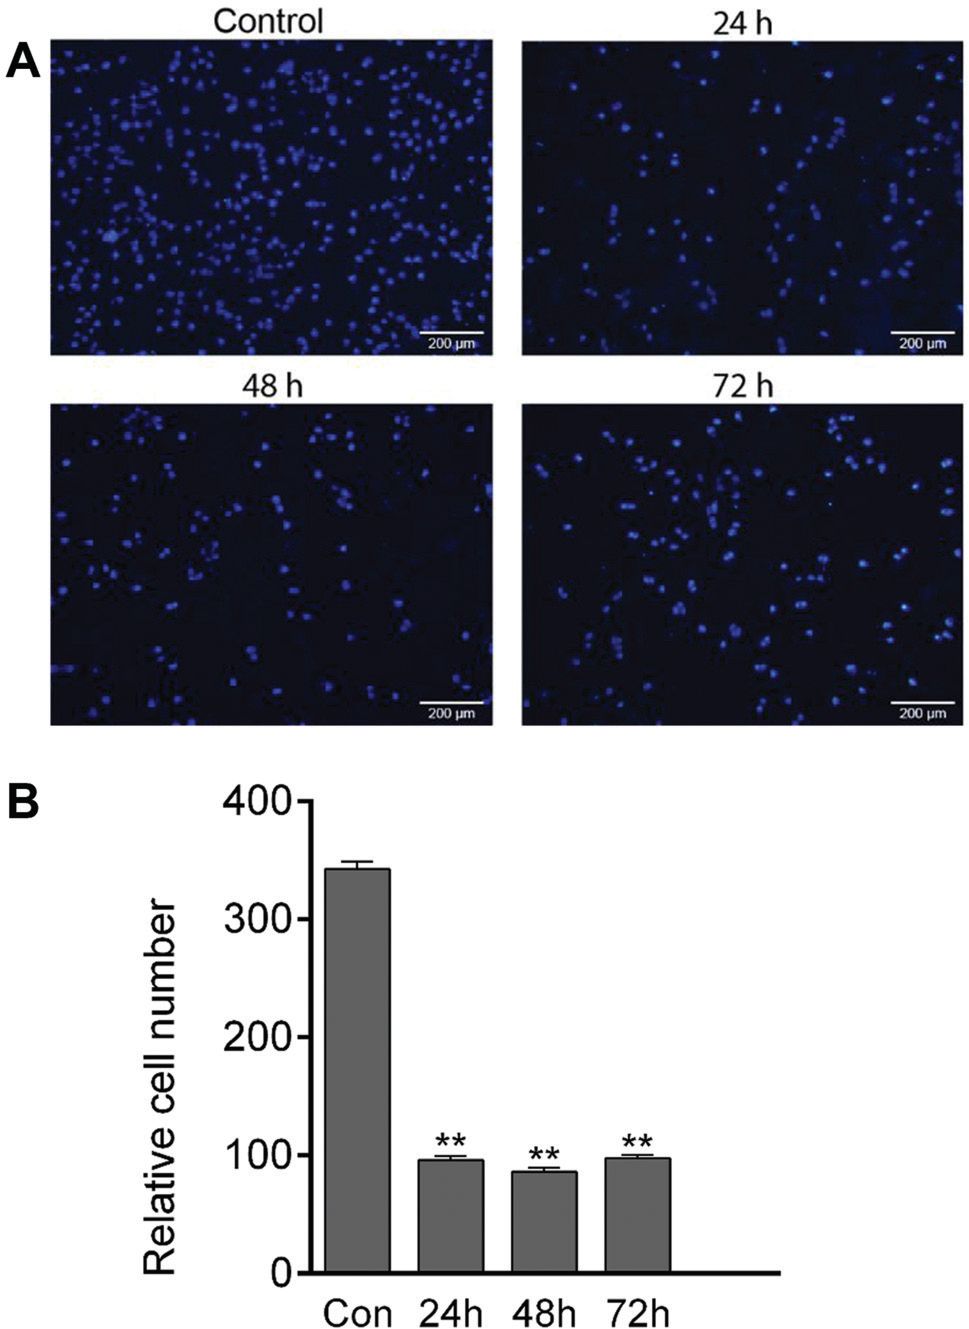
Figure 1
Serum starvation inhibited cell migration. (A) Cells migrated to the basal side of the membrane were stained and images were captured at a magnification of 100×. (B) Results are presented in graphs as the average number of migrated cells on the underside of the filter. **donates P < 0.01, as compared to the control. Experiments were performed in triplicate wells for each condition and repeated at least twice. The significance of difference between the groups was assessed by one-way ANOVA followed by Dunnett’s test.
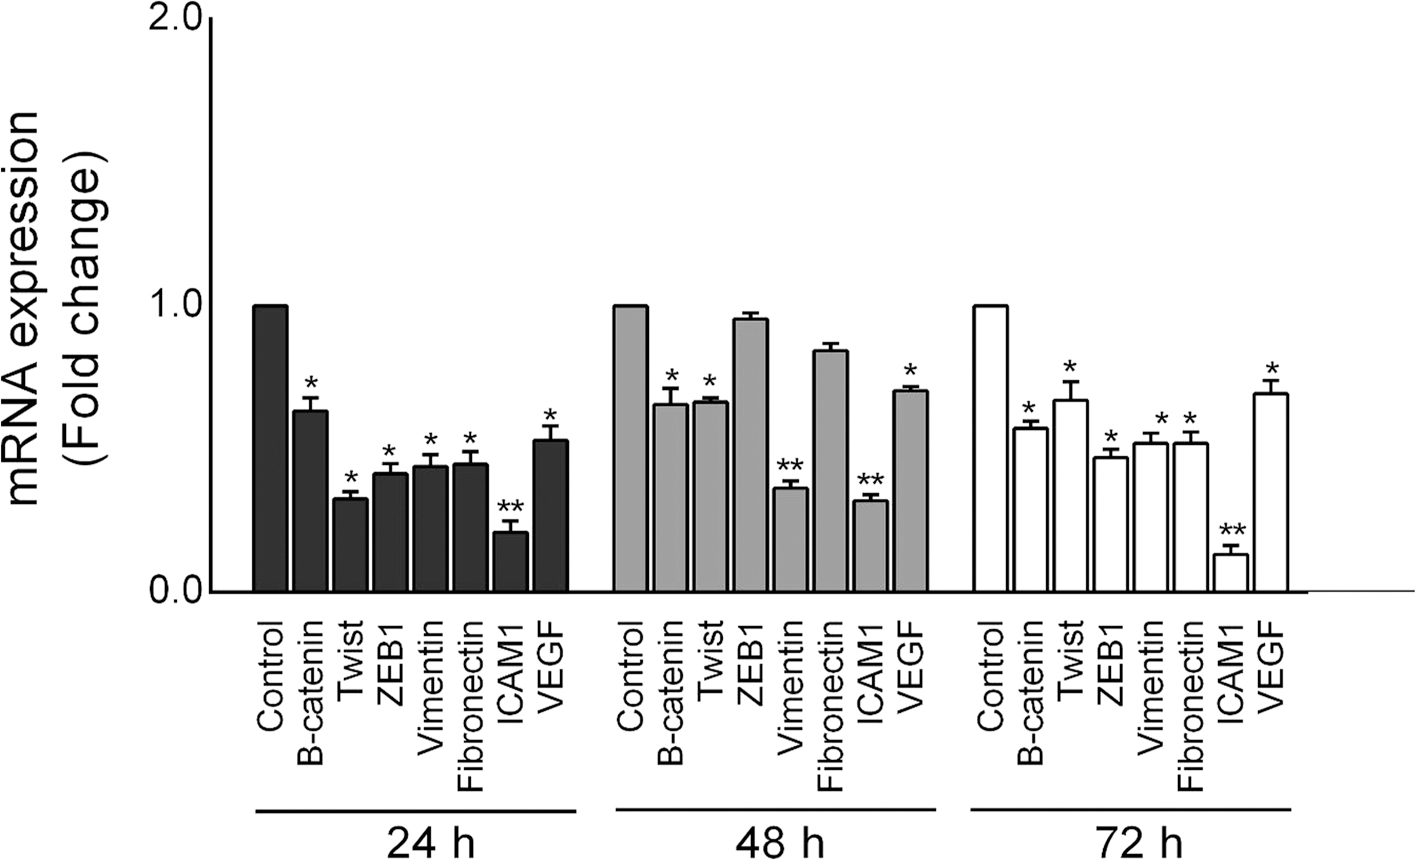
Figure 2
Expression of migration-related genes in MDA-MB-231 cells were downregulated by serum starvation after 24, 48, and 72 h. Relative levels are presented as fold change compared with untreated. * and ** denote P < 0.05 and P < 0.01, respectively, as compared to the control. All experiments were performed in triplicate wells for each condition and repeated at least twice. The significance of difference between the groups was assessed by one-way ANOVA followed by Dunnett’s test.
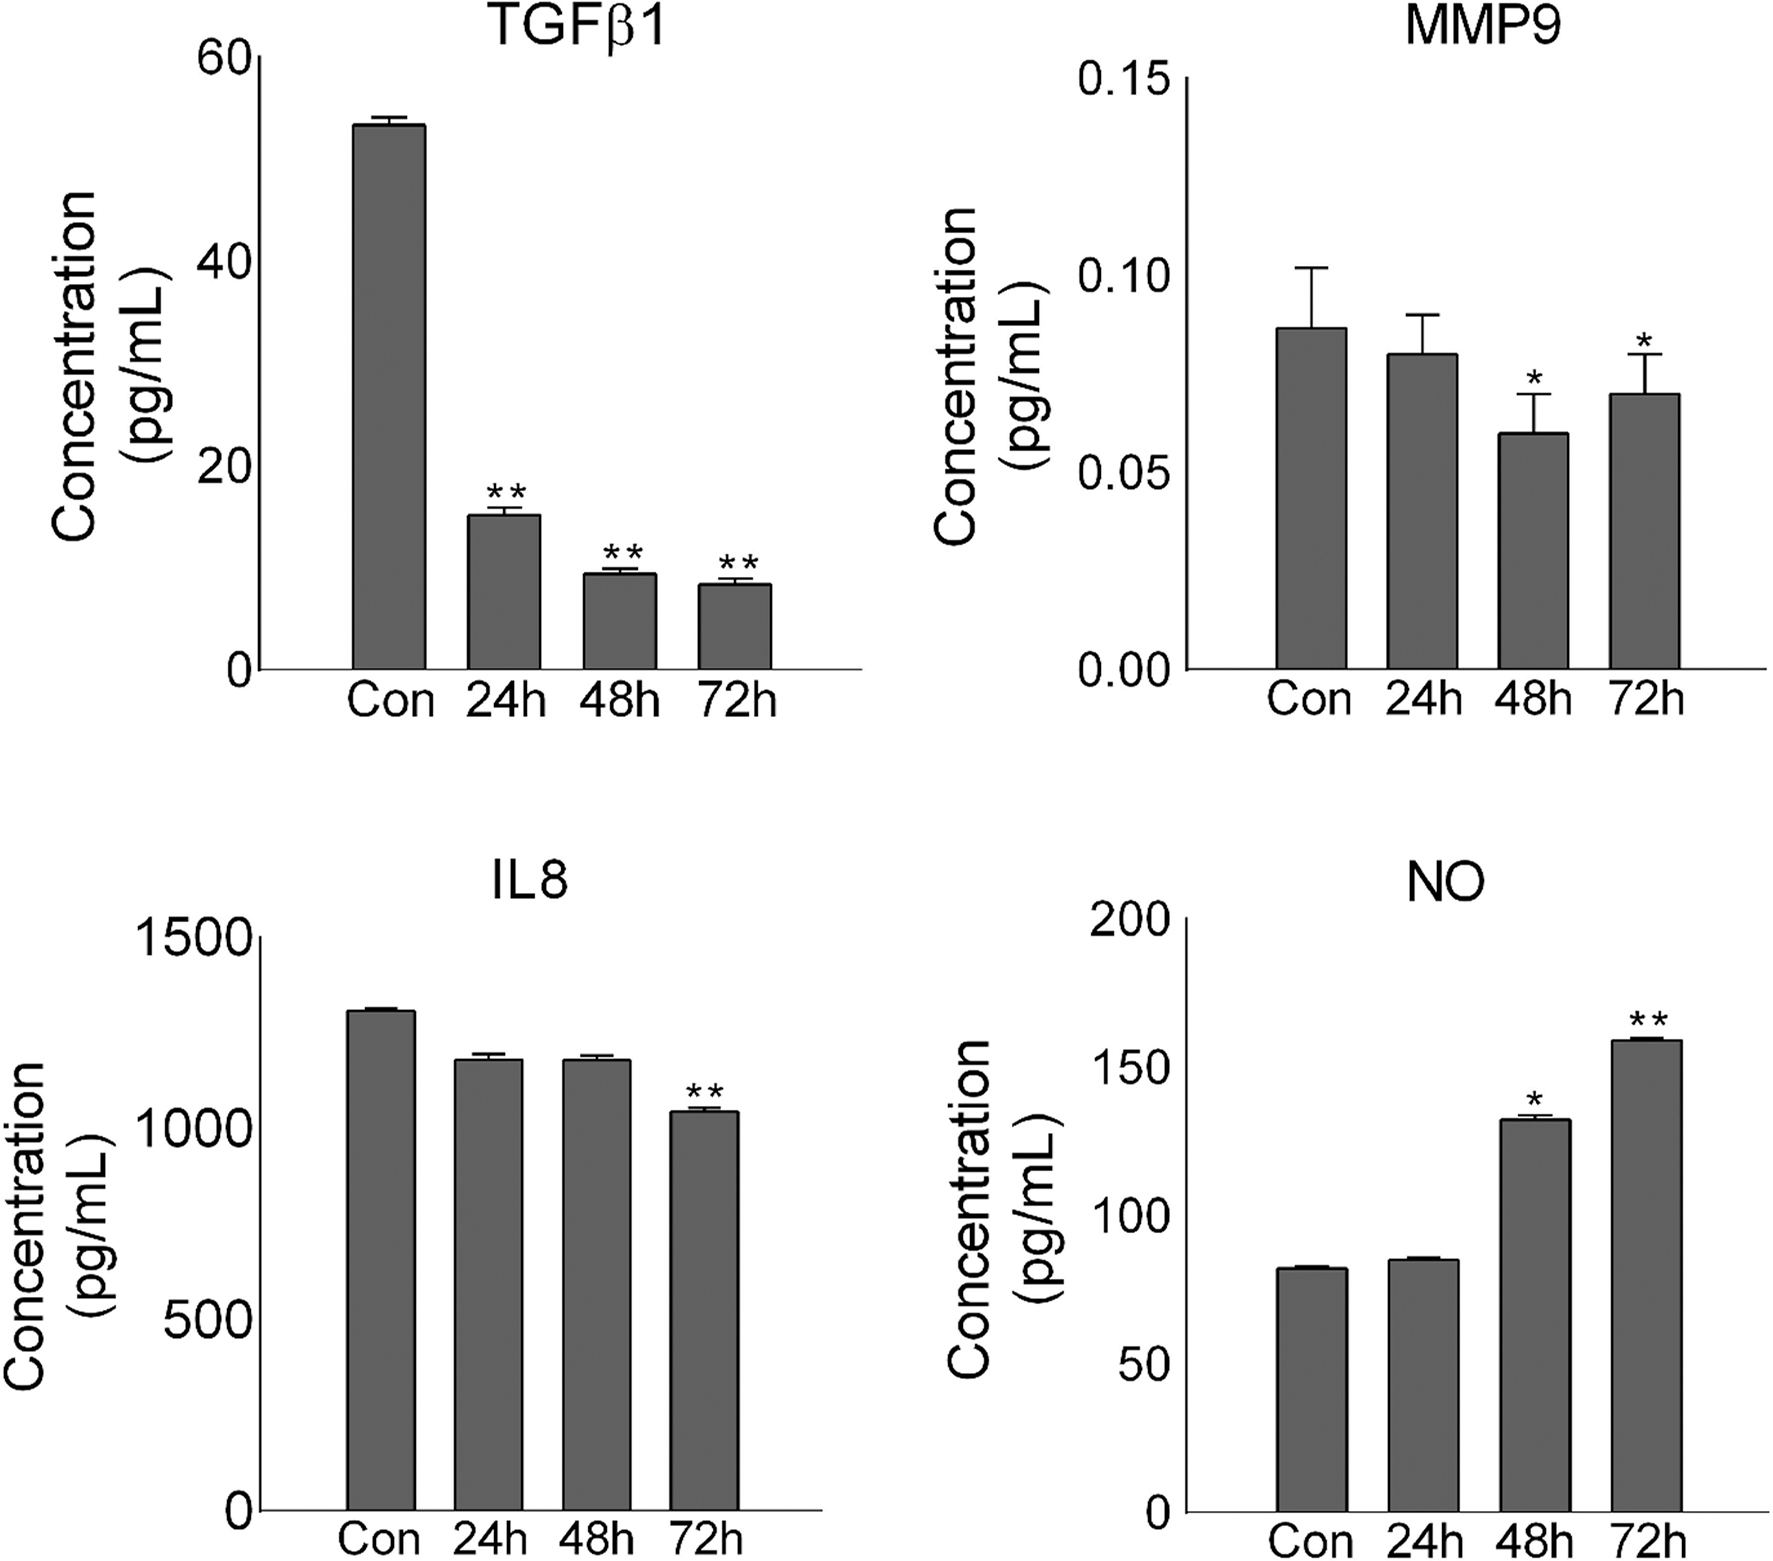
Figure 3
Cytokine release was assessed by ELISA. TGFβ1, MMP9, IL8, and NO concentrations (mean pg/mL ± SD) were measured in the super-natant of MDA-MB-231 cells underwent serum starvation for 24, 48, and 72 h. Significance was set at *P < 0.05 and **P < 0.01. Experiments were performed in triplicate. The significance of difference between the groups was assessed by one-way ANOVA followed by Dunnett’s test.