
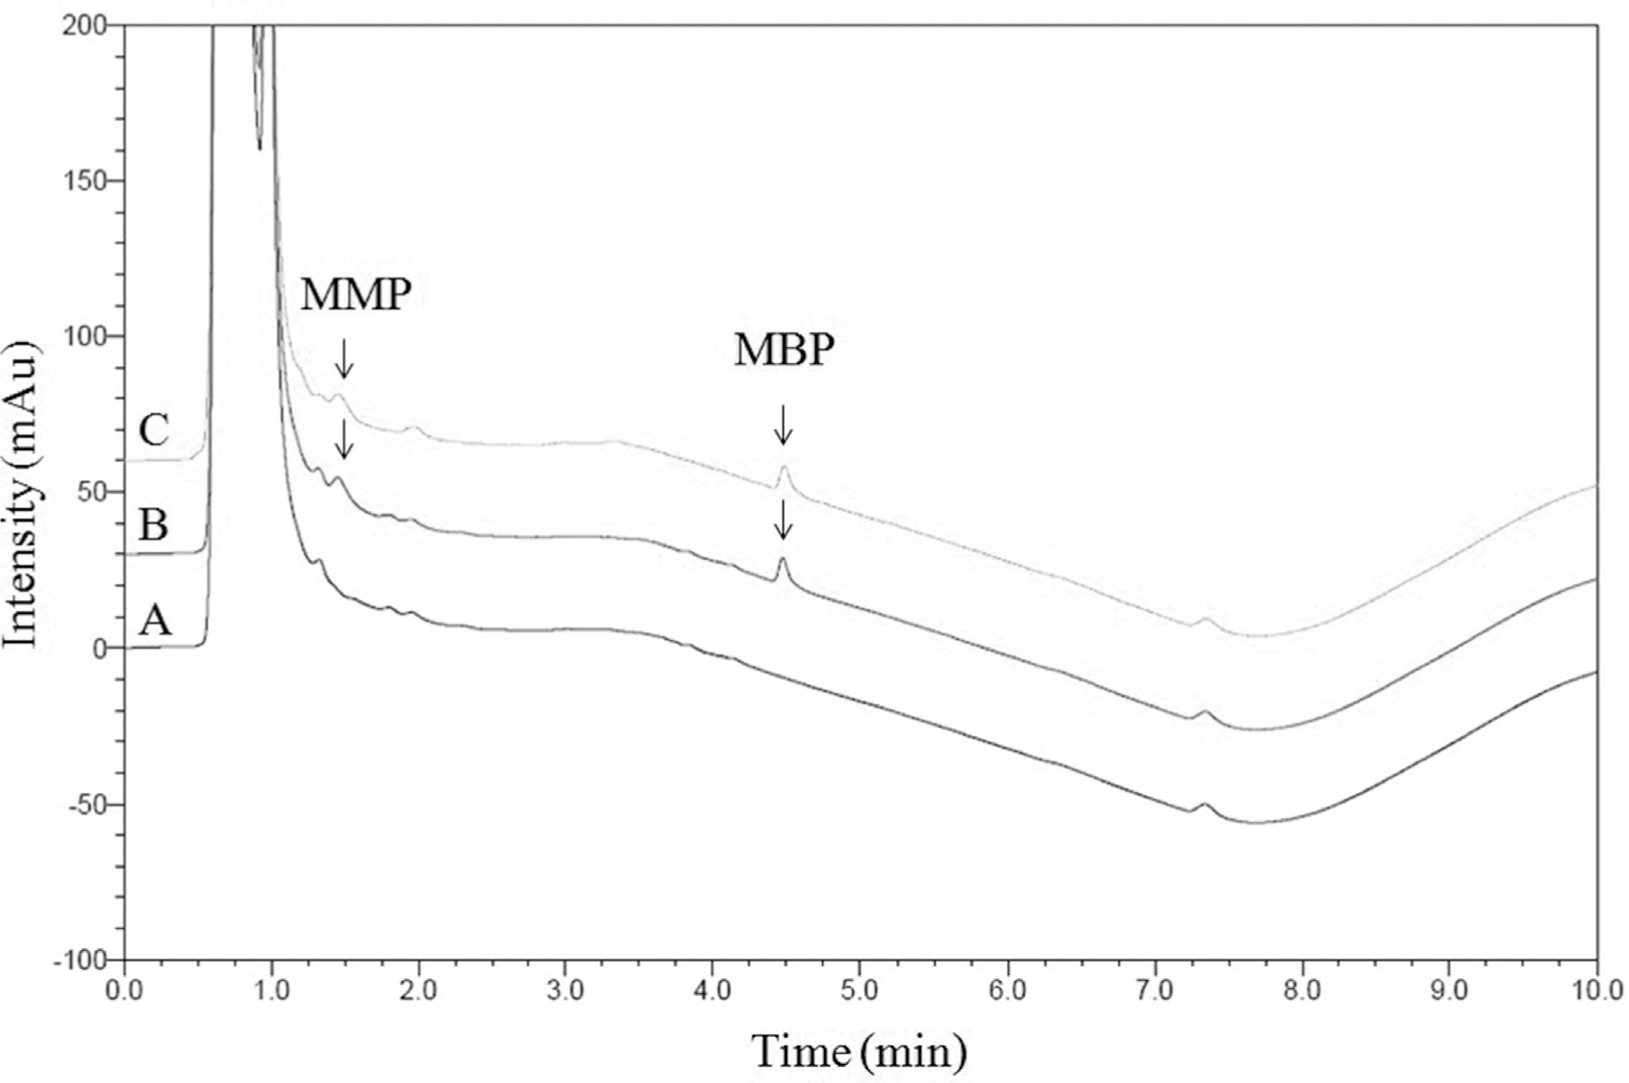
Figure 1
(A) Chromatogram of blank urine; (B) phthalate-spiked blank urine (MMP and MBP at 250 ng/mL); and (C) representative urine sample containing MMP and MBP. MBP, mono-n-butyl phthalate; MMP, monomethyl phthalate
Table 1
Sociodemographic characteristics of the study population (N = 221)
| Characteristic | n (%) |
|---|---|
| Sex | |
| Male | 103 (45.9) |
| Female | 118 (54.0) |
| Age (y), mean ± SD | 9.4 ± 3.64 |
| < 6 | 44 (19.9) |
| 6–11 | 129 (58.3) |
| 12–18 | 48 (21.7) |
| Family income (EUR/mo) | |
| <€526 | 45 (20.4) |
| €526–€1052 | 68 (30.7) |
| >€1052 | 108 (48.8) |
| Education of parents | |
| None | 2 (0.9) |
| Elementary | 26 (11.7) |
| High school | 29 (13.0) |
| Vocational certificate | 36 (16.1) |
| Bachelor of Arts and higher | 128 (57.9) |
| Pubertal staging | |
| Prepuberty | 130 (58.8) |
| Puberty | 71 (32.1) |
| Uncertain | 20 (9.0) |
| Media exposure | |
| <1 h | 35 (15.8) |
| 1–2 h | 76 (34.3) |
| >2 h | 110 (49.7) |
[i] Notes: EUR, euro; SD, standard deviation
Table 2
Detection rate of phthalate metabolites
| MMP | MBP | |
|---|---|---|
| n (%) | 63 (28.5) | 196 (88.6) |
| Mean ± SD (μg/g of Cr) | 1937.95 ± 4754.27 | 657.97 ± 1459.75 |
| GM (95% CI) (μg/g of Cr) | 3400 (2489.9–4642.8) | 214.4 (164.6–279.1) |
| Median (μg/g of Cr) | 0 | 252 |
[i] Notes: CI, confidence interval; Cr, creatinine; GM; geometric mean; MBP, mono-n-butyl phthalate; MMP, monomethyl phthalate; SD, standard deviation
Table 3
Beta coefficient of Cr-adjusted urinary MMP and MBP concentrations (μg/g of Cr) according to Tanner stage adjusted by sex
| Characteristics | Adjusted urinary MMP* (μg/g of Creatinine) | Adjusted urinary MMP* (μg/g of Creatinine) | ||||
|---|---|---|---|---|---|---|
| Beta coefficient | SE | P | Beta coefficient | SE | P | |
| Tanner stage | −303.76 | 260.01 | 0.24 | −200.14 | 85.41 | 0.02 |
Notes: The P-values were generated by multiple linear regression analysis. MBP, mono-n-butyl phthalate; MMP, monomethyl phthalate; SE, standard error.
Table 4
Phthalate metabolite values expressed as mean ± SD and median (IQR) (μg/g of Creatinine) by source of exposure
| Source of exposure | n | MMP | MBP | |||||
|---|---|---|---|---|---|---|---|---|
| Mean ± SD | Median (IQR) | P | Mean ± SD | Median (IQR) | P | |||
| Shampoo | No | 39 | 1573.5 ± 3705.8 | 0 (0, 533) | 0.88 | 762.3 ± 1567.1 | 256.1 (47.9, 633.6) | 0.78 |
| Yes | 165 | 1701.2 ± 4784.8 | 0 (0, 459.8) | 685.8 ± 1530.6 | 200.4 (20.7, 440.9) | |||
| Hair conditioner | No | 121 | 1616.6 ± 4682.9 | 0 (0, 528.9) | 0.82 | 633.2 ± 1417.2 | 238.4 (47.9, 522.2) | 0.45 |
| Yes | 83 | 1764.5 ± 4478.1 | 0 (0, 459.8) | 798.4 ± 1694.2 | 160.4 (7.3, 548.4) | |||
| Hair spray/hair gel | No | 187 | 1774.8 ± 4757.4 | 0 (0, 619.9) | 0.31 | 743 ± 1594.6 | 212.1 (18, 540.3) | 0.19 |
| Yes | 17 | 598.3 ± 1689.2 | 0 (0, 0) | 232.5 ± 211.3 | 196.1 (91.6, 281.5) | |||
| Toothpaste | No | 5 | 3688.8 ± 4423.4 | 1054.4 (533, 7238.1) | 0.32 | 693.4 ± 761.1 | 256.1 (206, 1063.3) | 0.99 |
| Yes | 199 | 1626.3 ± 4593.6 | 0 (0, 438.1) | 700.6 ± 1549.5 | 206.9 (18, 523.6) | |||
| Mouthwash | No | 162 | 1639.8 ± 4510.5 | 0 (0, 533) | 0.82 | 681.3 ± 1516.8 | 212.8 (61.9, 523.6) | 0.73 |
| Yes | 42 | 1819.5 ± 4939.8 | 0 (0, 438.1) | 774.1 ± 1615.5 | 177.6 (0, 579.1) | |||
| Shaving cream | No | 200 | 1710.3 ± 4629.8 | 0 (0, 531) | 0.46 | 712.2 ± 1547 | 212.8 (25.3, 529.2) | 0.44 |
| Yes | 4 | 0 ± 0 | 0 (0, 0) | 110.4 ± 83.9 | 128.2 (45.8, 175) | |||
| Perfume | No | 182 | 1815.8 ± 4822.9 | 0 (0, 533) | 0.21 | 725.2 ± 1584.6 | 212.8 (43.4, 530.5) | 0.51 |
| Yes | 22 | 527.2 ± 1276.9 | 0 (0, 0) | 495.6 ± 1027.7 | 153.8 (9.1, 336.2) | |||
| Soap | No | 8 | 3107.9 ± 6036.6 | 222.7 (0, 3849) | 0.37 | 649.8 ± 1157.5 | 37.9 (0, 896.4) | 0.92 |
| Yes | 196 | 1618.4 ± 4531.9 | 0 (0, 483.5) | 702.5 ± 1549.7 | 210.7 (45.7, 522.9) | |||
| Lotion | No | 97 | 1313.6 ± 3350.9 | 0 (0, 43) | 0.28 | 703.9 ± 1448.2 | 209.3 (61.9, 559.9) | 0.98 |
| Yes | 107 | 2006.1 ± 5472.6 | 0 (0, 925.4) | 697.3 ± 1614.8 | 200.4 (9.1, 440.9) | |||
| Cosmetics | No | 167 | 1669.3 ± 4547 | 0 (0, 533) | 0.96 | 657.1 ± 1469.9 | 212.1 (47.9, 522.2) | 0.39 |
| Yes | 37 | 1710.8 ± 4844.4 | 0 (0, 445.3) | 895.8 ± 1805.3 | 200.4 (6.2, 694.9) | |||
| Sunscreen | No | 160 | 1706.1 ± 4590.9 | 0 (0, 772.7) | 0.90 | 691.6 ± 1522.3 | 216.5 (58.6, 529.2) | 0.84 |
| Yes | 43 | 1606.7 ± 4687 | 0 (0, 0) | 746 ± 1609.9 | 196.1 (2.9, 514.2) | |||
| Deodorant | No | 148 | 1901.8 ± 4825.5 | 0 (0, 1015.9) | 0.26 | 726.7 ± 1564.3 | 226.2 (70.3, 554.2) | 0.69 |
| Yes | 56 | 1082.3 ± 3877.1 | 0 (0, 0) | 630.8 ± 1462.5 | 153.2 (5.9, 316.6) | |||
| Leather polish | No | 194 | 1652 ± 4499.4 | 0 (0, 528.9) | 0.74 | 679.1 ± 1501.9 | 208.1 (10.1, 527.9) | 0.38 |
| Yes | 10 | 2157.3 ± 6388.6 | 0 (0, 204) | 1114.5 ± 2122.5 | 217 (100.3, 418.4) | |||
| Floor cleaning liquid | No | 159 | 1258.8 ± 2968.8 | 0 (0, 528.9) | 0.014* | 625 ± 1386.9 | 206.9 (43.4, 522.2) | 0.19 |
| Yes | 45 | 3153.9 ± 7917.9 | 0 (0, 382.1) | 967.1 ± 1963.8 | 219.8 (6.2, 579.1) | |||
| Washing powder | No | 124 | 1213.5 ± 2836.3 | 0 (0, 494.4) | 0.07 | 629.7 ± 1423.6 | 206.2 (8.2, 479.5) | 0.41 |
| Yes | 80 | 2394.9 ± 6384 | 0 (0, 529) | 810.1 ± 1694.6 | 242.8 (70.3, 674) | |||
| Dish washing soap | No | 96 | 1242.1 ± 3027.9 | 0 (0, 366.5) | 0.20 | 637.6 ± 1445.6 | 208.1 (8.2, 522.9) | 0.58 |
| Yes | 108 | 2063.2 ± 5613.5 | 0 (0, 496.4) | 756.3 ± 1613.3 | 209 (70.3, 563.7) | |||
| Vinyl products | No | 133 | 1666.1 ± 4582.4 | 0 (0, 459.8) | 0.91 | 737.2 ± 1598.1 | 232.4 (29.9, 559.9) | 0.70 |
| Yes | 69 | 1746 ± 4695.4 | 0 (0, 533) | 647.5 ± 1432.1 | 193.8 (43.4, 440.9) | |||
| Paints | No | 196 | 1512 ± 3876.7 | 0 (0, 452.6) | 0.011* | 640.4 ± 1389.1 | 206.7 (25.3, 518.2) | 0.005* |
| Yes | 8 | 5714.5 ± 13151.4 | 0 (0, 4023.9) | 2170.1 ± 3452.7 | 436.2 (63.6, 3792.1) | |||
| Insecticide | No | 190 | 1521.5 ± 4151.9 | 0 (0, 459.8) | 0.08 | 656.8 ± 1472.2 | 206.2 (20.7, 523.6) | 0.14 |
| Yes | 14 | 3784.2 ± 8558.2 | 0 (0, 809.8) | 1292.6 ± 2198.4 | 307.9 (100.3, 764.6) | |||
| Mothballs | No | 200 | 1684.5 ± 4624.8 | 0 (0, 494.4) | 0.87 | 709.5 ± 1547.4 | 210.7 (25.3, 525.7) | 0.55 |
| Yes | 4 | 1289.6 ± 2579.2 | 0 (0, 2579.2) | 248.7 ± 348.4 | 115.2 (50.1, 447.3) | |||
Notes: The P values were generated by multiple linear regression analysis. IQR, interquartile range; MBP, mono-n-butyl phthalate; MMP, monomethyl phthalate; SD, standard deviation.
Table 5
Literature review of studies of urinary phthalate metabolite levels
| Study | Population | Age (y) | Method | MMP (μg/g Cr) | DR | MBP (μg/g Cr) | DR |
|---|---|---|---|---|---|---|---|
| Guo Y [34] | Chinese | 21–49 | HPLC/MS | 9.7 | 50% | 69.5 | >97% in |
| Indian | 5.8 | >95% | 14.9 | all | |||
| Japanese | 11.1 | >95% | 11.5 | ||||
| Korean | 2.7 | 50% | 19.8 | ||||
| Kuwaiti | Undetectable | 50% | 78.7 | ||||
| Malaysian | Undetectable | 33% | 15.1 | ||||
| Vietnamese | Undetectable | 50% | 14.1 | ||||
| Guo C [31] | Chinese | 18–22 | HPLC/MS | 12.2 | 99.1% | 74 | 100% |
| Casas et al. [32] | Spain | 4 | HPLC/MS | Not done | Not done | 30.2 | Not done |
| Silva et al. [33] | USA | 6–11 | HPLC/MS | Not done | Not done | 38.9 | Not done |
| Mouritsen et al. [36] | Denmark | 5.9–12.8 | LC/MS | Not done | Not done | 11.2 ng/mL (not corrected with Cr) | Not done |
| Bertelsen et al. [37] | Norway | 10 | HPLC/MS | Not done | Not done | 138.8 ng/mL (not corrected with Cr) | Not done |
| Present study | Thailand | 2–18 | HPLC | 0 | 28.5% | 252 | 88.6% |
[i] Notes: Cr, creatinine; DR, detection rate; HPLC/MS, high-performance liquid chromatography/mass spectrometry; LC/MS, liquid chromatography/mass spectrometry; NHANES, National Health and Nutrition Examination Survey.