
Figure 1
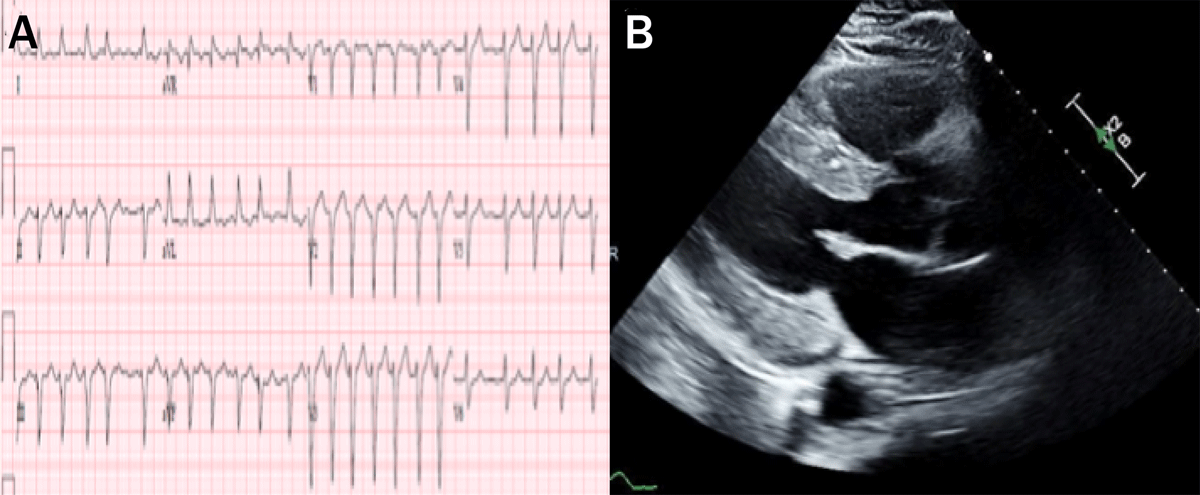
(A) Electrocardiography at presentation showed atrial fibrillation with rapid ventricular response but no evidence of low QRS voltage. (B) Echocardiography showed severe global hypokinesis of the left ventricle with a concentric wall thickness.
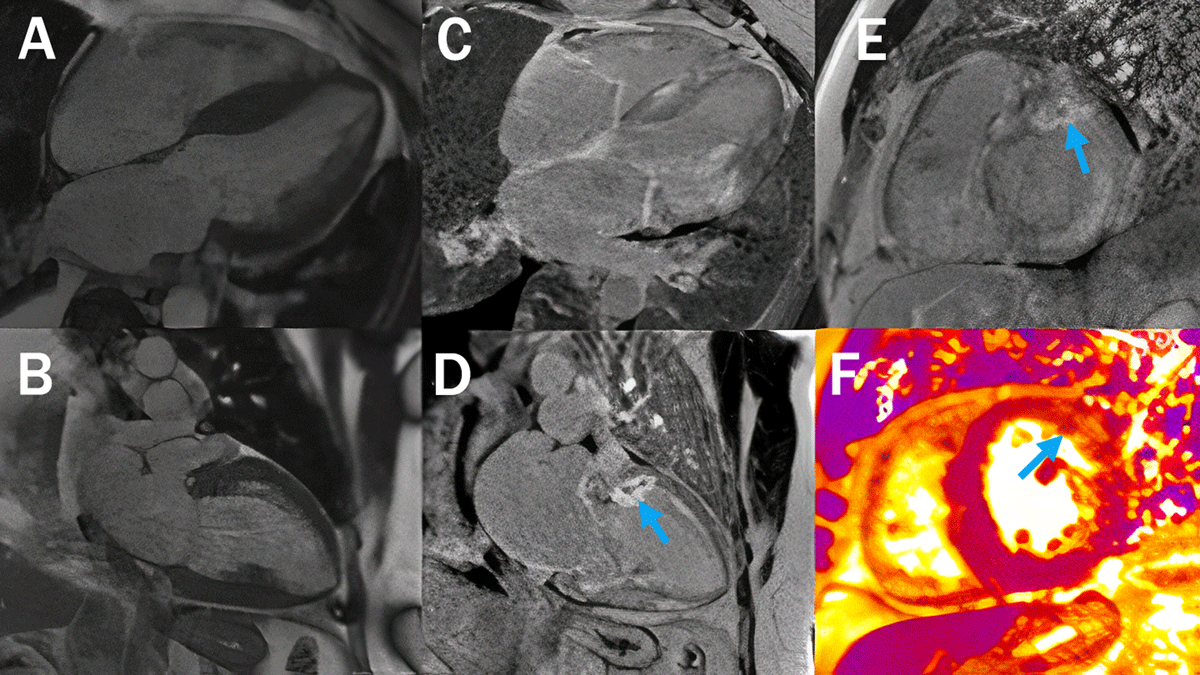
Figure 2
Cardiovascular magnetic resonance imaging showed (A, B) diffusely increased left ventricular wall thickness with (C–E) diffuse patchy late gadolinium enhancement (LGE) in the left ventricle and both atria consistent with cardiac amyloidosis. (D, E, arrow) There also is dense focal transmural LGE in the basal anterior and anterolateral wall with microvascular obstruction at its center and myocardial edema noted on T2 mapping images (F, arrow) that suggest acute myocardial infarction in a ramus or diagonal artery distribution. Image enlarged using letsenhance.io.
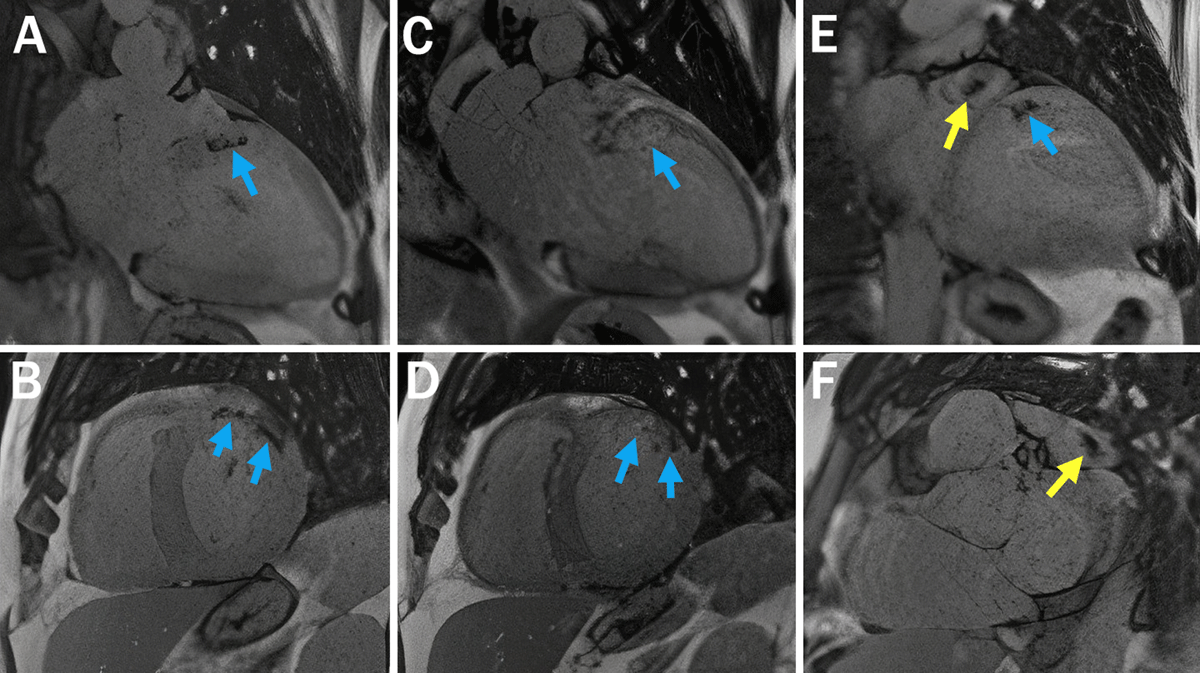
Figure 3
Cardiovascular magnetic resonance imaging with inversion recovery sequence using long inversion time showed area of no contrast uptake at the basal anterior and anterolateral wall (A, B, E, blue arrows) that improved on the similar sequence repeated 30 minutes later (C, D, arrows) consistent with microvascular obstruction. (E, F) Left atrial appendage thrombus (yellow arrow) was also discovered on this sequence. Image enlarged using letsenhance.io.
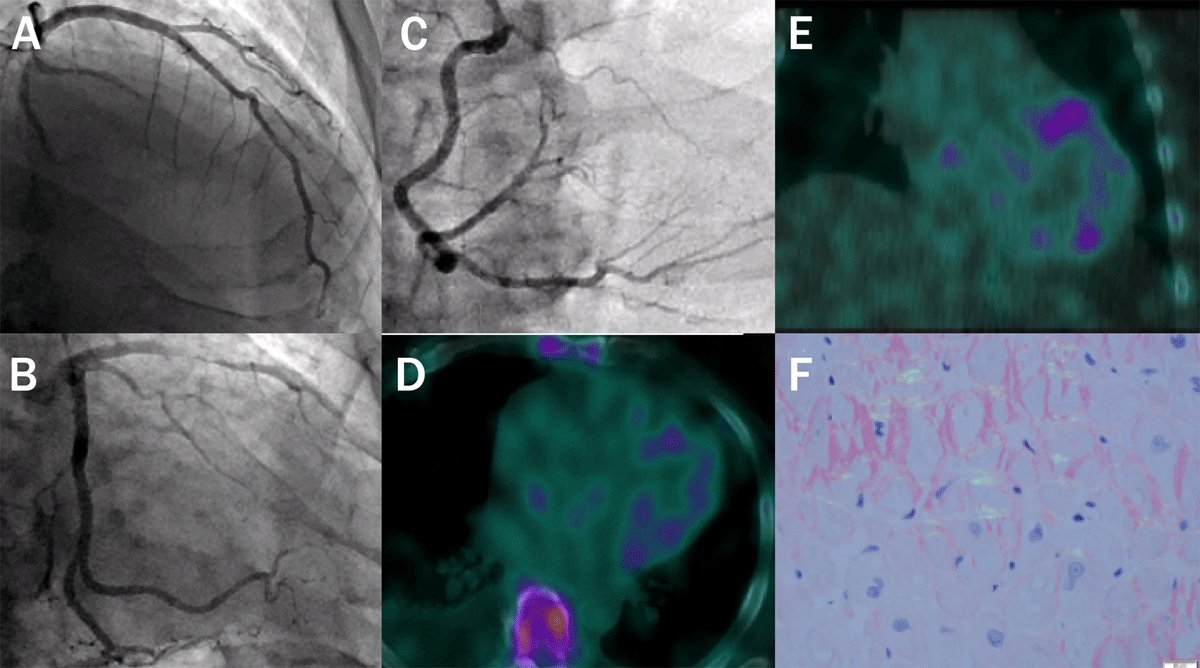
Figure 4
(A–C) Coronary angiography showed patent coronary arteries. (D, E) 99mTechnetium pyrophosphate imaging demonstrated significant (grade 2) myocardial uptake. (F) Endomyocardial histology with Congo red stain under polarized light showed the characteristic “apple green birefringence” that confirmed diagnosis of cardiac amyloidosis.