
Figure 1
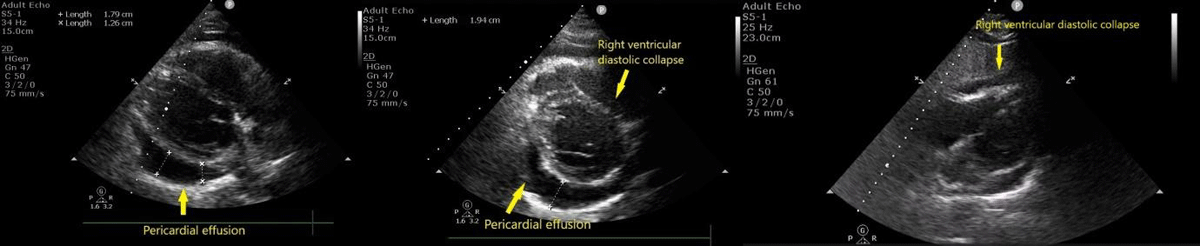
Two-dimensional echocardiographic still images. Left: subcostal view showing global pericardial with right ventricular diastolic collapse. Center: short-axis view showing large global pericardial effusion with right ventricular diastolic collapse. Right: parasternal long-axis view showing global pericardial effusion, more towards the inferior side, marked by arrow.
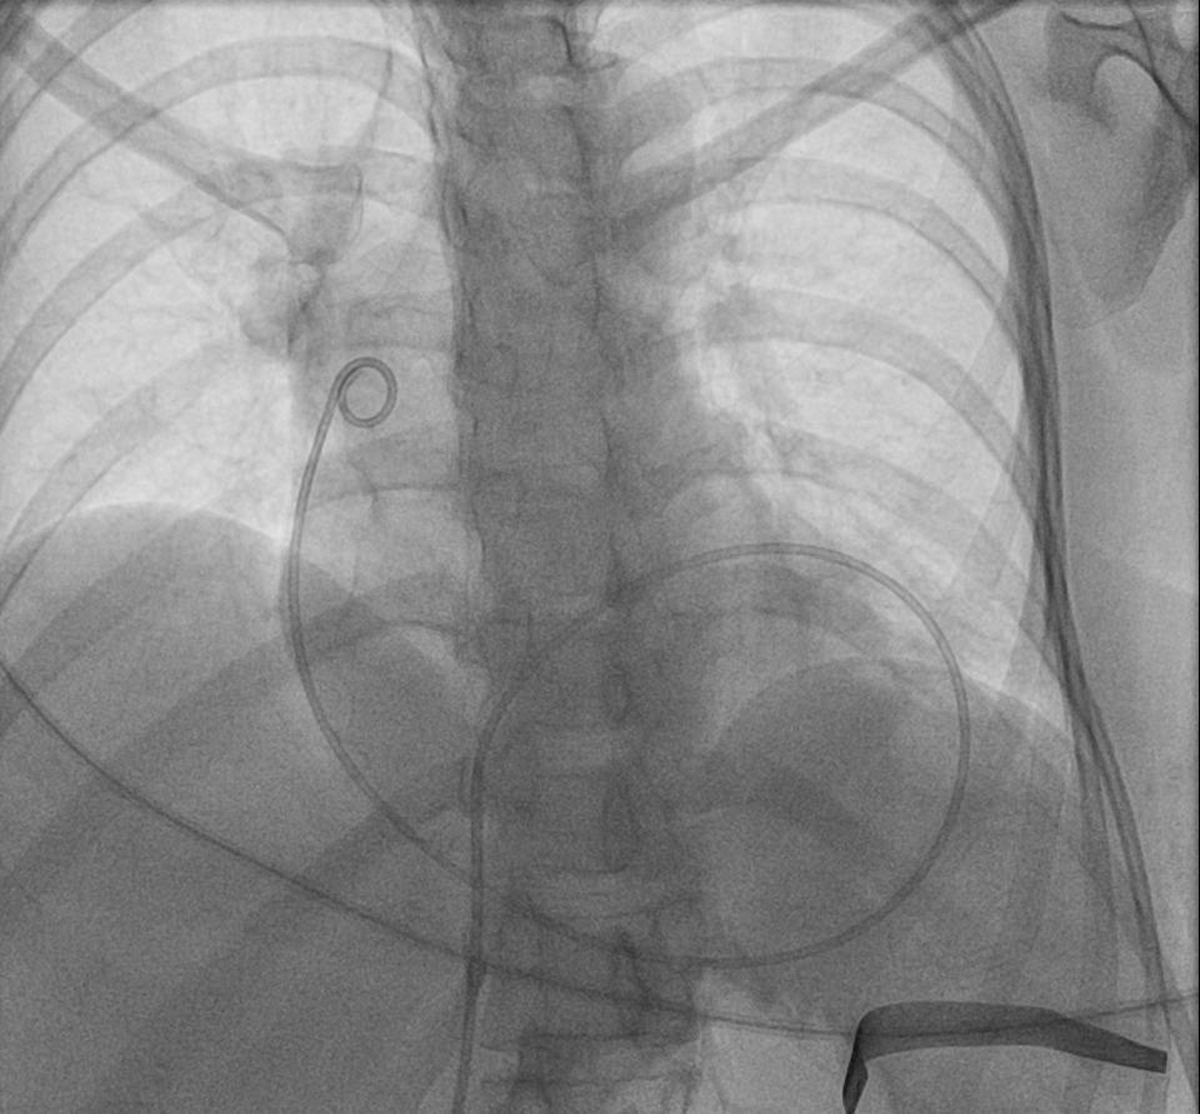
Figure 2
Fluoroscopic image showing pigtail catheter in situ in the pericardial cavity.
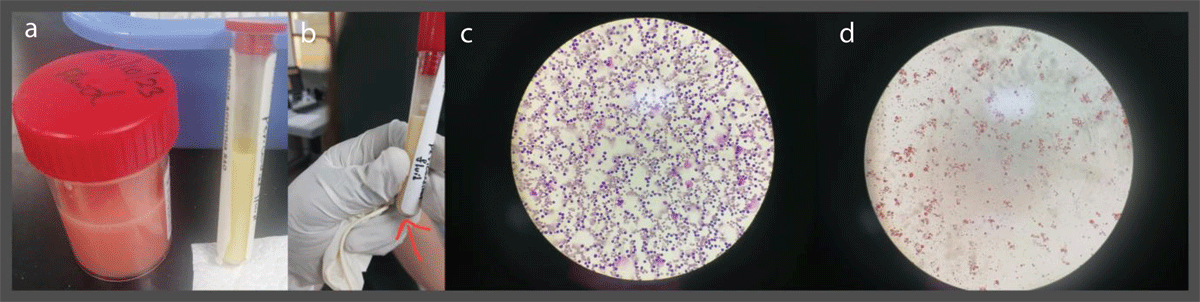
Figure 3
(A) Note pinkish turbid fluid immediately after pericardiocentesis (B) showing settling of red blood cells after centrifugation, leaving milky white turbid fluid with classical appearance of chyle; (C) lymphocyte predominance on microscopy, and (D) with fat stain of supernatant fluid positive for fat globules.
Table 1
Pericardial fluid analysis. WBC: white blood cell; RBC: red blood cell; AFB: acid-fast bacillus; PCR: polymerase chain reaction
| Total volume | 200 ml |
| Total WBC count | 9000 cells/mm3 |
| Neutrophils | 1% |
| Lymphocytes | 98% |
| Total RBC count | 58000 cells/mm3 |
| Adenosine deaminase | < 10 IU/L |
| Mesothelial cells | 1% |
| Gram stain | Few neutrophils Gram positive Cocci in chains+ |
| AFB* stain | Negative |
| PCR for Tubercule bacilli | Negative |
[i] *Acid fast bacteria
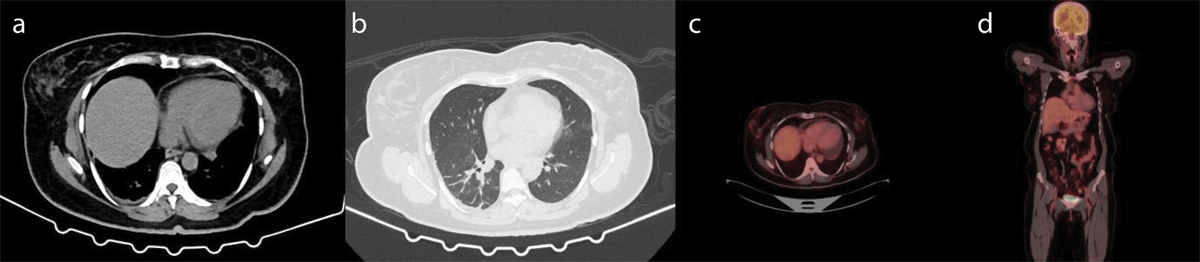
Figure 4
(A,B) Computed tomography (CT) chest shows pericardial effusion with normal lung and other thoracic structures; (C,D) positron emission tomography CT shows pericardial effusion with no active uptake of fluorodeoxyglucose.
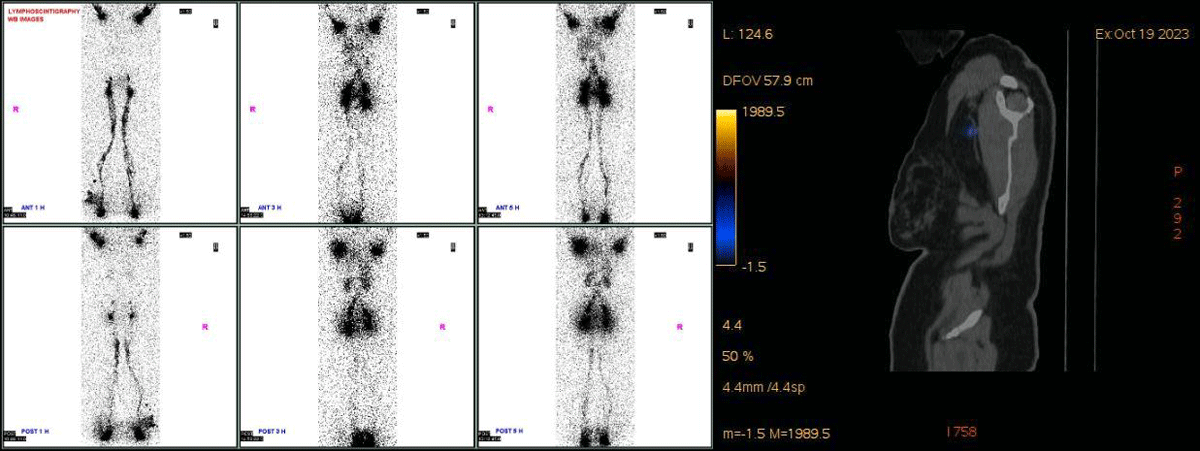
Figure 5
Lymphoscintigraphy shows normal lymphatic flow with normal appearance of thoracic duct.