
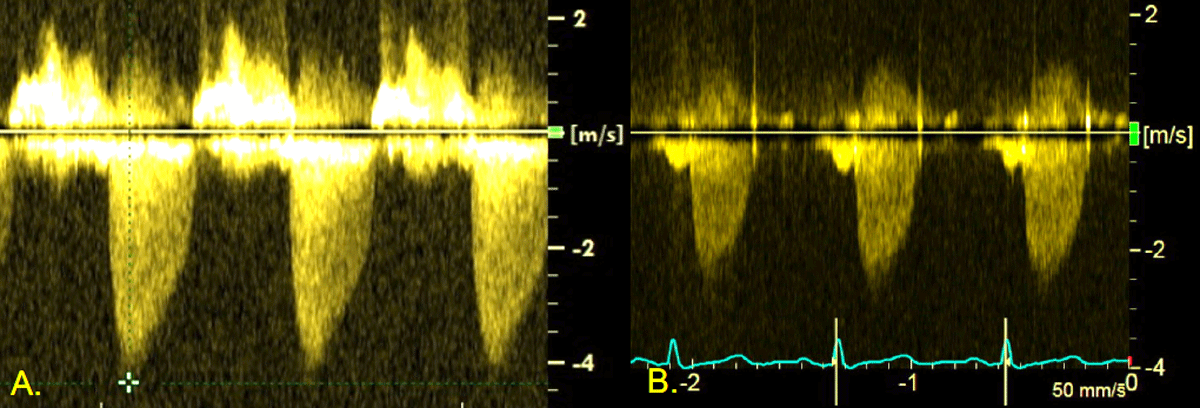
Figure 1
Doppler echocardiography of stenotic aortic valve. (A) Baseline severe aortic stenosis. (B) Follow-up post-procedure echocardiography.
Table 1
Echocardiography results pre- and post-intervention.
| AORTIC VALVE AREA | AORTIC VALVE MAXIMUM VELOCITY | AORTIC VALVE MEAN PEAK GRADIENT | AORTIC VALVE MAXIMUM PEAK GRADIENT | |
|---|---|---|---|---|
| Baseline | 0.7 cm2 | 4.2 m/s | 47 mm Hg | 81 mm Hg |
| Post PDA closure | 1.0 cm2 | 2.7 m/s | 18 mm Hg | 30 mm Hg |
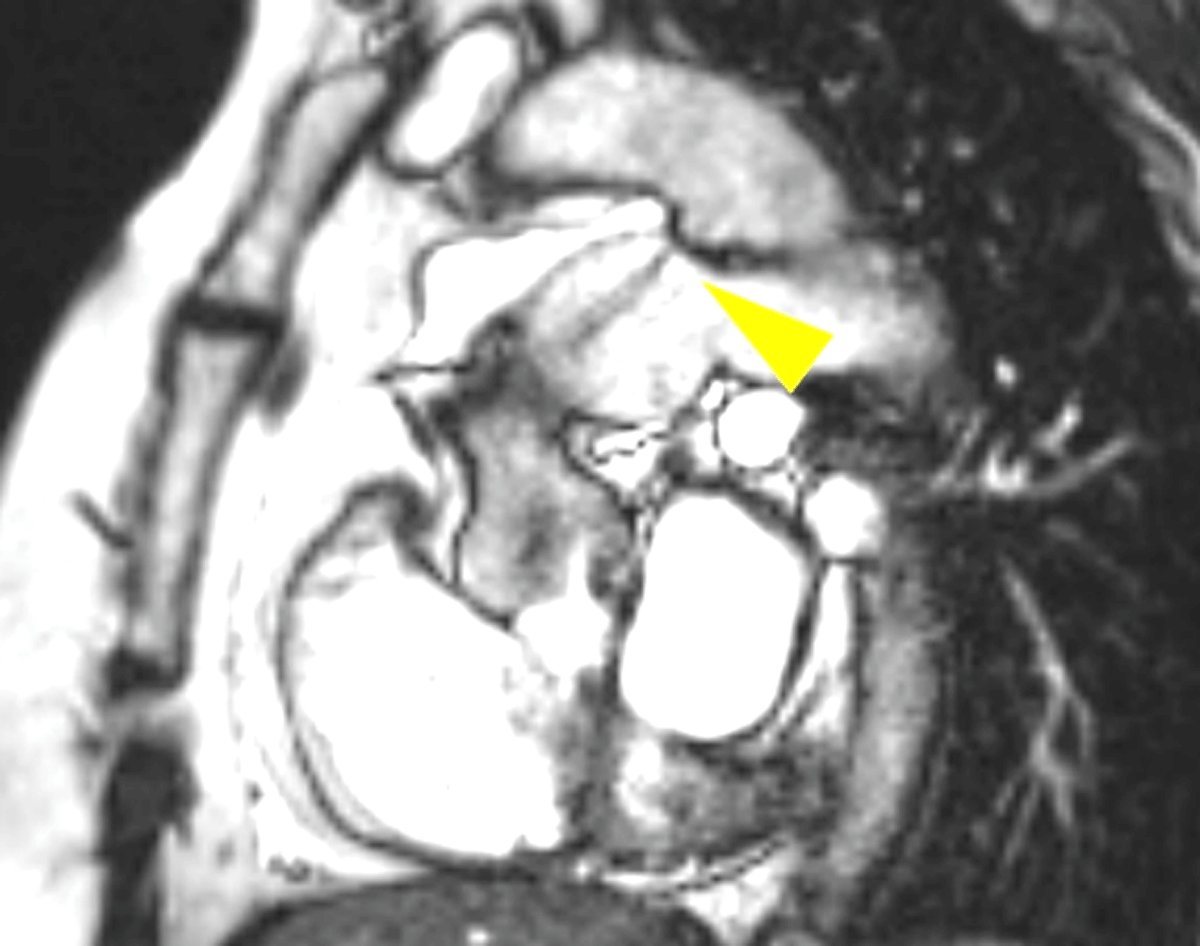
Figure 2
Cardiac magnetic resonance imaging showing patent ductus arteriosus with left-to-right shunting. Yellow triangle indicates flow jet from the aorta to the pulmonary artery.
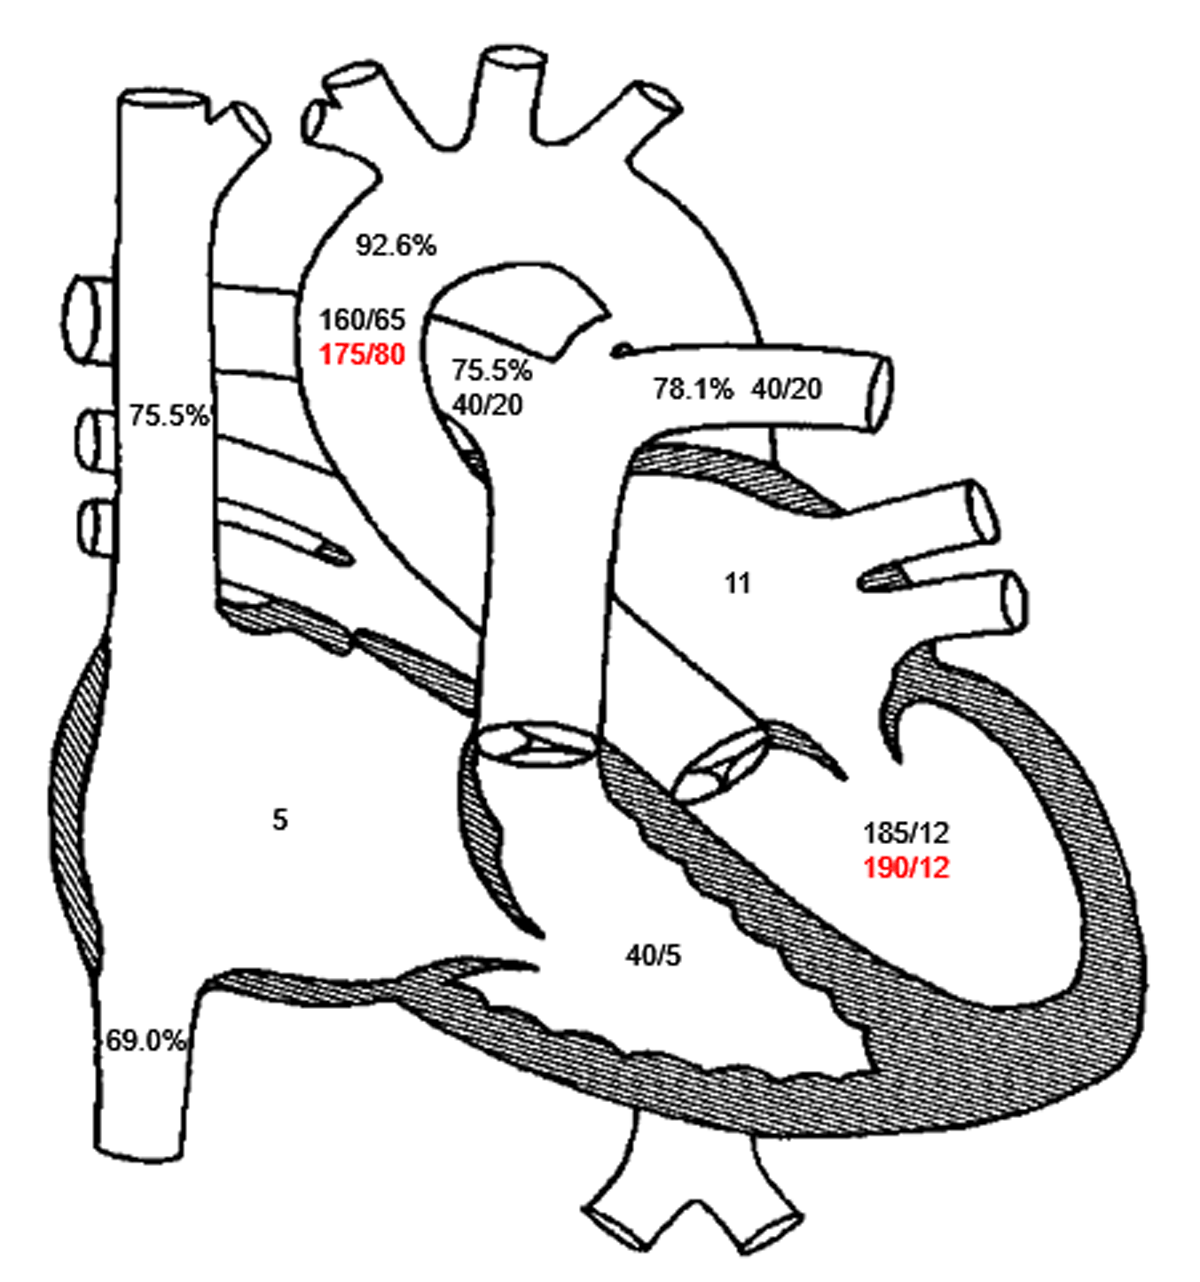
Figure 3
Invasive hemodynamics. oximetry and invasive hemodynamics, with baseline readings in black and post-closure readings in red.
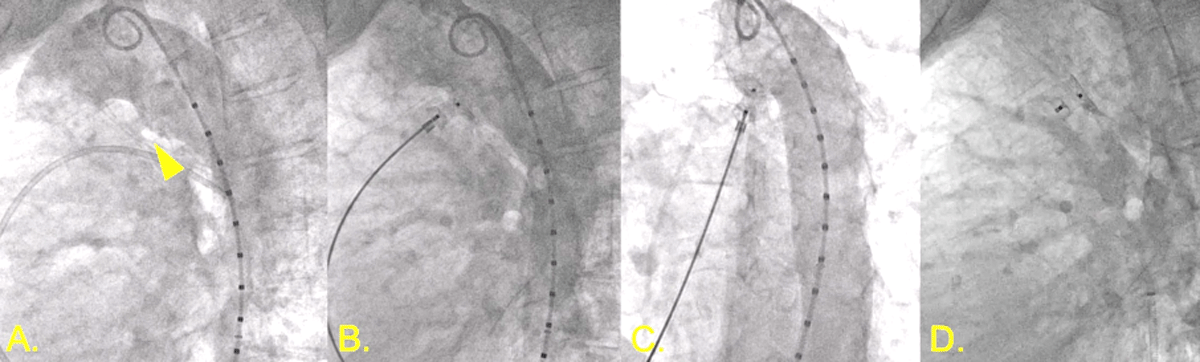
Figure 4
Patent ductus arteriosus (PDA) closure. (A) Angiography demonstrating 5.5 mm calcified PDA (triangle). (B,C) Amplatzer 10-8 occluder with aortic disc in descending aorta with aortography demonstrating no further shunting. (D) Stable position of PDA occludes device following release.
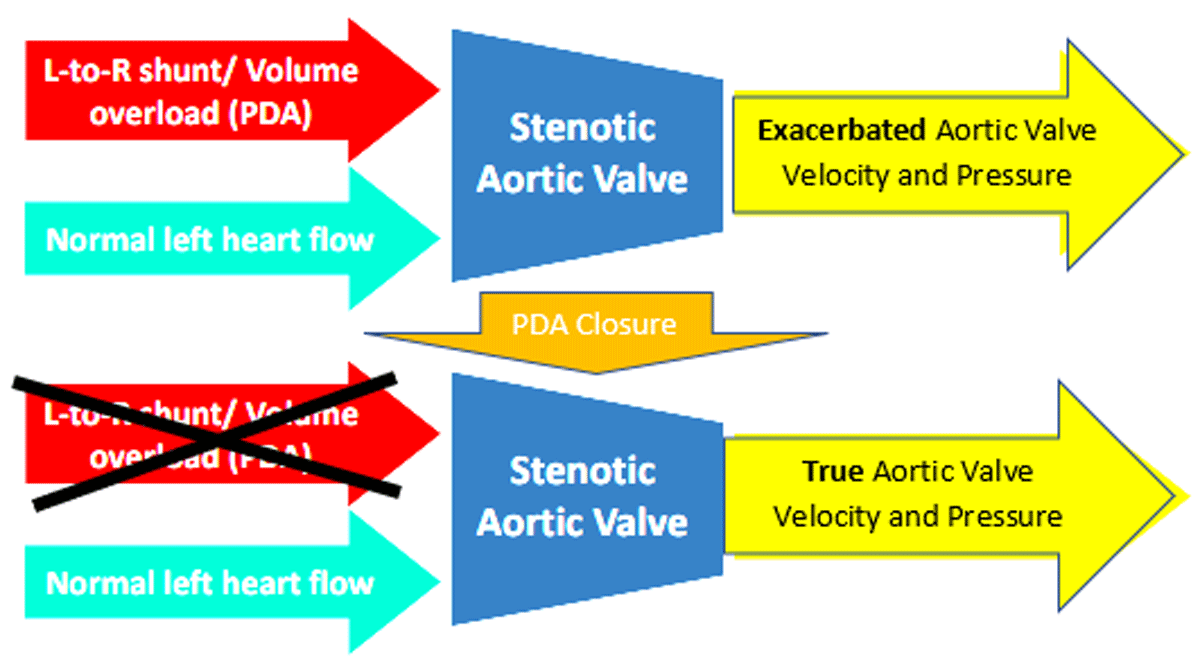
Figure 5
Diagram demonstrating impact of patent ductus arteriosus (PDA) closure. Prior to PDA closure, the left-to-right shunt, resulting in increased volume through the stenotic aortic valve, exacerbated the aortic valve velocity and pressure. Once the PDA is closed, the true aortic valve velocity and pressure are measured.