
Introduction
An intricate connection between the health of air, water, and the external environment has been recognized by ancient Indian, Greek, and Roman civilizations. At the height of the Roman Empire (Pax Romana, BCE 100 and CE 100), industrial activities such as smelting metal and increasing urbanization resulted in severe air pollution. Ancient Romans referred to their city’s smoke cloud as gravioris caeli (“heavy heaven”) and infamis aer (“infamous air”). In the first modern environmental act, King Edward of England in 1278 announced the “Smoke Abatement Act” prohibiting use of coal as it was considered “prejudicial to health.” During the Industrial Revolution, a massive increase in the use of fossil fuel resulted in many air pollution disasters, eventually precipitating regulatory action that is the basis of modern environmental law in many countries. In the early 1990s, advances in remote sensing in satellites and the visualization of large plumes of air pollution traversing oceans established air pollution as a planetary issue. Air pollution and climate change not only share common precipitants (ie, fossil fuel utilization) but also have a complex, bidirectional relationship.1 Fossil fuel sources contribute not only to greenhouse gas emissions but also to adverse health effects, while climate change may lead to increases in particulate matter and ground-level ozone, such as from wildfires, which are on the rise from global warming.1,2 In this review, we summarize epidemiologic evidence that associates air pollution with cardiovascular health, the mechanisms by which air pollution affects cardiovascular health, and how the complex interactions with other exposures and individual characteristics may modify these associations. Finally, we discuss new integrated approaches to capture risk from air pollution in this complicated exposomic framework, and we highlight potential policy implications.
Global Health Impact of Air Pollution
Over 90% of the global population live in areas where PM2.5 (fine particulate matter) exposure exceeds WHO-recommended thresholds of < 5 µg/m3 annually (Figure 1A).3,4 Air pollution is responsible for more than 6 million deaths per year, although recent estimates place this number well above 9 million deaths, with an estimated average of 2.9 life-years lost due to this risk factor.3 In 2019, the total economic cost of air pollution exceeded $8 trillion US, surpassing 6.1% of the global annual gross domestic product.5 Over 58% of deaths attributable to air pollution result from cardiovascular causes.3 Pollution-attributed health consequences disproportionately affect heavily populated countries, including China and India.6,7 While PM2.5 levels have gone down dramatically in the United States, decades of progress in reducing PM2.5 have been lost due to increasing wildfires (Figure 1B).8
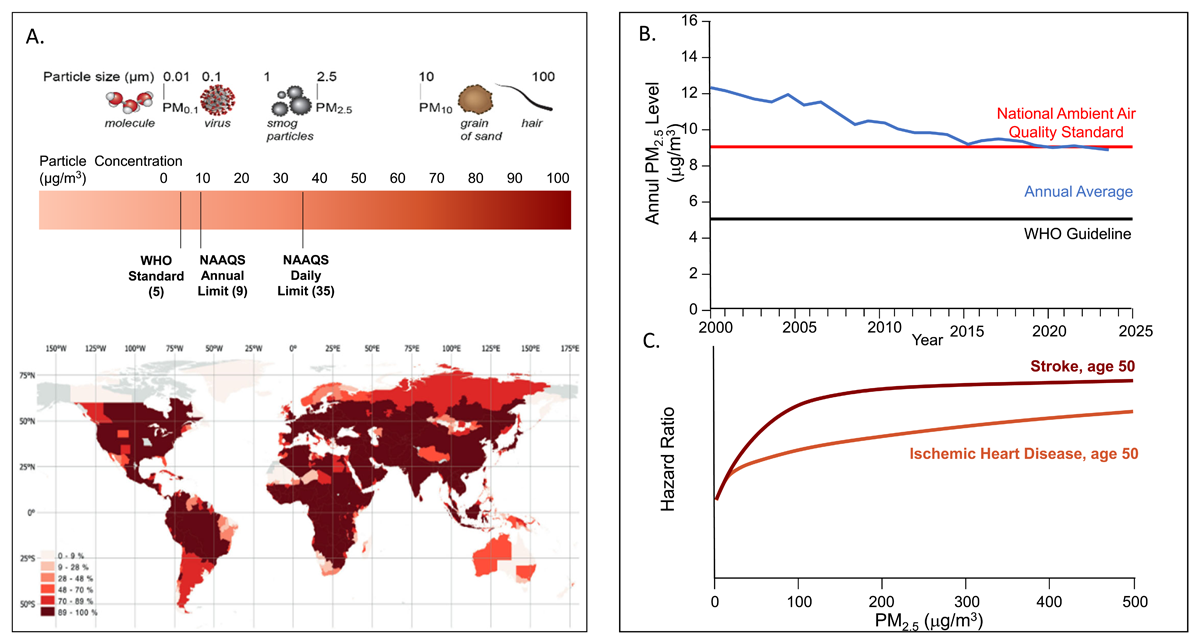
Figure 1
(A) Particulate matter components, sizes, and standards. NAAQS: National Ambient Air Quality Standards; WHO: World Health Organization. Map of percentage of the population exposed to PM2.5 over 5 μg/m across the world. Used with permission from Nat Commun. 2023 Jul 22;14(1):4432.4 (B) Annual average PM2.5 concentrations in the United States with an increase in 2017 and 2018 and subsequent flattening attributable to wildfires. (C) Shape of the exposure–response relationships between PM2.5 air pollution (annual average) and cardiovascular disease across the full range of global exposures, modeled for a 50-year-old person. The response function represents a meta-regressed Bayesian, regularized, trimmed (MR-BRT) curve derived by relaxing the log-linear assumption with the use of cubic splines. Data is derived from Global Burden of Disease. Lancet. 2020 Oct 17;396(10258):1223-1249.
Sources and Dose Response Relationships
The sources of PM2.5 have a major impact on its composition and consequent health impacts. Both natural and anthropogenic sources contribute to air pollution. The US Environmental Protection Agency sets National Ambient Air Quality Standards for six principal criteria air pollutants: nitrogen oxides, sulfur oxides, particulate matter, carbon monoxide, ozone, and lead. Air pollution particles can also be classified into thoracic particles (PM10 - aerodynamic diameter < 10µm), fine particles (PM2.5 - diameter ≤ 2.5µm), and ultrafine particles (UFP or PM0.1 - aerodynamic diameter ≤ 0.1µm) (Figure 1A).9 The toxicity of air pollutant components can be best viewed as a sum effect of features related to chemical composition and size/morphology, such as oxidative stress potential, charge, solubility, surface area, particle count, and lung deposition. Furthermore, atmospheric stability, range, and concentration are also important to consider. There are several studies supporting that transition metals, organic compounds, semi-quinones, and other components of UFP are likely relevant in promoting cardiovascular diseases. In addition, specific characteristics of UFP, such as particle number, high surface area, metal, and organic carbon content, imply that they may pose a particularly high cardiovascular (CV) risk after short-term exposure.10 The CV impact of ozone has been reviewed extensively, with the totality of evidence suggesting an effect on total mortality and chronic obstructive pulmonary disease and much less evidence for direct cardiovascular impact.3,11,12
Biomass burning attributable to forest fires are increasingly common, and recent studies demonstrate that forest fires alone have indelibly set back decades of gains of improved air quality.8 Road dust derived from construction materials, crustal material, tire wear, and general road dust are common fractions of PM2.5 emissions in urban environments. Traffic-related air pollution is rich in volatile organic compounds (VOCs) and gases such as nitrogen oxides (NOx) and primary sulphur oxides. NOx serves as an excellent surrogate for traffic-related exposures; they are highly reactive from vehicular exhaust, power plants, and equipment consuming fossil fuels at high temperatures. Sulfates and nitrates are secondary pollutants that are generated via complex photochemical reactions initiated by intermediate free radicals catalyzed by metals, and they depend on humidity to crystallize. Haze episodes in winter are dominated by elevated concentrations of nitrate and sulphate containing PM2.5.13
The dose-response relationship of PM2.5 to mortality and atherosclerotic cardiovascular disease (ASCVD) is critical in understanding the relationship between concentration levels, dose, and risk. In an exposure-response model (Global Exposure Mortality Model) based exclusively on studies of ambient air pollution, PM2.5 was responsible for a global burden of mortality of 8.9 million deaths, of which greater than 50% were from ischemic heart disease and stroke.14 The shape of the response curve for ischemic heart disease was nearly linear, with little evidence of flattening across current global pollutant levels and no lower concentration threshold below which exposures could be considered safe at the population level (Figure 1C).14
The Epidemiology of Cardiovascular Kidney and Metabolic Syndrome Due to Air Pollution
A substantial body of epidemiologic evidence supports an association between air pollution (primarily PM2.5) and cardiovascular kidney and metabolic (CKM). Prior comprehensive reviews of both short- and long-term exposure to PM2.5 have shown increases in cardiovascular mortality, myocardial infarction, and heart failure hospitalizations,1,3,15 and PM2.5 is associated with an increased risk for myocardial infarction, heart failure, stroke, and CV mortality. Indeed, time-series and case crossover studies of short-term daily elevations (< 35 µg/m3) have shown a 0.25% to 1% elevation in risk for CV mortality per every 10 µg/m3 of PM2.5.16,17 At daily levels > 35 µg/m3, common estimates in China and India, these estimates are higher as confirmed in a recent meta-analysis.6 More robust estimates are seen in chronic studies, with effect estimates ranging from 15% to 31% per 10 µg/m3 of PM2.5 for ischemic heart disease deaths.18,19,20 Both time series and case crossover studies have shown an association between PM2.5 exposure and the risk of nonfatal MI.21,22,23 In a meta-analysis of 80 studies, there was a 1% increase in stroke per 10 mg/m3 increment of short-term PM2.5 exposure and a 14% increase with chronic exposure. Associations were strongest for ischemic and hemorrhagic stroke.24 Heart failure hospitalizations and death have also been well associated with a 2.12% increase after short-term exposure to 10 mg/m3 (95% CI, 1.42-2.82).25 Studies on the impact of long-term exposure to PM2.5 and peripheral artery disease are scarce.26 In a population-based study in Germany, increases in PM2.5 exposure were associated with an abnormally high or low ankle-brachial index (OR 1.59; 95% CI, 1.01-2.51).27
Prior reviews and meta-analyses have focused on air pollution impact on insulin resistance and diabetes mellitus (DM). Investigators from the Global Burden of Disease (GBD) study found that 20% of all diabetes-related deaths and disability-adjusted life years (DALYs) globally were attributed to PM2.5 (approximately 13.5% ambient and 6.5% household air pollution).28 The dose response relationship of DM with PM2.5 was curvilinear, with a strong association at lower PM2.5 levels and a flattening at levels > 50 μg/m3 (HR approximately 1.5-1.7). The presence of obesity may modify the risk of PM2.5 with DM.29 In a meta-analysis to estimate the effects of childhood exposure to air pollutants, obesity and body mass index (BMI) were both associated with PM10, PM2.5, and PM0.1. The strongest association was with PM2.5 (OR 1.28 for weight; 95% CI, 1.13-1.45; OR 0.11 for BMI; CI, 0.05-0.17, per 10 μg/m3 increment in exposure).30 Longitudinal studies have been largely negative at lower annual PM2.5 concentrations in countries in Europe and North America (median ≤ 20 μg/m3).31,32,33
Air pollution increases the risk for hypertension. A meta-analysis of 41 studies involving a range of global pollution levels showed a 0.62-mm Hg increase in systolic blood pressure and a 0.31-mm Hg increase in diastolic blood pressure for every 10 mg/m3.34 The estimates were higher for smaller particles (PM0.1).34 While PM2.5 increases the risk for hypertension, it is important to consider the continuous effect on air pollution blood pressure to accurately characterize the full extent of the population health impact. A recent analysis that quantified the impact of blood pressure changes to elevations in PM2.5 above the WHO limit of 5 mg/m3 observed that average worldwide systolic and diastolic BP elevations of 2.4-mm Hg and 1.2-mm Hg, respectively, can be attributable to PM2.5. There were major differences in estimated excess blood pressure levels by world bank regions, with India demonstrating some of the highest increases in systolic blood pressure of 4.9 mm Hg attributable to PM2.5.34 Although there is some data suggesting that UFP’s may exert potent cardiovascular effects, the epidemiology of UFPs continues to evolve. One challenge is the accurate quantification and characterization of these particles.35,36
Emerging evidence suggests that PM2.5 is associated with chronic kidney disease (CKD).37 In a cohort study of > 2.4 million US veterans with median 8.5 years of follow-up, a 10 μg/m3 increase in PM2.5 was associated with increased odds of developing diabetes and CKD. Diabetes accounted for 4.7% (4.3-5.7%) of the association of PM2.5, with incident estimated glomerular filtration rate (eGFR) < 60 mL/min/1.73m2, 4.8% (4.2-5.8%) with incident CKD, 5.8% (5.0-7.0%) with ≥ 30% decline in eGFR, and 17.0% (13.1-20.4%) with end stage renal disease or ≥ 50% decline in eGFR.38 Only a few studies thus far have linked retinopathy and nonalcoholic fatty liver disease with PM2.5 exposure.37
Mechanisms of Air Pollution Mediated Cardiovascular Kidney and Metabolic Disease
Studies have shown that several distinct yet interrelated processes mediate the cardiovascular effects of PM2.5 and UFP. There is substantial overlap in mechanisms by which PM2.5 mediates ASCVD and other conventional risk factors as covered in prior extensive reviews.39 Time series and case crossover studies attest to the close relationship between acute variation in PM2.5 and ASCVD events and support evidence that PM2.5 plays a potential etiologic role.39,40 Chronic exposure to air pollution may mediate progression of ASCVD, as has been demonstrated in prior surrogate studies, and importantly could amplify multiple risk factors—including endothelial dysfunction, increased blood pressure, insulin resistance, and circadian disruption, all of which could play a role in ASCVD progression—and facilitate a “vulnerable” state.15 Biologic variables are known to influence differential susceptibility to air pollution cardiovascular effects. These susceptibility factors include age (> 65 years of age), prior cardiovascular or pulmonary disease, organ transplant recipients, obesity, diabetes, and CKM syndrome.37 Susceptible groups have greater mortality risk with PM2.5 air pollution exposure compared to groups without these demographics.21,41,42,43 Women have also been shown in some studies to have higher risks of developing cardiovascular events from air pollution exposures; whether this is because of higher exposure in the environments (eg, indoor) is not clear.44 In one recent review of over 100 studies, researchers found a stronger association between PM2.5 and CVD morbidity in women compared to men.45 In a separate review and meta-analyses of studies that included 3.6 million ischemic heart disease (IHD) and 1.3 million stroke cases among 63.7 million participants, researchers found a higher level of PM2.5 exposure was associated with an increased risk of IHD in both men and women but with a higher risk of IHD in women.46 There was no significant relative risk of women to men in stroke incidents.46
Cardiovascular risk due to exposure to air pollution has generally been found to be highest in older populations.3,37 One study of nearly 7,000 participants over 10 years found a stronger relationship between annual coronary artery calcium progression and air pollution in participants over 65 years of age compared to those younger than 65.47 A meta-analysis totaling 100,166 participants found the highest air pollution-related cardiovascular risk among the 60+ year-old cohort; the study found that for every 5 µg/m3 increase in long-term PM2.5 exposure, nonfatal acute coronary event risk increased by 13%.48
Air Pollution and Noise Co-Exposure
Recent studies have extensively reviewed the evidence linking noise pollution with cardiovascular events.49 However, at least in urban settings, there is a significant spatial and temporal relationship between air pollution and noise. With its origin from sources such as traffic, industrial processes and construction (areas that have higher levels of air pollution), urban settings are closely associated with higher noise, making it difficult to attribute cardiovascular events to these independent effects alone.50,51 There is generally a strong correlation between traffic-related air pollutants, like black carbon and NO2, and road traffic noise. Both noise and air pollution gradients are influenced by meteorological factors, including daily variations in vertical mixing height, wind speed, and temperature. Wind direction and speed, in particular, can significantly impact traffic pollution levels. Noise intensity also diminishes exponentially as the distance from its source increases.52
In addition, the intensity of noise is also affected by factors such as the speed and traffic load, among others, which may differentially affect noise and traffic-related air pollution.53 Environmental factors such as greenery, road conditions, barriers, and surrounding buildings may also influence noise and road pollution. Many factors may have opposing effects. Rain and wet road surfaces may increase road traffic noise but may decrease ambient air pollution. Several studies have assessed the independent contribution of noise from air pollution and vice versa; indeed, there is evidence to support both depending on the context and study location.51
When assessing the CV health effects of traffic noise and air pollution exposure either alone or in conjunction, a common issue to consider is that regional levels (which impact the regional population) can differ from personal exposure, which may show considerable variation due to different indoor microenvironments (eg, variable indoor sources of air pollution, penetration of outside air indoors) and individual activities (eg, time in traffic and different indoors exposures).
Social Environment and Air Pollution Exposure
A number of socioeconomic factors, such as income, education, employment, access to transportation, housing, recreation, and public amenities, are known to influence air pollution exposure and modulate disproportionate increases in CV and metabolic risk factors and premature CV mortality.54,55 At every income level, diseases caused by pollution disproportionately impact minorities and marginalized communities.56 A review of 37 studies found that economically disadvantaged communities in North America, Asia, and Africa, but less so in Europe, may experience higher levels of air pollution.57 A 2012 analysis of long-term exposures over 6 years in 215 US census tracts found that individuals without a high school education had 6.2% higher PM2.5 exposure concentration than individuals with a college education.58 Similar results were found in studies in New Zealand, Hong Kong, and Ghana.59,60,61 Racial and ethnic minorities and people of lower socioeconomic status face a higher risk of death due to air pollution.41,62,63 Regardless of absolute disparities in exposures to PM2.5 declining between 1981 and 2016, there continue to be relative disparities.64 Black, Asian, and Hispanic populations have more exposure to PM2.5 than their white counterparts in the US. These relative differences in air pollution, for the most part, persist even after accounting for differences in income.65 Similarly, a study comparing weighted exposures of 11 environmental indices with CV impacts found that White populations had consistently more favorable exposure profiles than non-White populations.66 Race is often found to be a modifying variable in the relationship between CVD risk and air pollution.67 The disproportionate exposures faced by racial and ethnic minorities may have their origins, at least in the United States, in historical neighborhood redlining. Individuals residing in redlined areas have been consistently shown to experience higher exposures to air pollutants, noise, light pollution, and subsequently higher associated cardiometabolic risk, especially in patients with preexisting conditions.68,69,70 Redlined communities have low or nonexistent mature tree canopy and higher likelihood of major highways traversing residential neighborhoods, increasing air pollution exposure compared to areas with more favorable ratings.71 Recent data seems to suggest that preferential access to green and blue spaces based on social class and race may not only exist in the United States but also in wealthy cities in Europe with abundant access to social services for all citizens. For example, hazardous air pollution concentrations in the poorest city districts of Oslo, Norway, and its municipality were above levels recommended by the WHO.72 Validated integrated indices such as the Social Vulnerability Index (SVI) use a mix of factors that reflect social circumstances, including living conditions, education, income, and access to services. In a US study, both PM2.5 (β (SE) 7.584 (0.938), P < .001) and SVI scores (β (SE) 0.591 (0.140), P < .001) were independently associated with age-adjusted CV mortality (R2 = 0.341). The association between PM2.5 and CV mortality were stronger among counties with highest SVI (P value for interaction = .012) than in counties with lower SVI scores. Social vulnerability has been found to modify and accentuate the association between ambient air pollution and CKM mortality.40,73,74
Built Environment and Air Pollution Exposure
Many aspects of urban design and land use characteristics may not only influence air pollution exposure but also directly impact cardiometabolic health, including mobility, housing, transport mode, and recreational and natural tree cover.75 A car-centric infrastructure reduces physical activity and simultaneously leads to higher air pollution and noise, increasing cardiovascular morbidity and mortality. Design and transport features—including mixed land use, access to public transport, amenities, and parks—have been associated with more walking, especially walking for transport along with simultaneous reduction in air pollution.76 Additional design and planning decisions may powerfully impact traffic, air quality, greenery and access to services.77 The design modifications in urban environments, while sometimes small, may collectively drive nonlinear benefits in healthcare outcomes and could be an important public health intervention to improve CKM health.78,79,80 Several meta-analyses now suggest an important association between urban greenness and CV and cerebrovascular mortality.81 In a meta-analysis of 23 studies, increased residential greenery (based on satellite-derived indices) was associated with significantly lower systolic and diastolic blood pressure.82 There is a great need to prioritize equity of access to green space as a measure to improve health.83
Mapping Air Pollution with Integrated Tools
It is widely acknowledged that the air pollution and its co-exposures cannot be fully characterized using sparse static networks of monitors.84 While remote monitoring of air pollutants using satellites by aerosol optical depth, chemical transport models, and ensemble approaches to estimate air pollution concentrations across the globe have been transformative for informing global burden, policy decisions, and even individual decision making, accurate estimations of personal exposure are still challenging.84,85 There has been substantial interest in deploying low-cost stationary and portable sensor systems to help provide higher resolution exposure data and to extend spatial and temporal resolution of existing networks.86 While the spatial resolution is a strength, there are several limitations—such as the large variability in performance, cost limitations. and issues regarding calibration and time scale alignment of personal monitors and portable sensors with network data that report hourly or longer averages.87 Their current impact in averting exposure and reducing PM2.5 associated health risk is currently unknown.
Integrating other environmental exposures (social, natural, and built) with air pollution and individual health measures to enhance population health has the potential to not only identify individuals and communities at risk for climate-sensitive health outcomes but also to allow integration of climate hazards and variables such as temperature into health impact assessments.84,85 Such an approach could allow for the quantification of global residual environmental or “exposomic” risk.86 The use of geographic information systems mapping to integrate exposures, vulnerability, and background risk factors is critical to health impact assessment. Most current tools are available at the census tract level and aggregate exposures at this level. These include tools such as The Environmental Justice Screening Method from the California Air Resources Board, the California Communities Environmental Health Screening Tool developed by the California Office of Environmental Health Hazard Assessment, and the Biden Justice 40 framework that is focused on directing funding from Inflation Reduction Act to disadvantaged communities overburdened by pollution.87,88,89
Mitigation Approaches
Governments play a key role in prevention by passing legislation, enforcing pollution control standards, and creating incentives for reducing pollution. Creating premiums for pollution in terms of the “polluter-pays” principle in all pollution prevention programs is key and may take the form of carbon credits, but this alone cannot be the solution.28 Legally mandated pollution control programs are highly effective, with almost all studies demonstrating a significant return on investment. The economic benefits of these pollution control programs reflect health care cost savings and the increased economic productivity of healthier, longer-living populations.28 Some critical steps that will have a large impact on reducing the burden of type-2 diabetes worldwide is ensuring policies that endorse transitions to clean energy, enforcing pollution control standards, and incentives for transitions to net zero emissions.90 Encouraging clean energy public transportation along with active transportation, like walking and biking, can not only decrease air pollution but also enhance health. Urban redesign using low-carbon construction materials, green infrastructure, and walking paths can promote physical activity while lowering the carbon footprint and reducing pollution from the production, transport, and disposal of building materials.90,2
The American Heart Association’s guidelines on personal protective measures consider individual vulnerability and offer a helpful framework for people at high risk of health issues caused by air pollution. Portable air cleaners (PACs) are an affordable and practical home solution for these individuals, capable of reducing PM2.5 exposure by up to 60%.91 Several small short-term randomized studies have demonstrated that reducing PM2.5 exposure through PACs can lead to rapid, though modest, improvements in blood pressure and other indicators of cardiometabolic risk.91 Air conditioning systems within homes can be equipped with appropriate in-duct air filters to help reduce indoor air pollution. Cars in environments with heavy air pollution may need frequent changes of cabin filters.
Air pollution alerts are helpful in notifying individuals, especially those that are susceptible, to take needed protective actions, especially in the context of severe air pollution episodes including wildfires. However, we and others have questioned the benefit of personal protection devices in most individuals except for those at the highest risk. We need improved guidance and better evidence to guide individuals at risk.91
Healthcare organizations and nonprofits are in a strong position to advocate for government action in preventing pollution-related cardiovascular disease by encouraging the establishment of clear goals and timelines. Pollution from the US healthcare system results in a disease burden similar to that created by medical errors, largely related to air pollution health effects.92 By mandating that hospitals and healthcare organizations follow sustainability standards, an immediate impact on emissions can be seen together with cost savings that can be leveraged. The inclusion of planetary diets in hospitals will allow much needed alignment of health benefits with planetary goals.93
Conclusion
There is overwhelming evidence highlighting the critical need to address air pollution as a major environmental risk factor for cardiovascular, kidney, and metabolic health. The intricate links between air quality and health outcomes underscore the urgent requirement for comprehensive public health strategies and policy interventions aimed at reducing emissions, particularly from fossil fuel sources. As air pollution disproportionately affects vulnerable populations, careful consideration of socioeconomic factors and environmental justice must be integrated into health initiatives.
Innovative approaches, including the use of advanced monitoring systems and integrated data models, can help characterize exposure levels more accurately and facilitate targeted interventions. Furthermore, community empowerment through education and access to personal protective measures can enhance individual resilience against air pollution’s detrimental effects. Ultimately, collaborative efforts across sectors—health care, urban planning, policy-making, and environmental advocacy—are essential to mitigate the impact of air pollution on CKM syndromes and improve public health outcomes. Sustainable infrastructure, clean energy solutions, and robust environmental regulations can create healthier environments, reduce the burden of disease, and promote well-being for all. Addressing air pollution is not merely a health imperative; it is a crucial step toward a sustainable future.
Key Points
Air pollution, especially PM2.5, impacts over 90% of the global population and causes over 6 million deaths annually, primarily from cardiovascular diseases, costing over $8 trillion.
Epidemiological studies link PM2.5 exposure to higher rates of myocardial infarction, heart failure, and diabetes. Vulnerable populations, especially older adults and those with preexisting conditions, face heightened risks, emphasizing the urgent need for public health interventions.
Air pollution and noise coexposure significantly impact cardiovascular health, particularly in urban settings where sources overlap.
Socioeconomic factors exacerbate the effects of environmental risk factors, disproportionately affecting marginalized communities.
Effective mitigation strategies require government action, urban redesign, and public awareness to address health disparities linked to environmental pollution and improve overall community health.
Funding Information
This study was partly funded by NIH grants (R35ES031702, R01ES019616, and R01HL141846).
Competing Interests
The authors have no competing interests to declare.