
Table 1
Overview of urban greenery and walkability.
| URBAN GREENERY | WALKABILITY | |
|---|---|---|
| Definitions | The incorporation of vegetation, trees, urban parks, residential vegetation, and green infrastructure into urban design, promoting ecological benefits, and enhancing aesthetic appeal | The extent of friendliness the built environment of a neighborhood is to walking, considering factors such as sidewalk quality, pedestrian safety, traffic density, and access to amenities |
| Measures | Normalized difference vegetative index (NDVI), green view index (GVI), natural space index (NSI), recreational amenity index (RAI), population weighted greenness value, enhanced vegetation index (EVI), and nature scores | Walk score |
| Associations with cardiovascular (CV) health | Positive relationship between greenspace and cardiovascular (CV) outcomes including reducing CV disease risks, CV disease morbidity, and CV mortality | Walkability has shown associations with lower risks of hypertension, arterial stiffness, and major CV disease events |
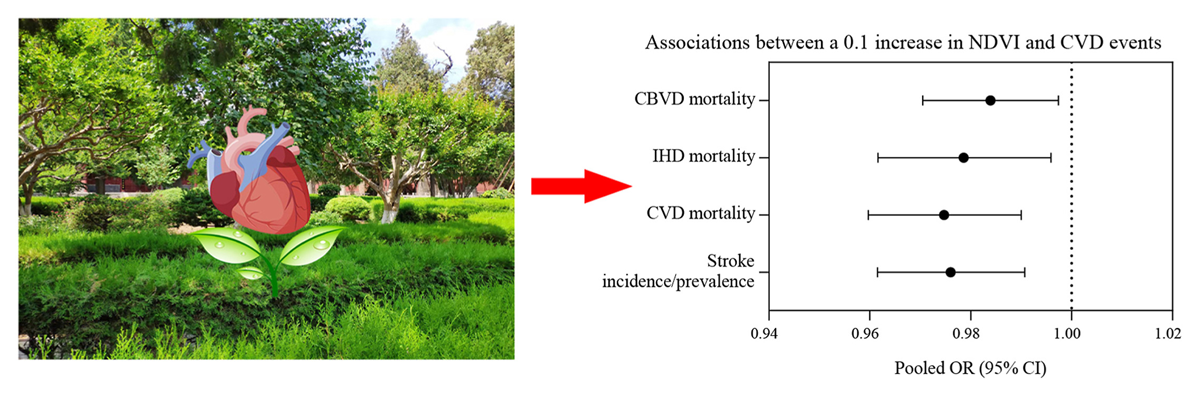
Figure 1
Association between normalized difference vegetative index (NDVI) and cardiovascular disease (CVD) events. Adapted from Liu et al. (2022) with permission from the publisher. Copyright from © 2022 Elsevier.
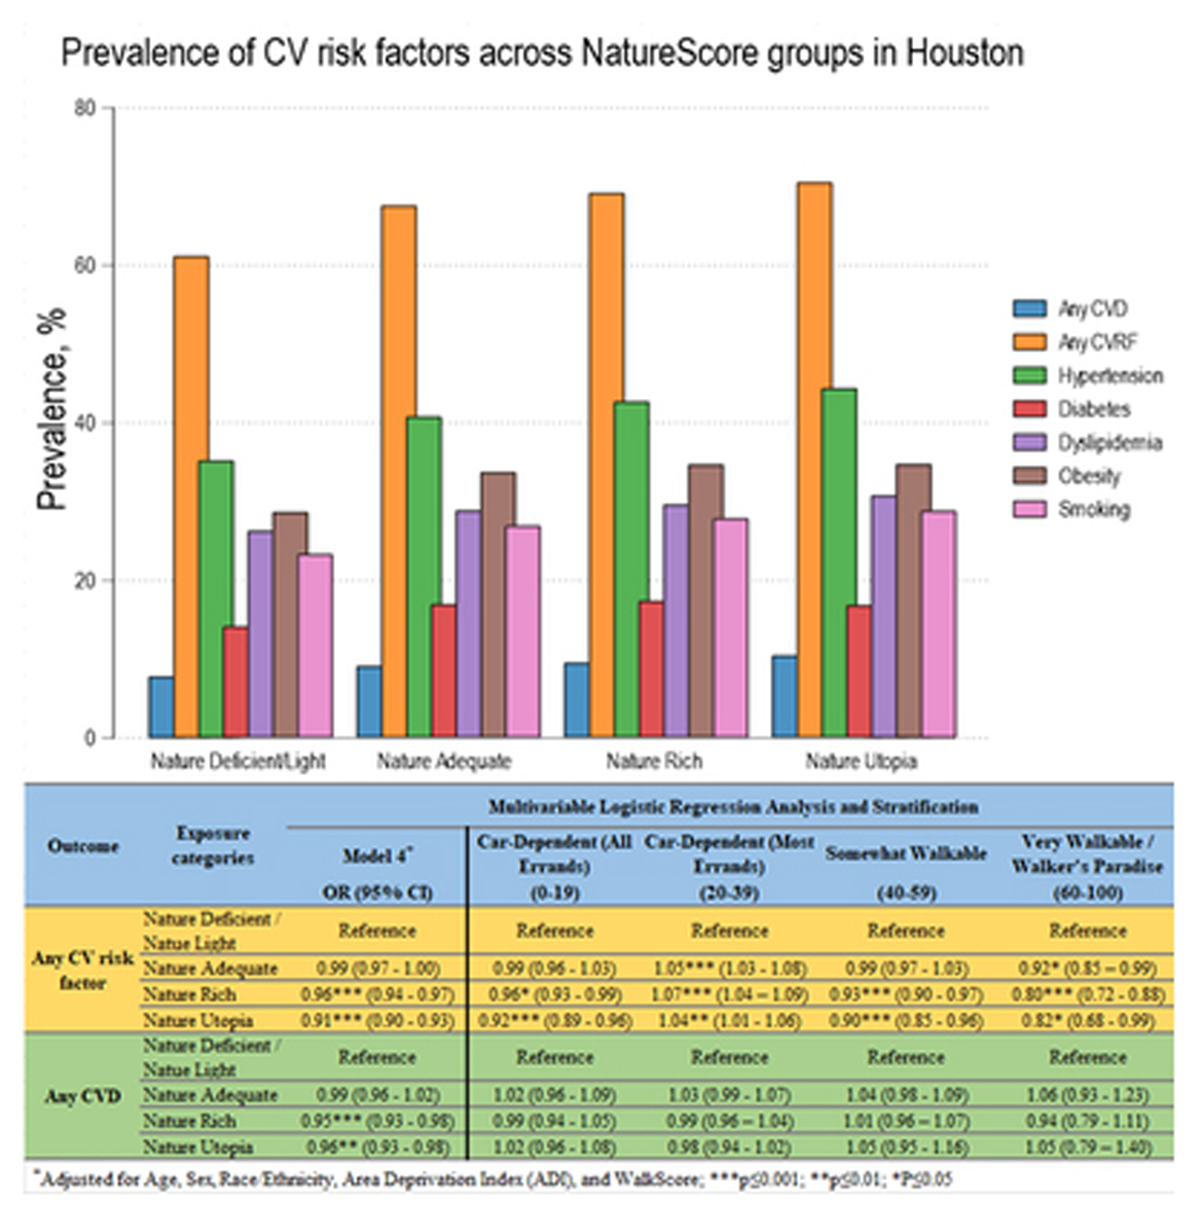
Figure 2
Prevalence of cardiovascular risk factors across NatureScore groups in Houston. Adapted from Makram et al. (2023) with permission from the publisher. Copyright © 2023, Wolters Kluwer Health.
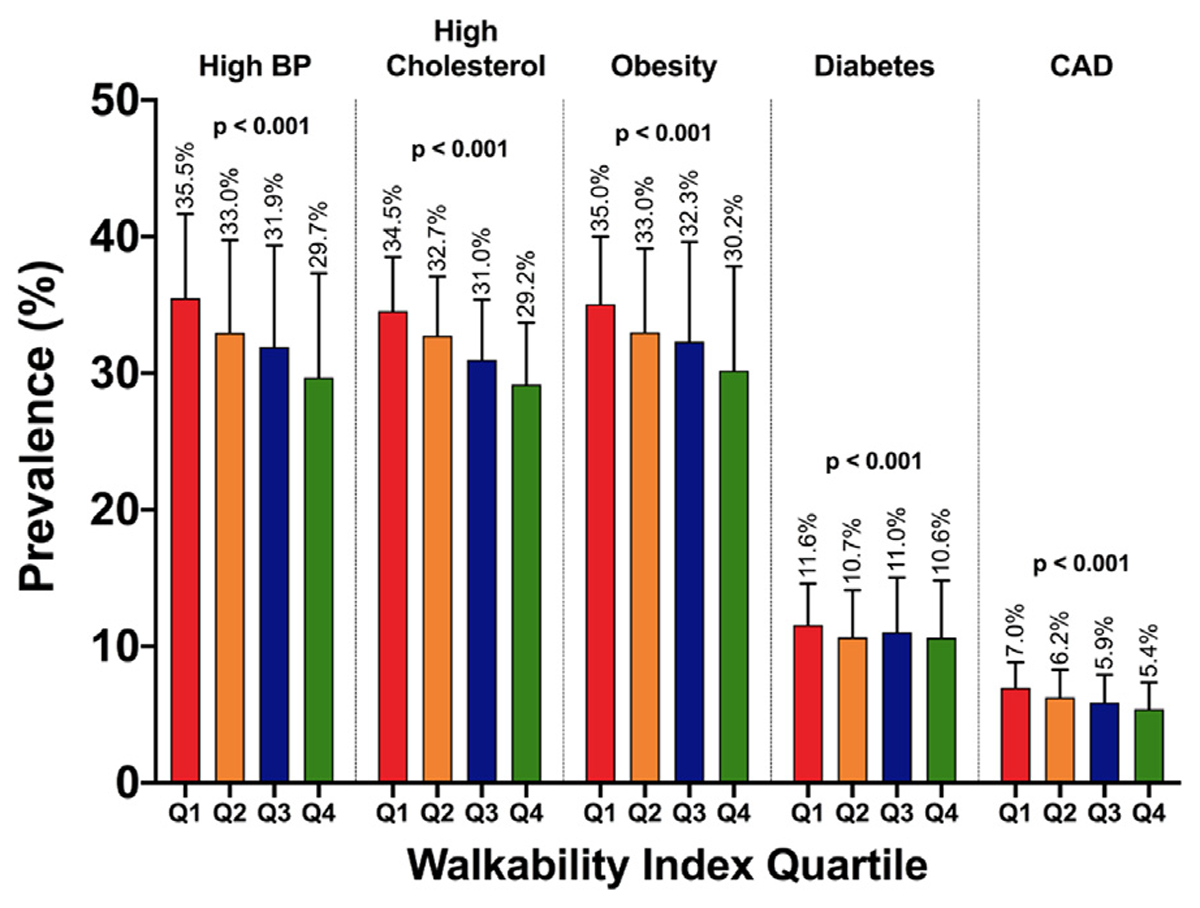
Figure 3
Mean prevalence of cardiovascular health outcomes and risk factors according to quartile of walkability index. Adapted from Makhlouf et al. (2022) with permission from the publisher. Copyright © 2022 Elsevier Inc. BP: blood pressure; CAD: coronary artery disease. Error bars represent standard deviations. P values are from ANOVA tests