
Table 1
Overview of imaging modalities and biomarkers to predict reverse remodeling. CMR: cardiac magnetic resonance; GLS: global longitudinal strain; LA: left atrial; LGE: late gadolinium enhancement; LV: left ventricular; LVEDV: left ventricular end diastolic volume; LVEF: left ventricular ejection fraction; LVESV: left ventricular end systolic volume; NT-proBNP: N-terminal pro-B-type natriuretic peptide; ST2: suppression of tumorigenicity 2; RR: reverse remodeling
| MARKER | (PATHO)PHYSIOLOGY | PREDICTOR |
|---|---|---|
| Imaging modalities | ||
| Echocardiography | ||
| LV GLS | Deformation characteristics of the myocardium; limit dependence on LV volumes | GLS ≤ 16%: increased risk for decrease in LVEF during follow-up |
| LA GLS | Increased LV filling pressures are transmitted backwards and will lead to LA enlargement, dysfunction | LA GLS > 10.8%; increased incidence of RR |
| Myocardial work quantification | Incorporation of strain with left ventricular pressure; less loading dependent | Good correlation with fibrosis on CMR. More research necessary |
| Cardiac magnetic resonance | ||
| LGE | Marker to assess the degree of myocardial fibrosis | Low LGE (cut-off < 7-8% of LV mass) and higher degree of myocardial edema; higher incidence of RR No role in follow-up |
| Contractile reserve | Change in LVEF after dobutamine administration | Larger change; higher incidence of RR No correlation with degree of fibrosis |
| Biomarkers | ||
| NT-proBNP | Marker of myocardial stress and stretch |
|
| Troponins | Marker of myocyte injury and necrosis |
|
| Soluble ST2 | Marker of fibrosis and hypertrophy |
|
| Galectin-3 | Marker of macrophage activity, part of fibrosis process | Levels < 20 ng/mL during follow-up; higher incidence of RR No independent predictive value |
| Big endothelin-1 | Marker of vasoconstriction, hypertrophy and fibrosis resulting in adverse remodeling | Lower levels; higher likelihood of RR |
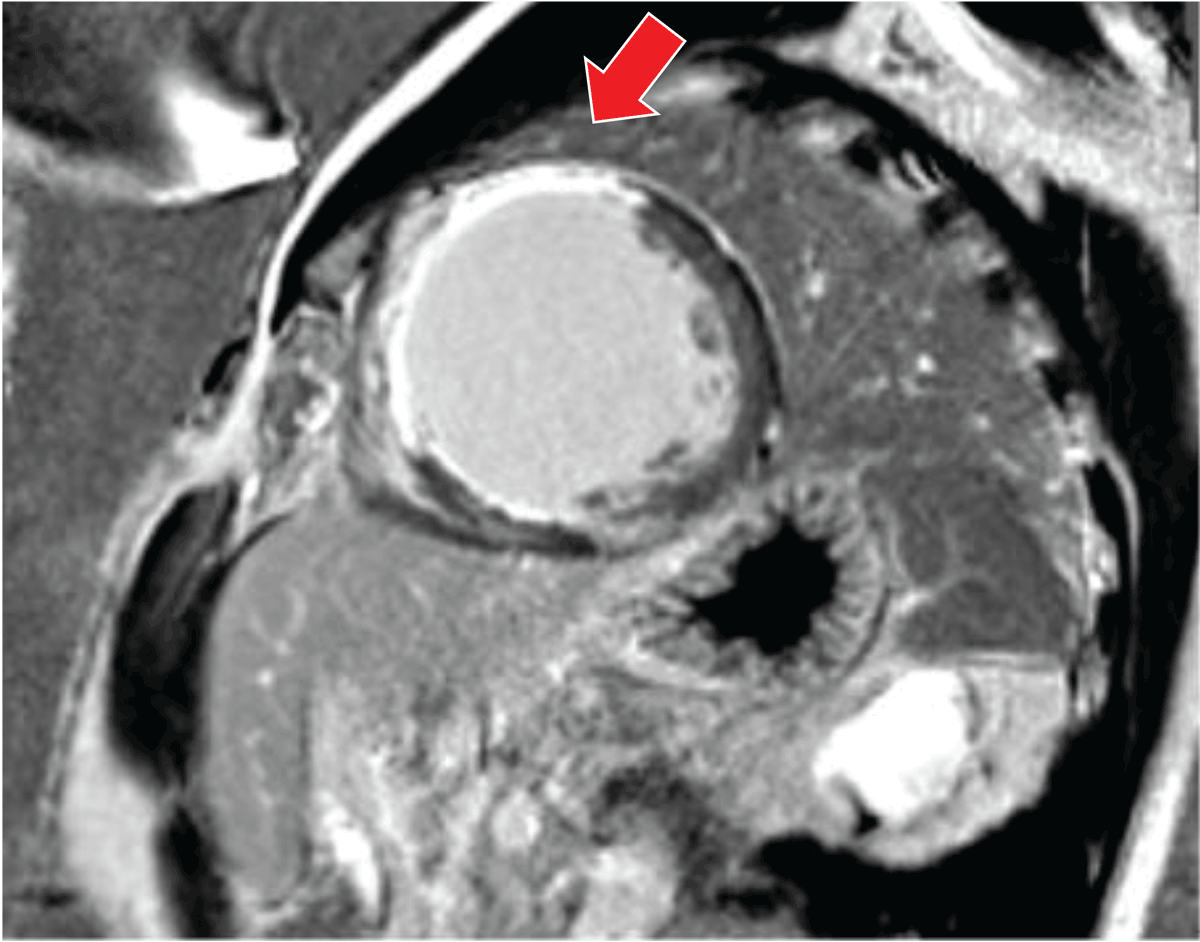
Figure 1
Late gadolinium enhancement on cardiac magnetic resonance. Late gadolinium enhancement (LGE) cardiac magnetic resonance image obtained in a patient with ischemic cardiomyopathy. Severe reduced left ventricular ejection fraction (LVEF 17%) with approximately 40% LGE in the left ventricle. Despite optimal medical therapy, no myocardial recovery was expected. Four years later, due to recurrent sustained ventricular tachycardia, the patient was referred for left ventricular assist device.
Table 2
Highlight of research articles supporting different imaging modalities for the prediction of reverse remodeling. DCMP: dilated cardiomyopathy; LA: left atrial; LGE: late gadolinium enhancement; LVEDD: left ventricular end diastolic dimension; LVEDDi: left ventricular end diastolic dimension index; LVEF: left ventricular ejection fraction; RR: reverse remodeling; GLS: global longitudinal strain; LVESD: left ventricular end-systolic diameter
| AUTHOR, YEAR | STUDY POPULATION | DEFINITION RR | OUTCOME/FINDING |
|---|---|---|---|
| Echocardiography | |||
| Ikeda et al. 201530 | N = 207, DCMP |
| LVEDDi decrease during the first 6 months was predictive for RR later on |
| Adamo et al. 201731 | N = 96, LVEF < 50% |
| Abnormal LV GLS (≤ 16%): predictor for LVEF decrease. Normal LV GLS (> 16%): stable LVEF |
| Swat et al. 201832 | N = 166, DCMP |
| Baseline LV GLS > 8% in patients with LVESD > 43.5 mm associated with RR |
| Jung et al. 20209 | N = 160, DCMP |
| Baseline LV GLS (cut-off 10%) independent predictor RR in sinus rhythm |
| Torii et al. 202113 | N = 100, new onset HF |
| LA strain (cut-off 10.8%) independent predictor for RR |
| CMR | |||
| Kubanek et al. 201328 | N = 44, DCMP |
| Baseline lower extent of LGE and greater myocardial edema ratio are independent predictors of RR |
| Masci et al. 201325 | N = 58, DCMP |
| LGE absence at baseline strong predictor for RR at 2 years follow-up |
| Kida et al. 201323 | N = 31, DCMP |
| LGE absence at baseline strong predictor for RR at 6 months follow-up |
| Ishii et al. 201627 | N = 66, DCMP |
| LGE mass < 8% predicts RR |
| Chimura et al. 201726 | N = 129, DCMP |
| LGE absence and GLS predict independently RR |
| Barison et al. 201821 | N = 71, DCMP |
| LGE absence predicts RR |
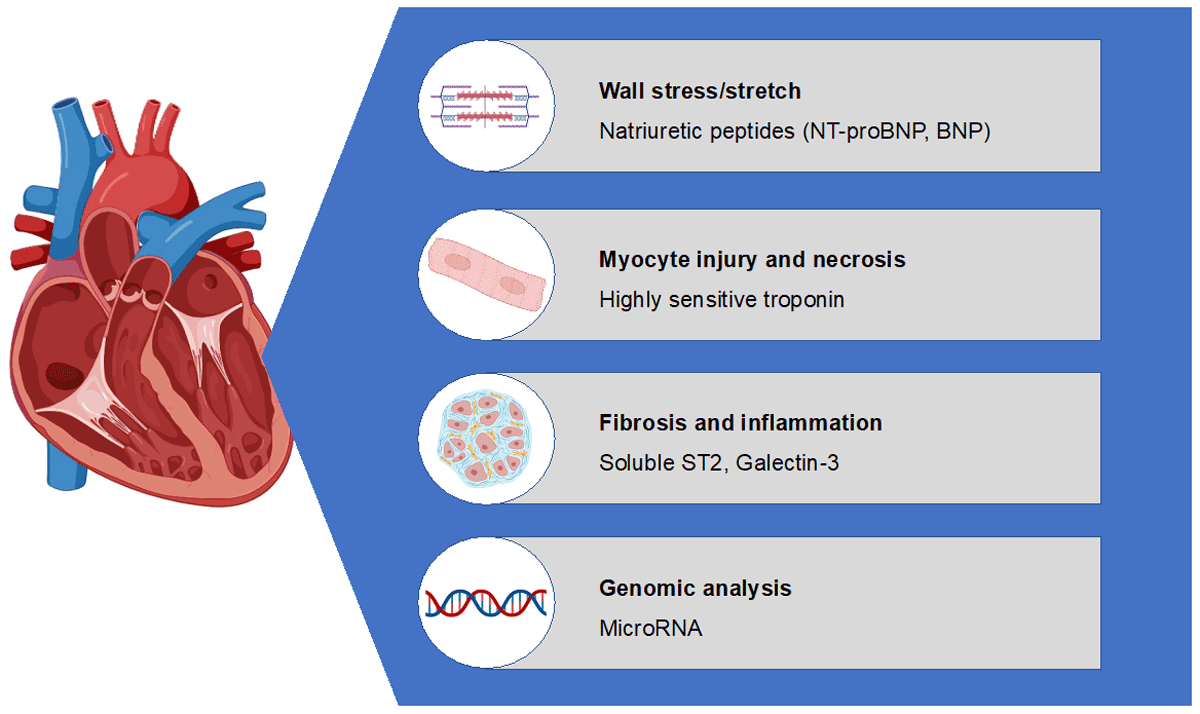
Figure 2
Different biomarkers according to their pathophysiological action.
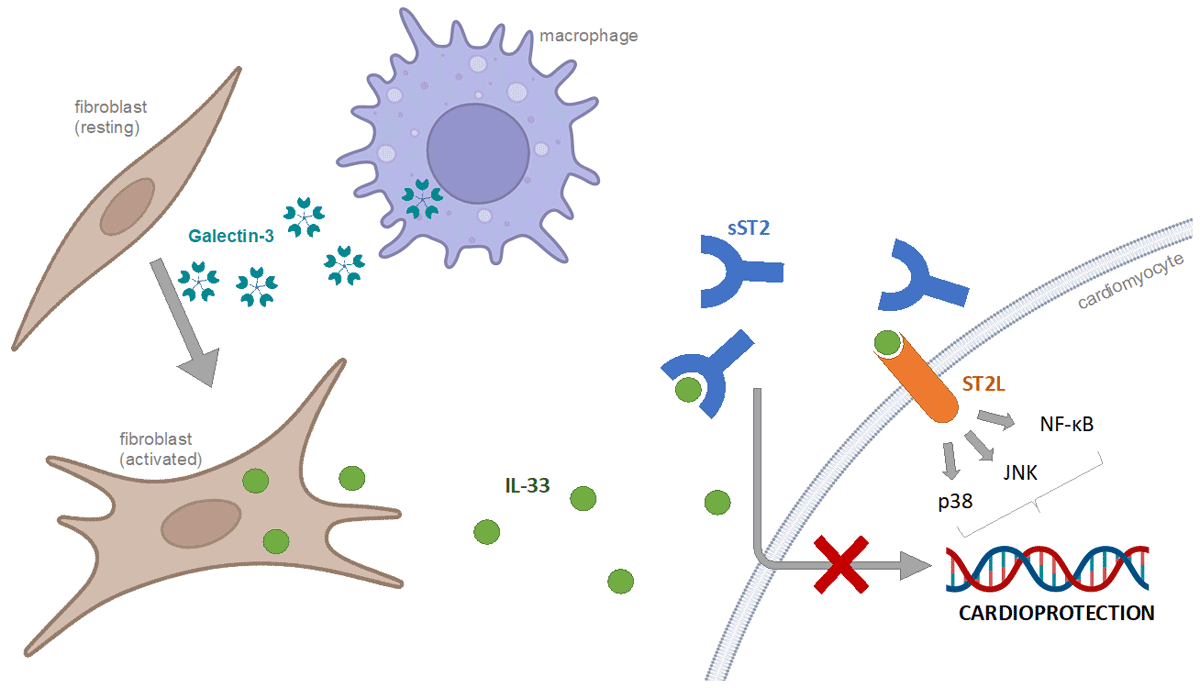
Figure 3
sST2 and galectin-3 as markers of fibrosis. As a response to cardiac damage, macrophage activation results in the production of galectin-3, which leads to fibroblast activation and the release of IL-33. Normally, IL-33 binds to ST2L, by which it initiates an antihypertrophic an antifibrotic pathway. sST2 works as a decoy receptor, preventing the binding of IL-33 to ST2L. IL-33: interleukin-33; sST2: soluble suppression of tumorigenicity 2; ST2L: suppression of tumorigenicity 2 ligand
Table 3
Highlights of research articles supporting different biomarkers for the prediction of reverse remodeling. CHF: chronic heart failure; HFrEF: heart failure with reduced ejection fraction, LV: left ventricle; LVEF: left ventricular ejection fraction, LVEDVi: left ventricular end-diastolic volume index, LVESVi: left ventricular end-systolic volume index; RR: reverse remodeling
| AUTHOR, YEAR | STUDY POPULATION (N) | END POINT | OUTCOME/FINDING |
|---|---|---|---|
| NT-proBNP | |||
| Weiner et al. 201335 | HFrEF (LVEF < 40%) (N = 116) | Improvement in LVEF, LVEDVi, LVESVi | NT-proBNP measurement associated with RR |
| Gaggin et al. 201437 | HFrEF (N = 151) | Clinical outcome | Baseline NT-proBNP predicts clinical outcome |
| Cho et al. 201860 | DCM and AHF | LVEF ≥ 50% | Decrease in NT-proBNP between initial presentation and discharge (> 1633.5 pg/mL), predictor for RR at 6 months |
| Daubert et al. 201961 | HFrEF (LVEF ≤ 40%) (N = 268) | Improvements in LVESVi, LVEDVi, EF, | NT-proBNP < 1,000 pg/mL associated with RR |
| Januzzi et al. 201962 | HFrEF (LVEF ≤ 40%) with elevated natriuretic peptides (N = 654) | Improvement in LVEF, LVEDVi, LVESVi | A decrease in NT-proBNP over time is associated with RR |
| Troponin | |||
| Sato et al. 200138 | DCM (N = 60) | Improvement in LVEF, LVDd | TnT levels during follow-up < 0.02 ng/mL are associated with RR |
| Chia et al. 200840 | STEMI (N = 378) | Functional and clinical outcome | TnI at 72 hours > 55 ng/mL was associated with a large infarct size and low LVEF |
| Miller et al. 200963 | CHF (N = 172) | Clinical outcome | Elevated cTnT (> 0.01 ng/mL) are associated with increased risk of events |
| O’Connor et al. 201139 | AHF (N = 288) | Clinical outcome | Positive cTnT (> 0.03 ng/mL) are associated with a worse outcome |
| Felker et al. 201264 | ADHF (N = 808) | Clinical outcome | cTnI above 99% percentile predicts in-hospital outcome |
| Gaggin et al. 201437 | HFrEF (N = 151) | Clinical outcome | Baseline Hs-TnT predicts outcome |
| Felker et al. 201565 | AHF (N = 1074) | Clinical outcome | Hs-cTnT are associated with worse outcome |
| Brooks et al. 201641 | LVEF ≤ 35% post-myocardial infarction (N = 231) | Improvement in LVEF | Peak troponin levels are associated with RR |
| Soluble ST2 | |||
| Weinberg et al. 200345 | LVEF ≤ 30% (N = 161) | Clinical outcome | Change in sST2 was associated with clinical outcome |
| Daniels et al. 201047 | Heart failure history, symptoms or risk factors (N = 588) | 1 year mortality | sST2 (> 28.25 ng/mL) independent predictor for 1 year mortality |
| Bayes-Genis et al. 201248 | CHF (N = 891) | Clinical outcome | sST2 associated with mortality |
| Gaggin et al. 201437 | HFrEF (N = 151) | Improvement in LVEF, LVESVi, LVEDVi | Serial sST2 predicts RR |
| Ky et al. 201149 | HFrEF (N = 1141) | Clinical outcome | sST2 (> 36.3 ng/mL) associated with adverse outcome |
| Lupon et al. 201566 | LVEF < 40% (N = 304) | LVEF increase with > 15% LVEF increase with 10% + reduction of LVESDi > 20% or LVESVi ≥ 40% | sST2 levels < 48 ng/mL was associated with RR |
| Galectin-3 | |||
| Tang et al. 201154 | HFrEF (LVEF ≤ 35%) (N = 178) | Functional and clinical outcome | No relation between baseline levels galectin-3 and echocardiographic indices; high levels associated with poor clinical outcome |
| Motiwala et al. 201351 | HFrEF (N = 151) | Functional and clinical outcome | Serial follow-up with galectin-3 < 20 ng/L: associated with lower event rate and increase in LVEF |
| Lok et al. 201352 | HFrEF (N = 240) | Functional and clinical outcome | Galectin-3 levels are associated with change in LVEDV and predictor of mortality |
| Weir et al. 201355 | HFrEF (N = 100) | LV remodeling | No correlation between galectin-3 and RR |