
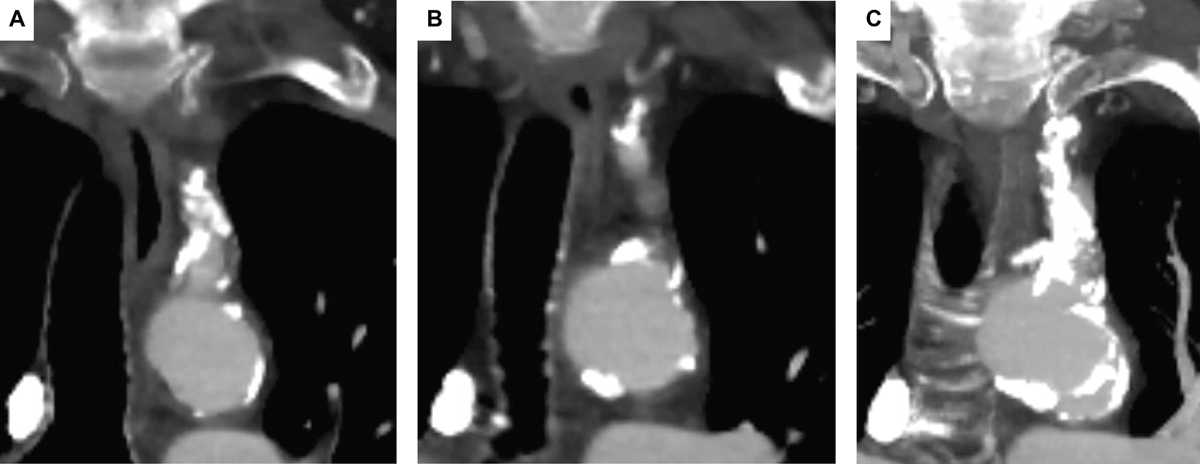
Figure 1
Computed tomography angiogram of the chest with visualization of the aortic arch and its branches, specifically (A) the proximal aspect of left subclavian artery with calcific stenosis, (B) the mid portion of left subclavian artery close to origin of vertebral artery, and (C) maximal intensity projection image showing distribution of calcification in the left subclavian artery.
Video 1
A computed tomography angiogram of the chest showing severe stenosis at the ostium of the left subclavian artery proximal to the origin of the LIMA and a patent LIMA-LAD graft; see also at https://youtube.com/shorts/i4G9p7HvCcY. LIMA: left internal mammary artery; LIMA-LAD: LIMA to left anterior descending artery
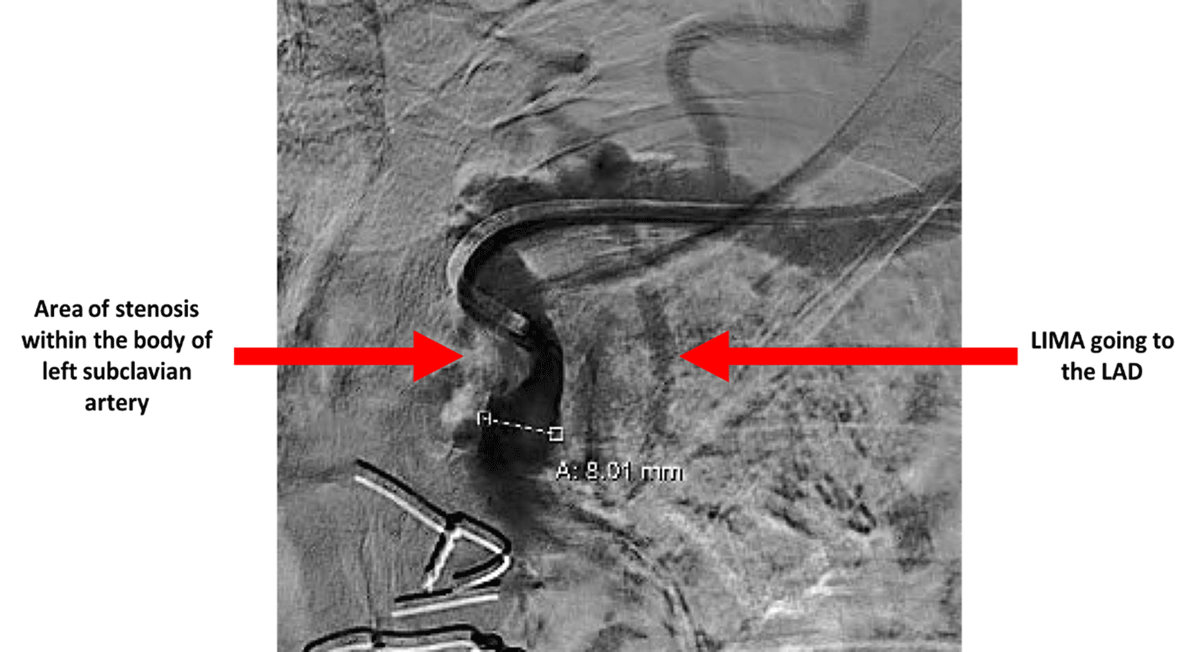
Figure 2
Invasive subclavian artery angiogram with red arrows pointing to severe proximal subclavian artery stenosis.
Video 2
A direct coronary and subclavian artery invasive angiogram showing significant proximal subclavian artery stenosis; see also at https://youtu.be/2FcTAytfCdg.
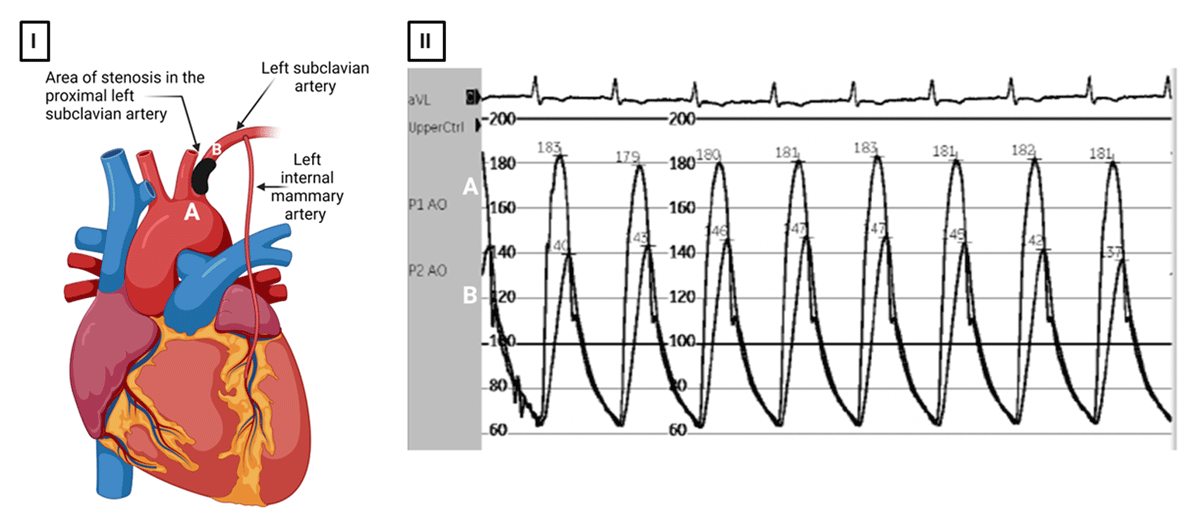
Figure 3
(I; left panel) Simultaneous pressure tracings taken proximal (A) and distal (B) to the stenosis through simultaneous femoral access and left radial access, respectively. (II; right panel) Pressure tracings demonstrate a peak-to-peak gradient ~ 40 mm Hg across the subclavian artery stenosis (> 20 mm Hg is considered hemodynamically significant). Created with BioRender.com.
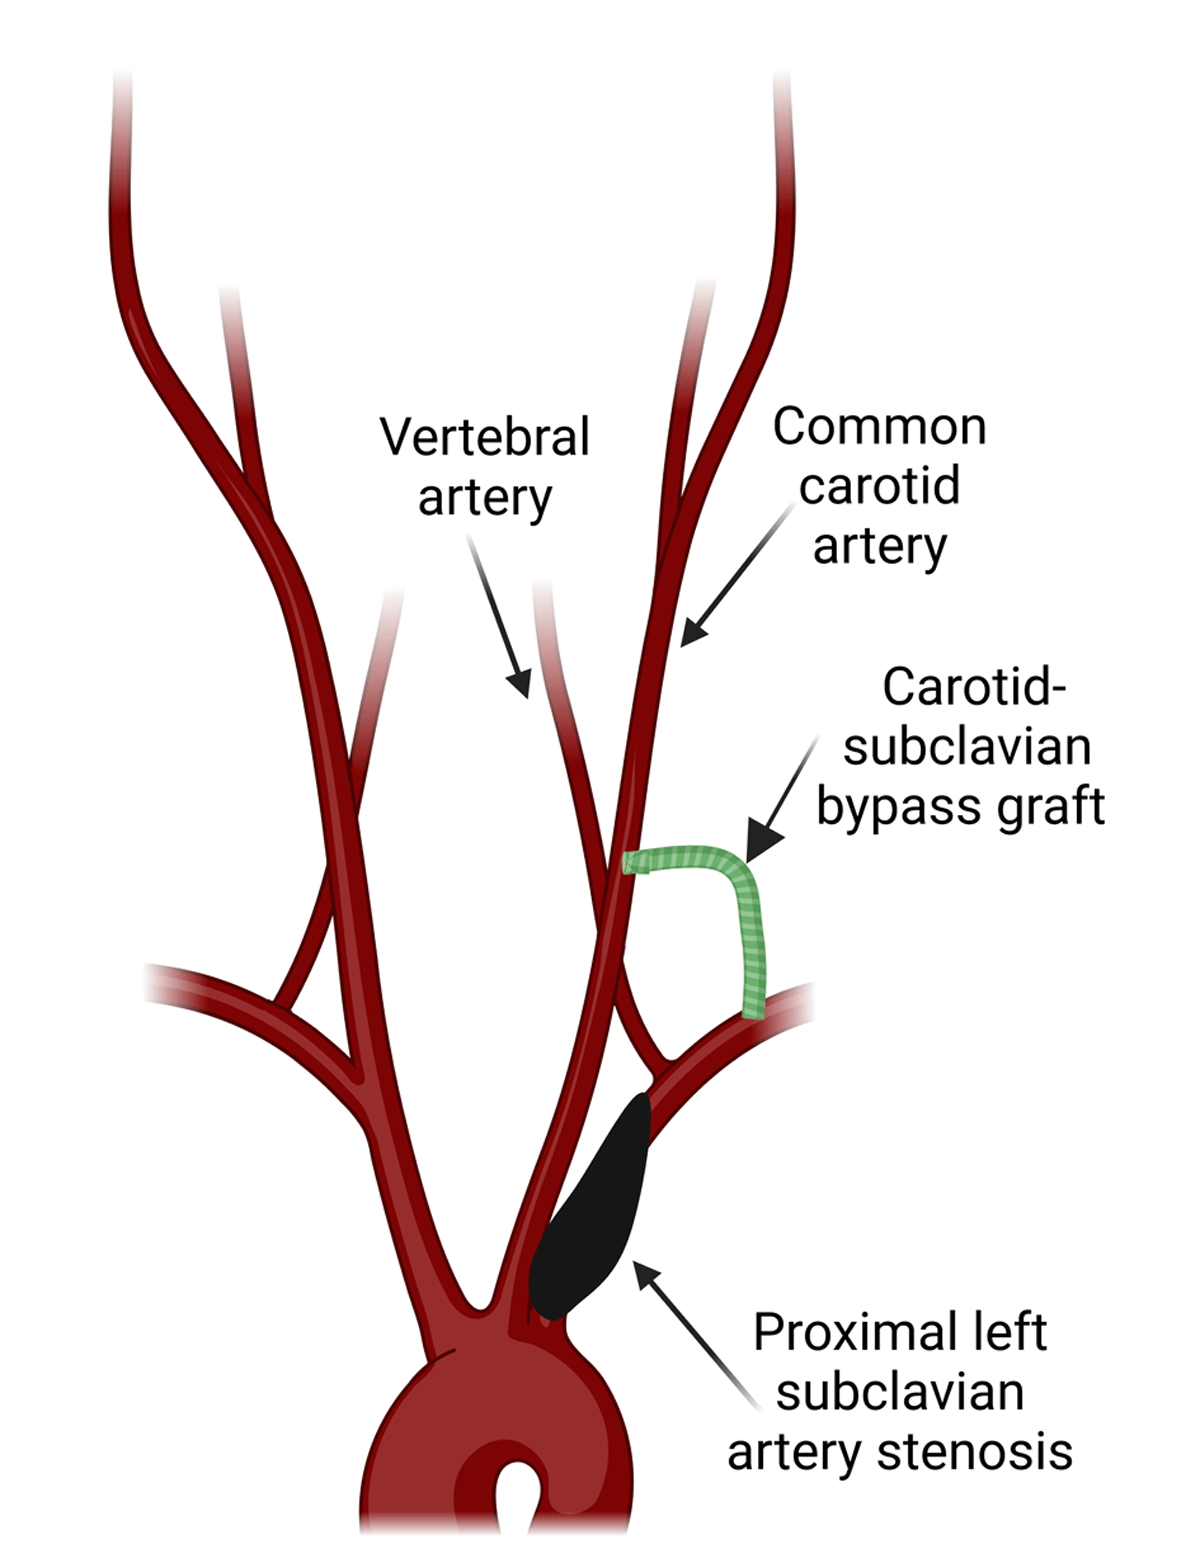
Figure 4
Graphic illustrates a carotid-subclavian bypass graft. Created with BioRender.com.