
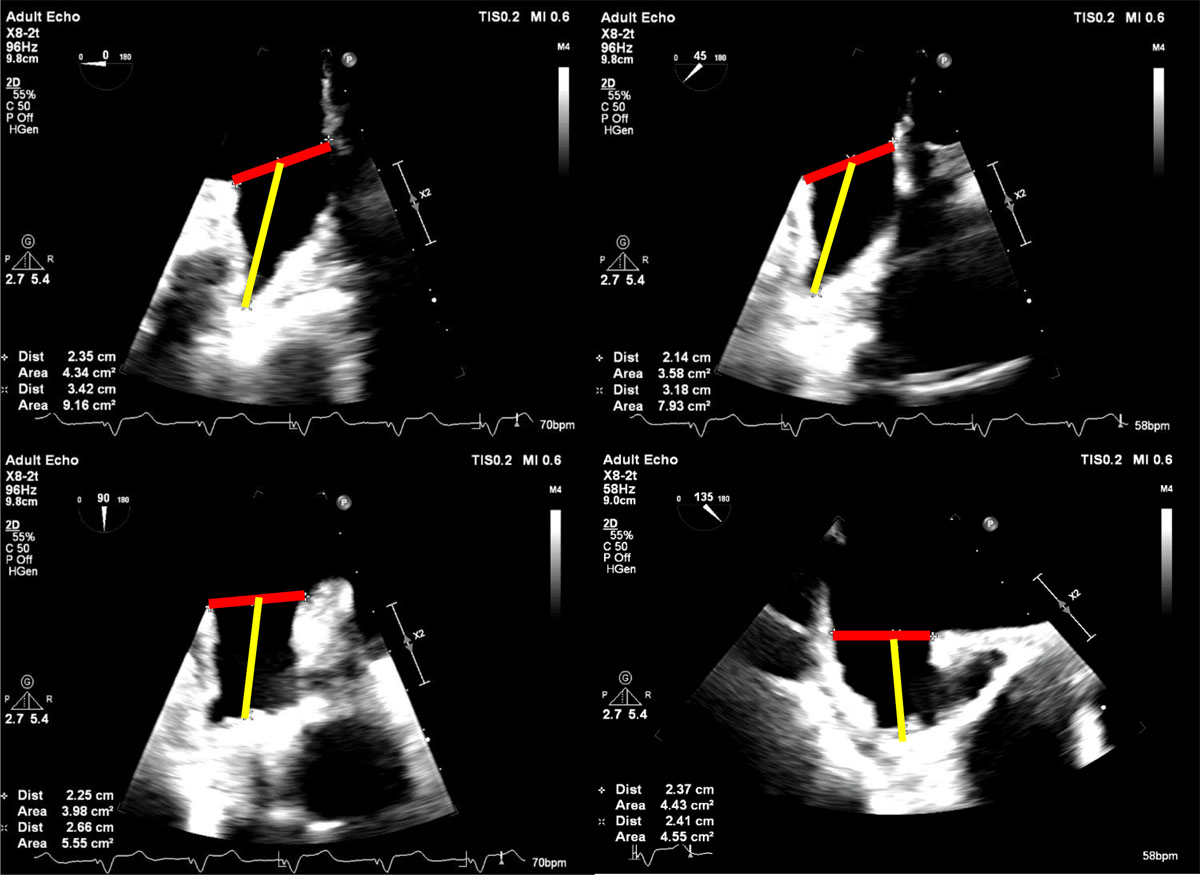
Figure 1
Transesophageal echocardiogram demonstrating left atrial appendage measurements on different planes (0, 45, 90 and 135 degrees). The horizontal red line represents the width and the yellow line represents depth.
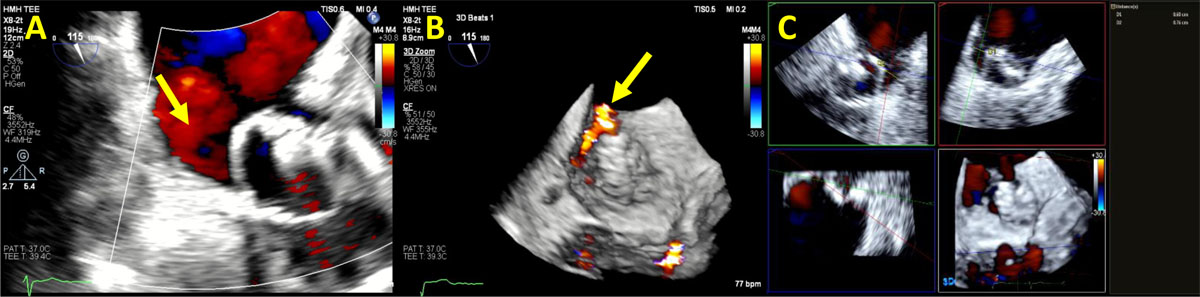
Figure 2
Transesophageal echocardiogram showing (A) Video clip of 2D color Doppler peri-Watchman device leak (yellow arrow). (B) Video clip of 3D color Doppler transesophageal echocardiogram showing peri-Watchman device leak (yellow arrow). (C) 2D multi-planer reconstruction of the Watchman device demonstrating the size of the peri-device leak at 0.8 × 0.6 cm. See Figure 2 A videoclip at https://youtu.be/LlqtscEZVR4 and Figure 2 B videoclip at https://youtu.be/F0qbwF45LLQ.
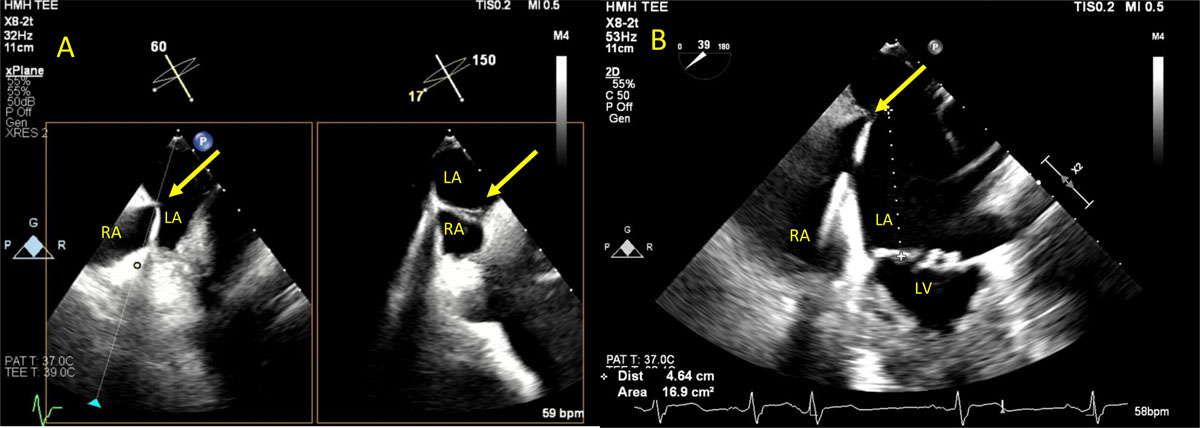
Figure 3
(A) Versacross sheath with Baylis radiofrequency wire to cross the interatrial septum (yellow arrow). (B) Measuring the distance between the crossing wire and the mitral valve plane. Optimal distance ≥ 4 cm. See Figure 3 A videoclip at https://youtu.be/1b_bV_QfKd8.
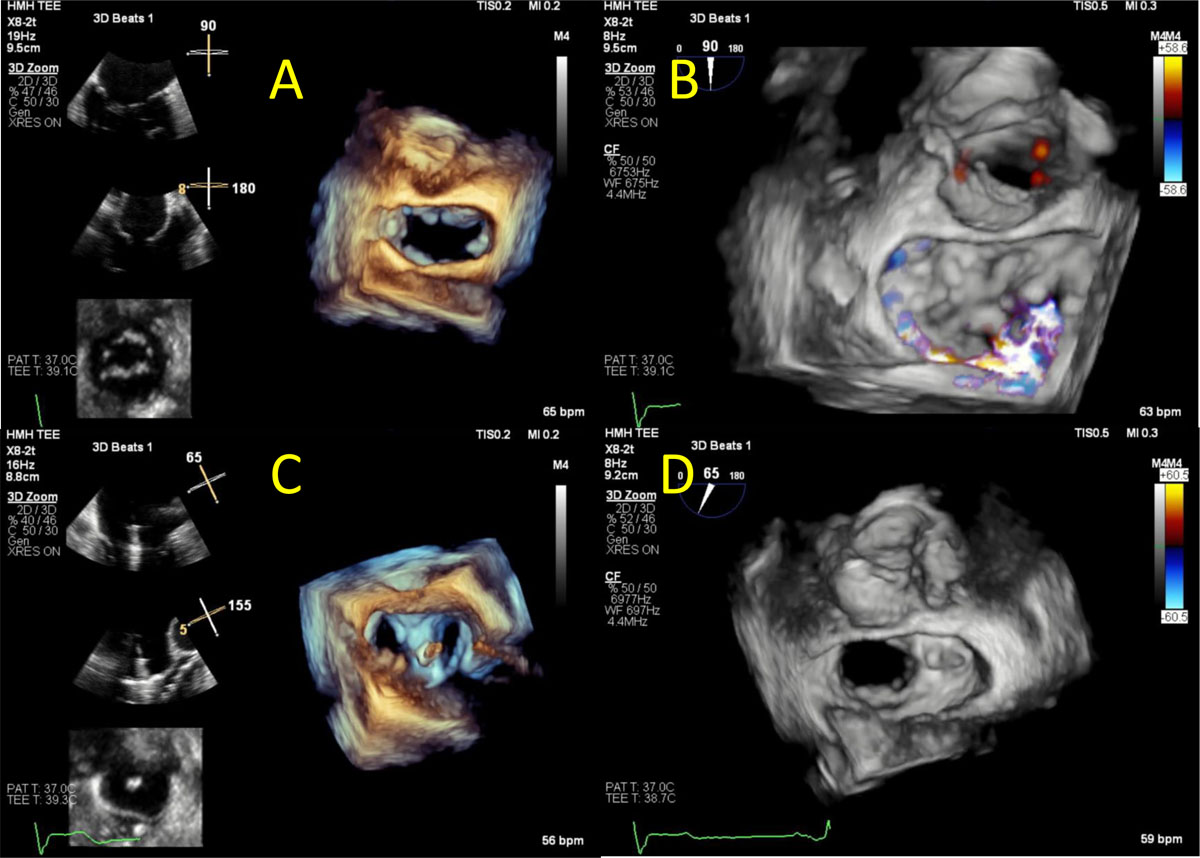
Figure 4
Transesophageal echocardiogram showing (A) 2D and 3D video clip of the mitral valve showing medial aspect of A2 and A3 prolapse. (B) 3D color Doppler video clip of the mitral valve showing posteriorly directed mitral regurgitation. (C) 2D and 3D video clip of the mitral valve showing the guide catheter and MitraClip position after grasping A2 and P2 scallops. (D) 3D color Doppler video clip of the mitral valve after deploying the MitraClip. Mild residual MR noted. See Figure 4 A videoclip at https://youtu.be/NRvFQL6UBJA, Figure 4 B videoclip at https://youtu.be/wTsxav-JLbo, Figure 4 C videoclip at https://youtu.be/xH8RG0NrHp4 and Fig4D videoclip at https://youtu.be/yMQjrnIhM_0.
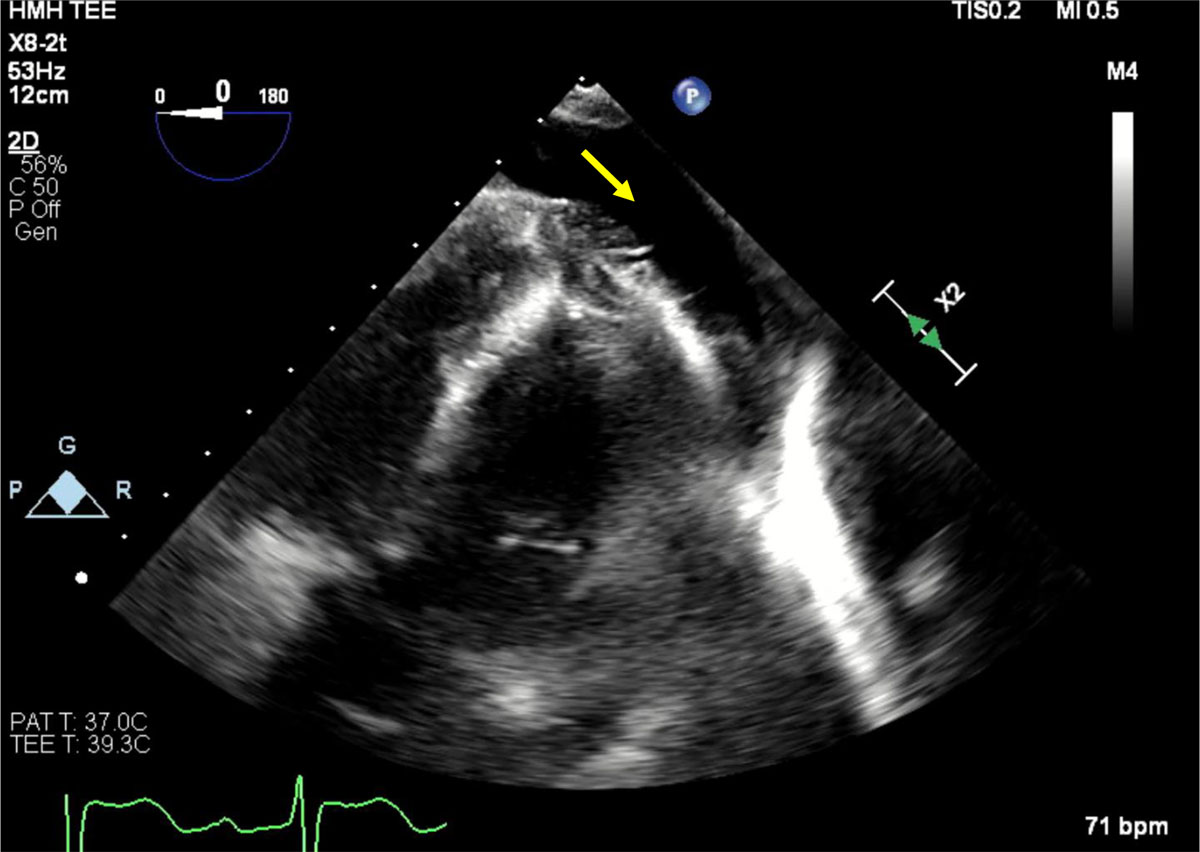
Figure 5
Transesophageal echocardiogram, transgastric view showing moderate pericardial effusion (yellow arrow) during MitraClip procedure that required urgent pericardiocentesis. See Figure 5 videoclip at https://youtu.be/_4LF1h95oR0.
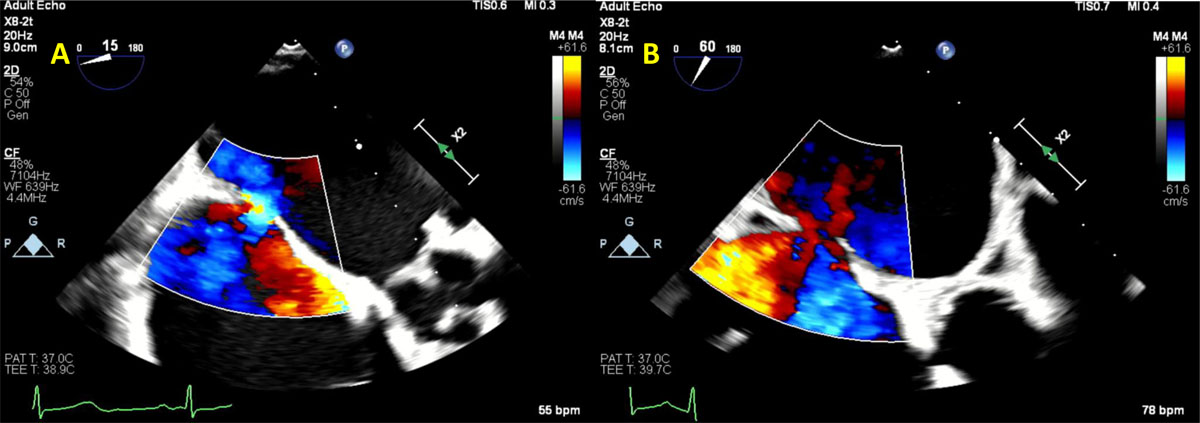
Figure 6
Transesophageal echocardiogram showing (A) residual iatrogenic atrial septal defect (ASD) with bidirectional shunt from prior transcatheter mitral valve replacement that was complicated by paravalvular leak (PVL). (B) During attempt to close the PVL, the patient developed intractable hypoxia and was found to have worsening ASD with bidirectional shunt due to enlargement of the ASD size. See Figure 6 A videoclip at https://youtu.be/Zfbb80XK-jI and Figure 6 B videoclip at https://youtu.be/em48KZ8hbJY.
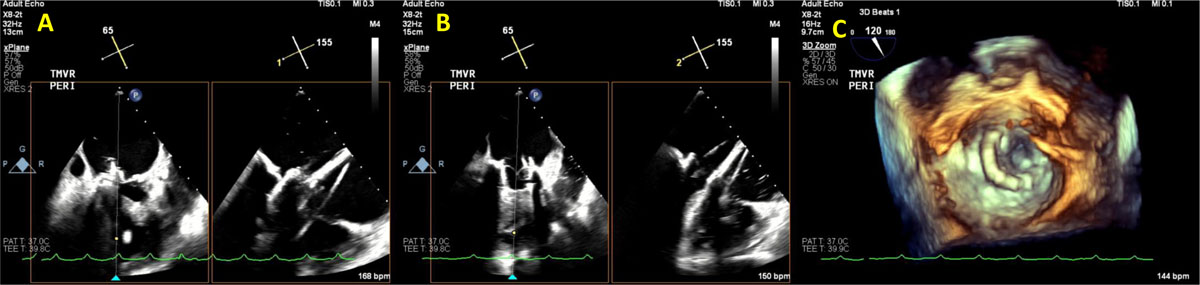
Figure 7
Transesophageal echocardiogram showing (A) transcatheter mitral valve implantation (TMVR) implantation. (B) Immediately after TMVR implantation, normal leaflet motion is noted. (C) 3D reconstruction demonstrating normal prosthesis leaflet motion. See Figure 7 A videoclip at https://youtu.be/ksmMxnu-oSk, Figure 7 B videoclip at https://youtu.be/r8dTvavy0jY and Figure 7 C videoclip at https://youtu.be/Yp4q9dn_os8.
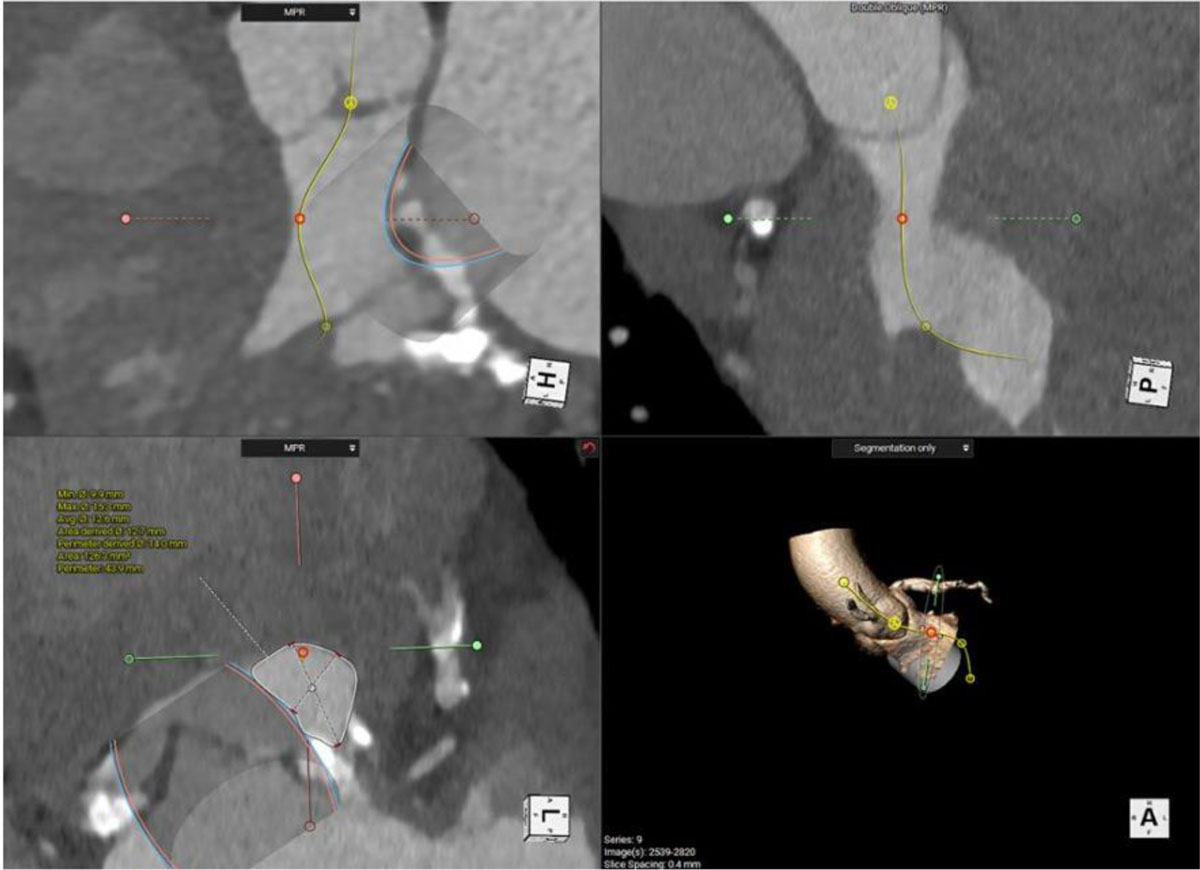
Figure 8
Cardiac computed tomography showing multiple views of the neo-left ventricular outflow tract (neo-LVOT) after implanting the virtual mitral valve. It measured 1.3 cm2, which is high risk for LVOT obstruction.
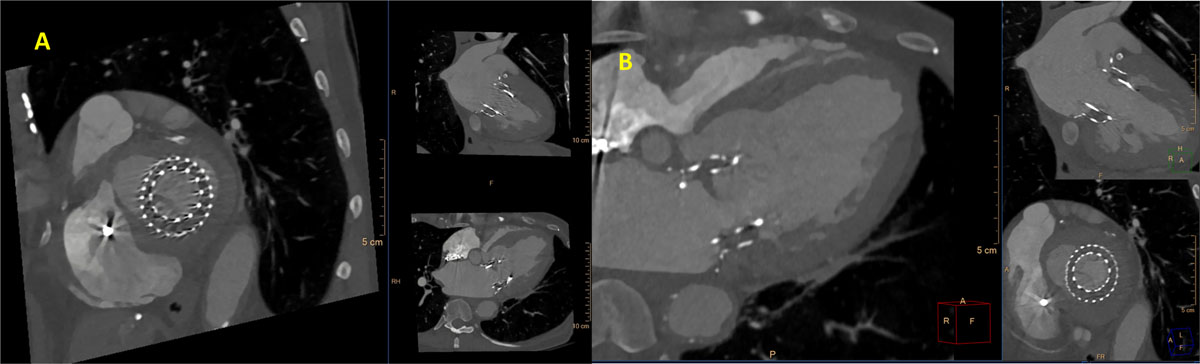
Figure 9
Cardiac computed tomography showing (A) video clip of the transcatheter mitral valve replacement (TMVR) with restricted leaflet motion. (B) Hypoattinuated leaflet thickening (HALT) >75% of the TMVR leaflet. See Figure 9 A videoclip at https://youtu.be/1O5I4xX9rGk.
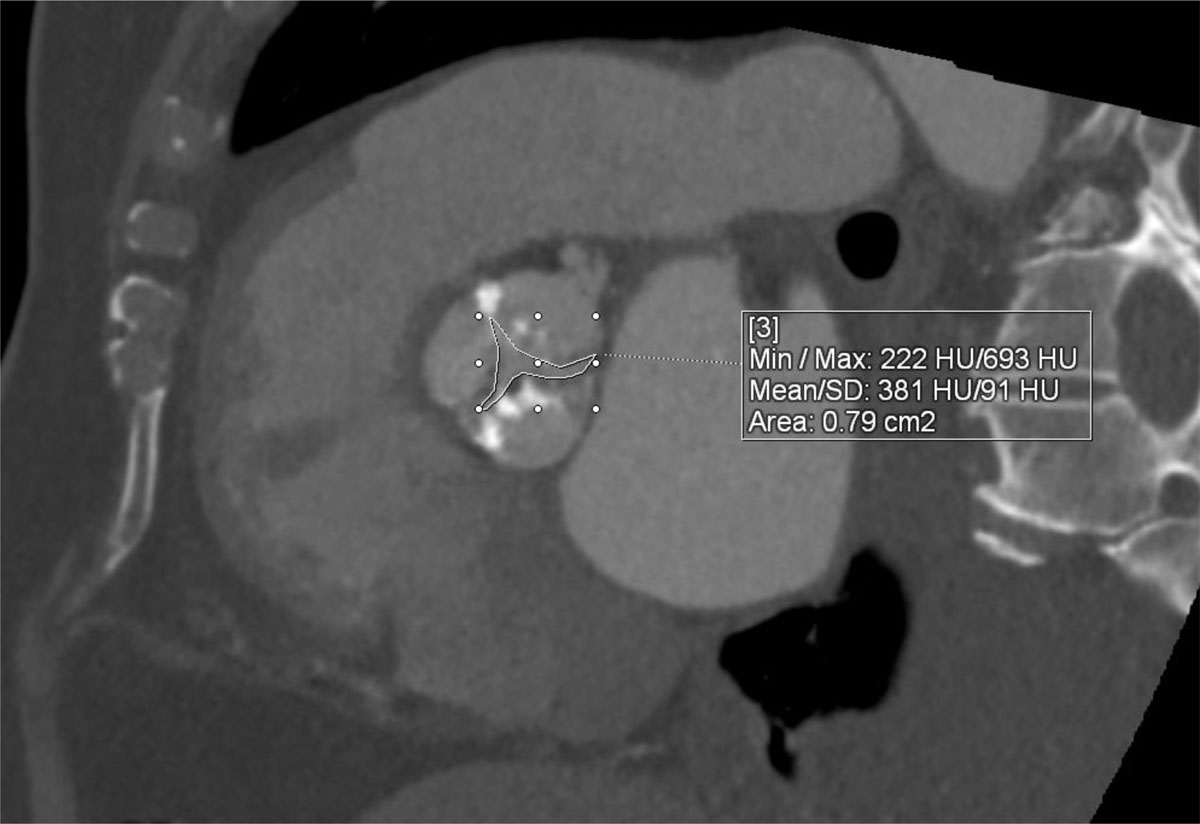
Figure 10
Cardiac computed tomography showing severe calcific aortic valve stenosis (valve area 0.79 cm2) via planimetry.
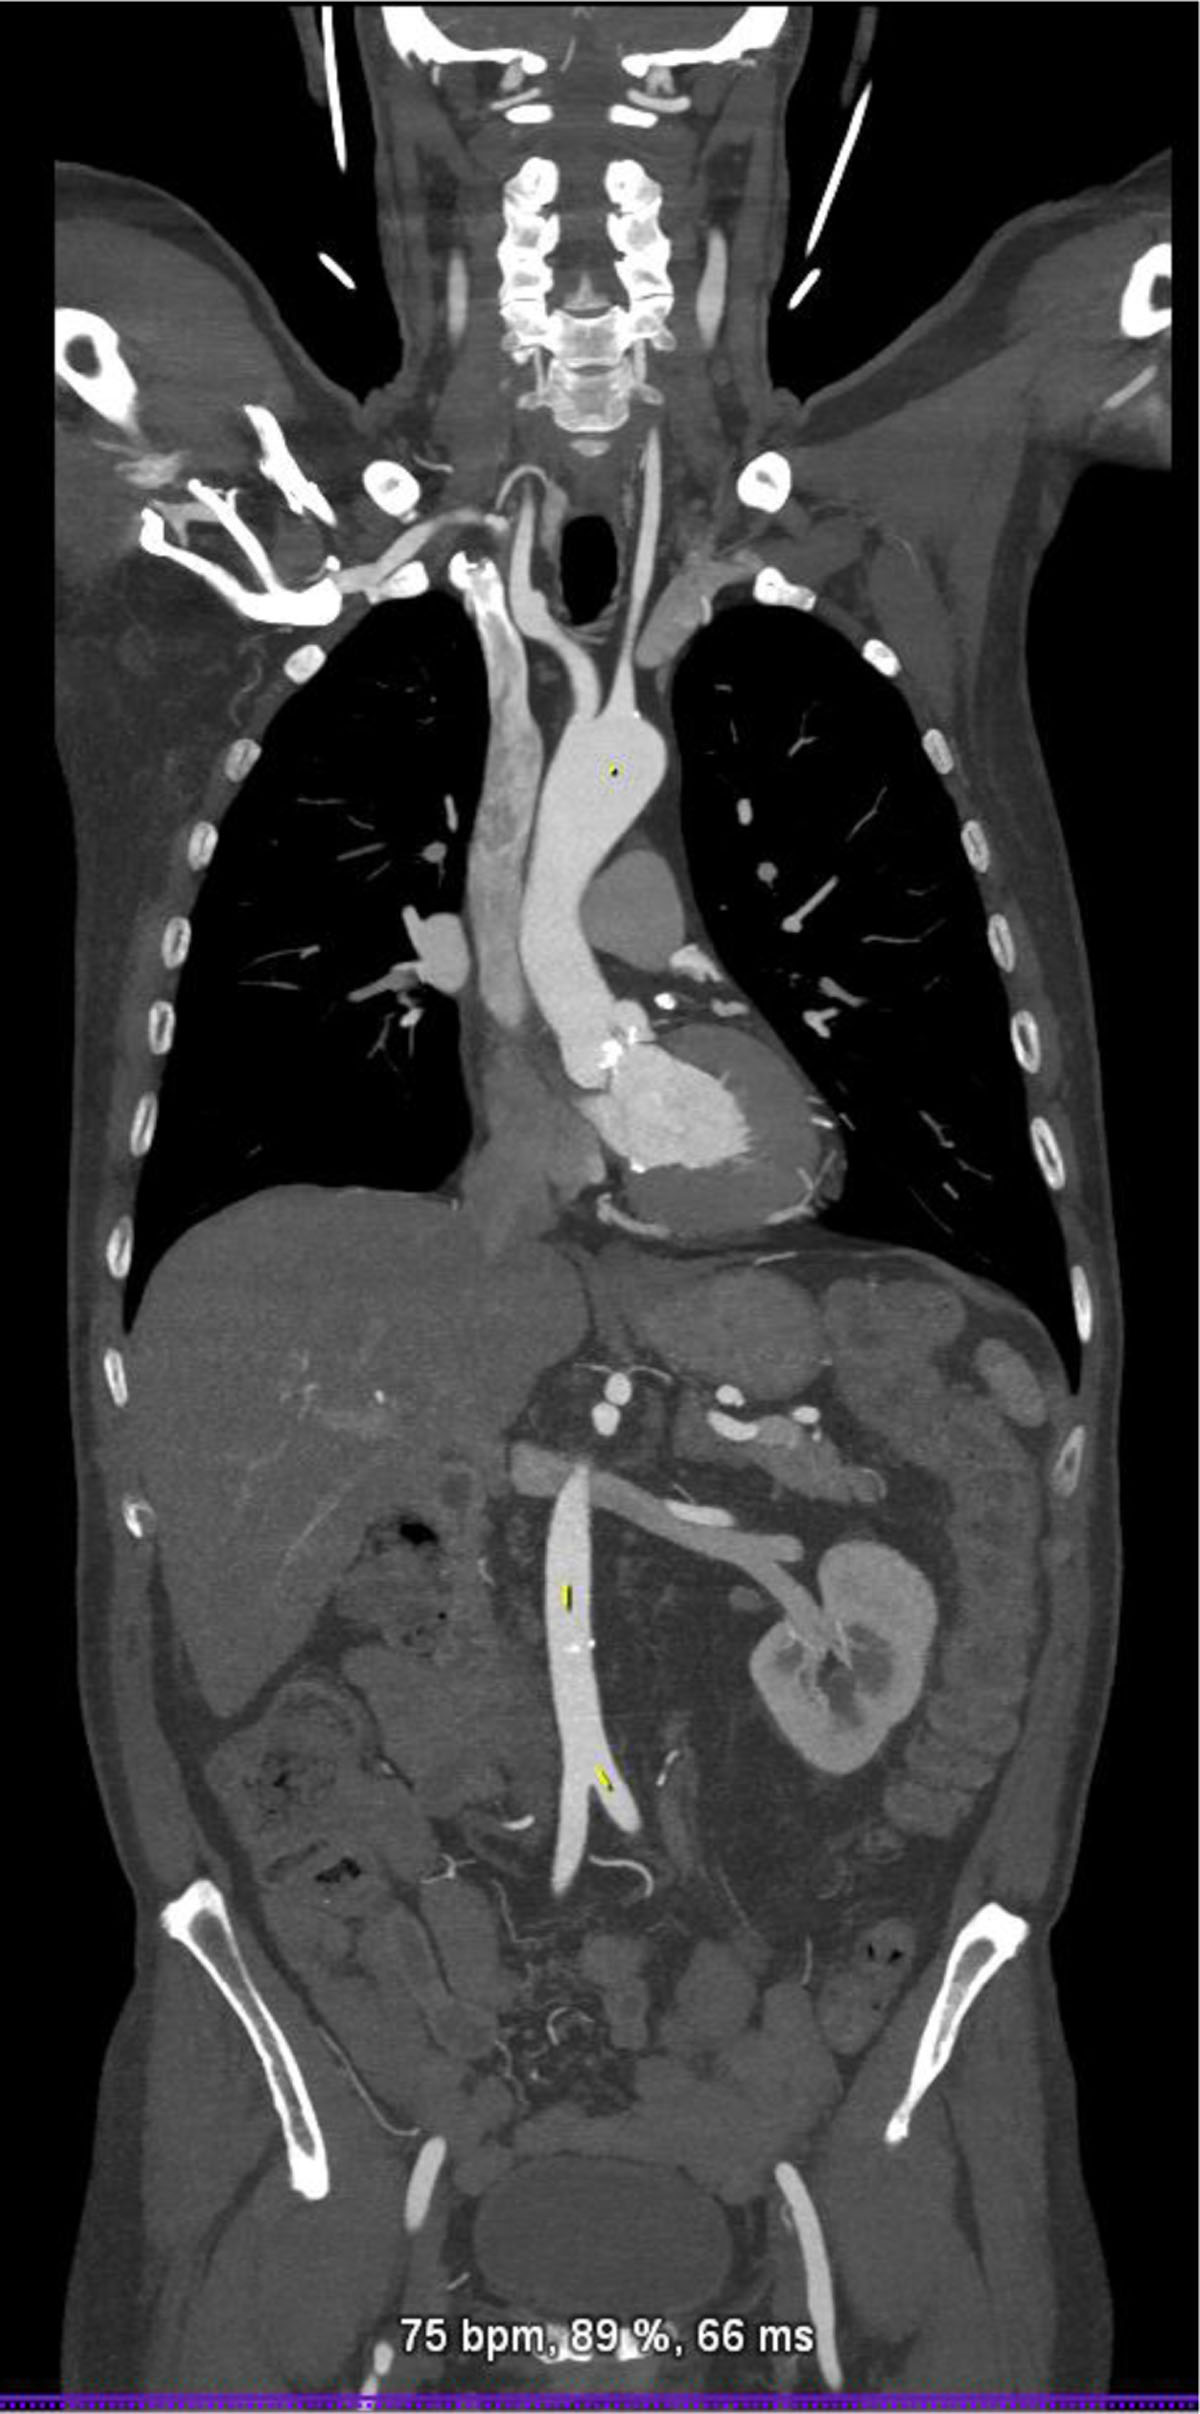
Figure 11
Cardiac computed tomography showing the vascular access from the level of the carotid arteries to superficial femoral arteries.
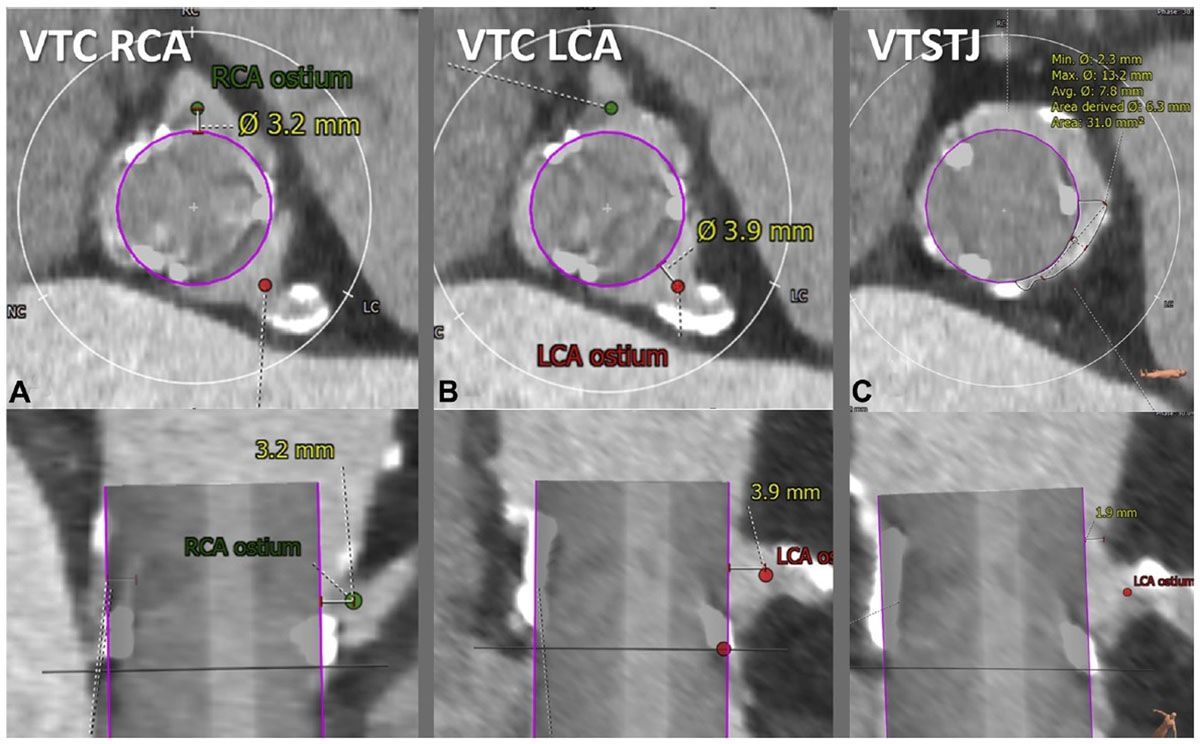
Figure 12
Cardiac computed tomography showing the virtual valve–to–coronary (VTC) distance, which is measured in 2 orthogonal planes (top, axial; bottom, longitudinal). Representative VTC distance measurement for (A) a right coronary artery (RCA) and (B) left coronary artery (LCA). The valve-to-sinotubular junction (VTSTJ) distance is measured in orthogonal planes (C): axial (upper) and longitudinal (lower), when the sinotubular junction is lower than the height of the transcatheter aortic valve replacement device. Reprinted with permission.9
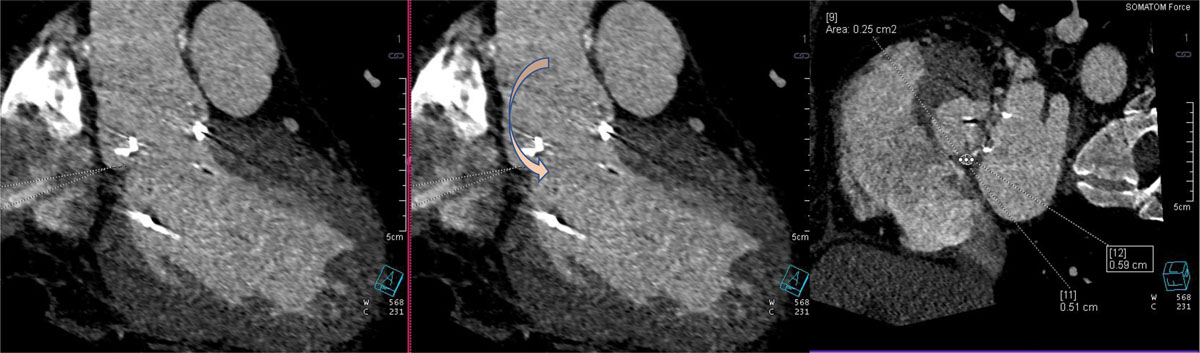
Figure 13
Cardiac computed tomography showing surgical aortic valve with para-valvular leak (arrow).
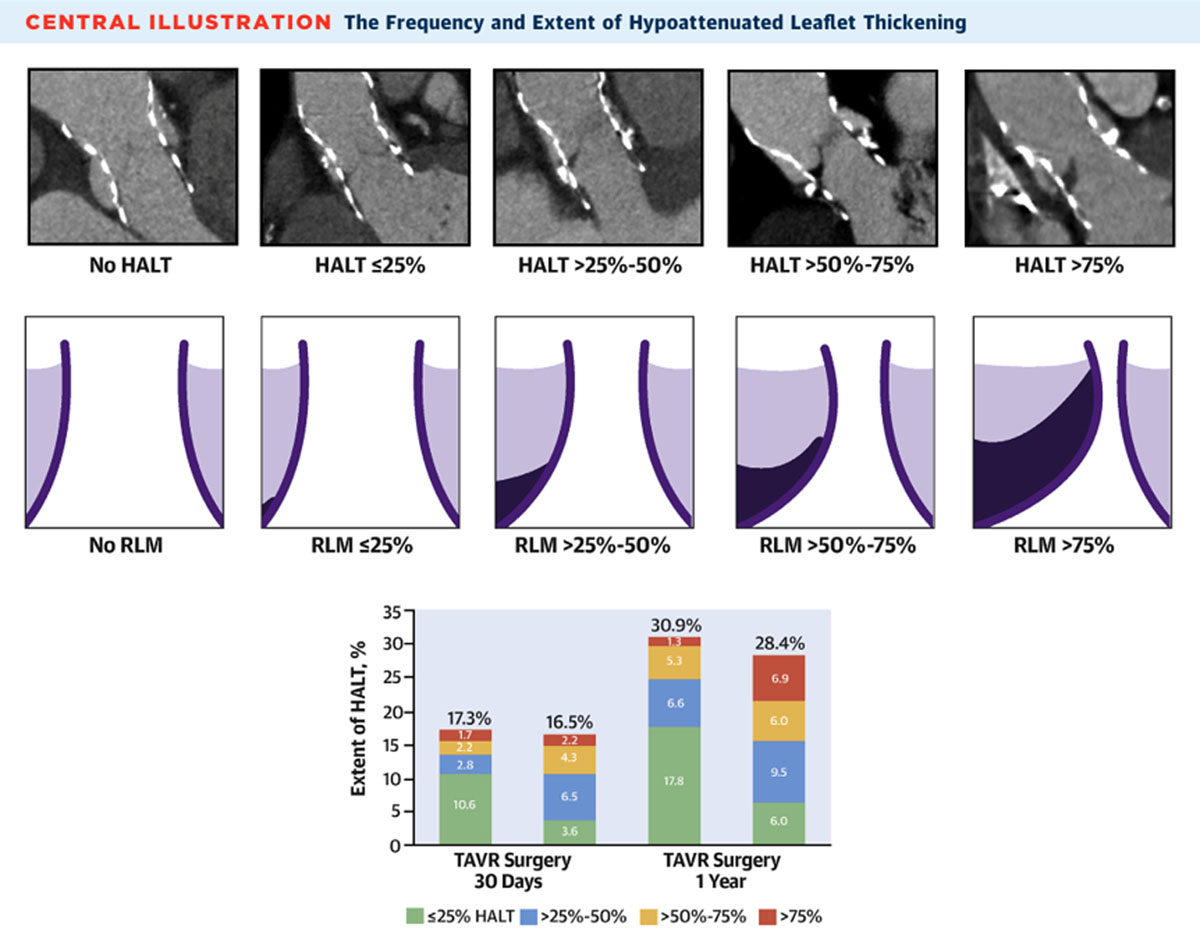
Figure 14
Cardiac computed tomography (CT) showing grading of hypoattenuated leaflet thickening (HALT). Reprinted with permission.13
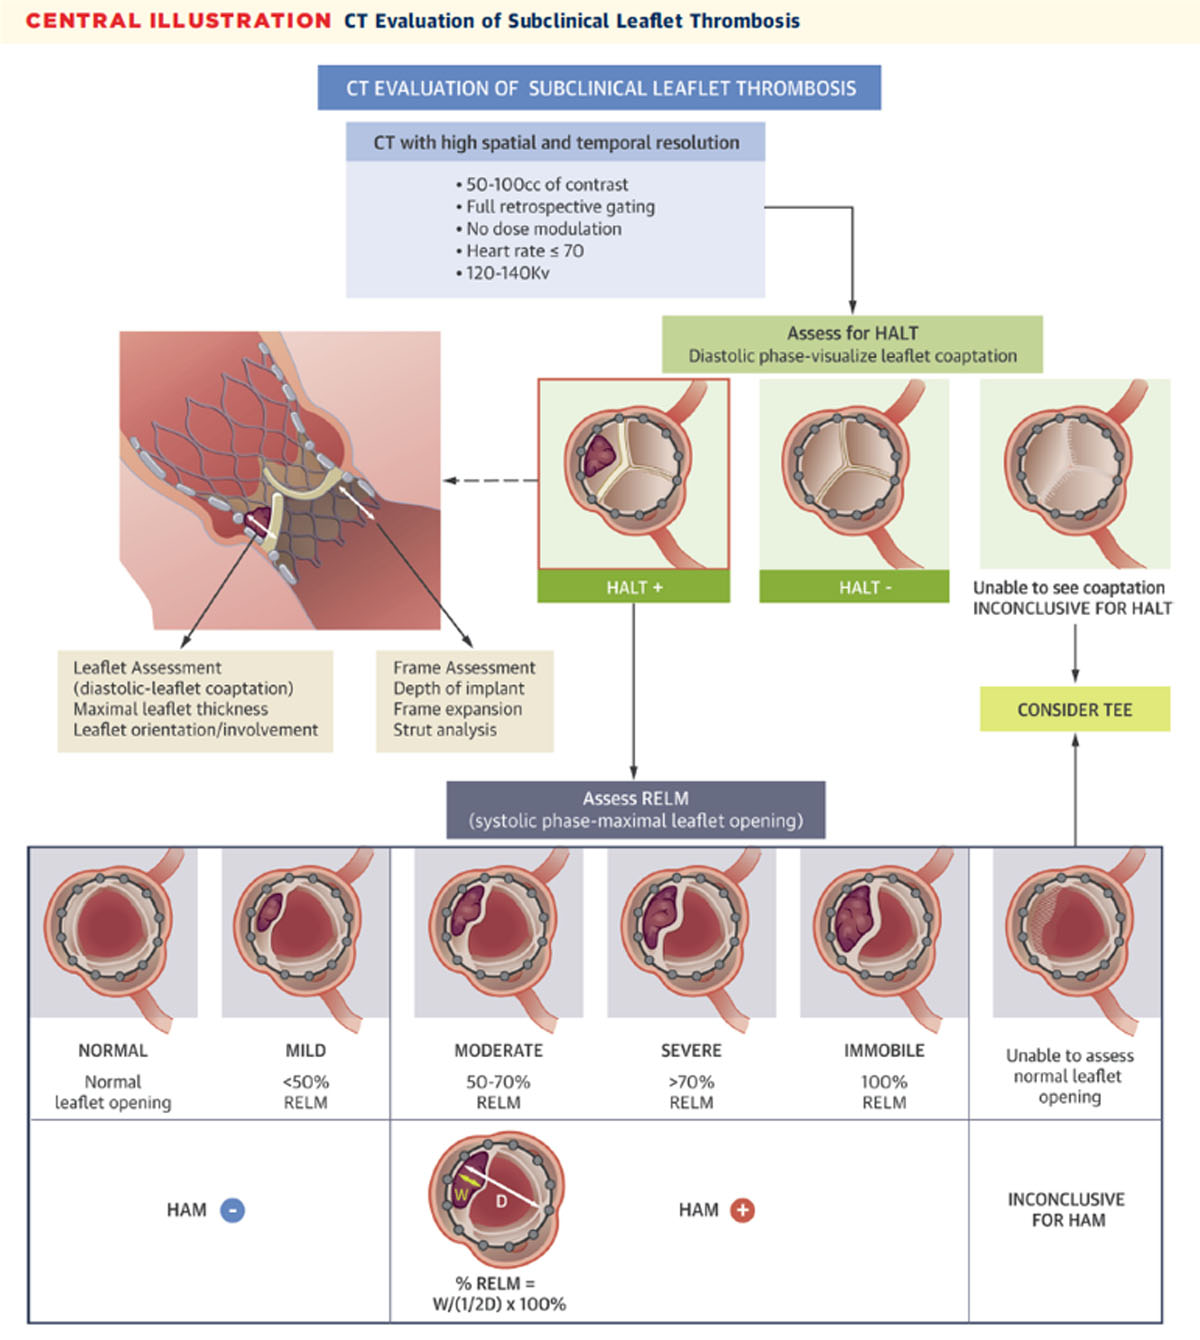
Figure 15
Illustration showing hypoattenuated affected motion (HAM) and calculating the percentage of reduced leaflet motion (RELM). Reprinted with permission.14
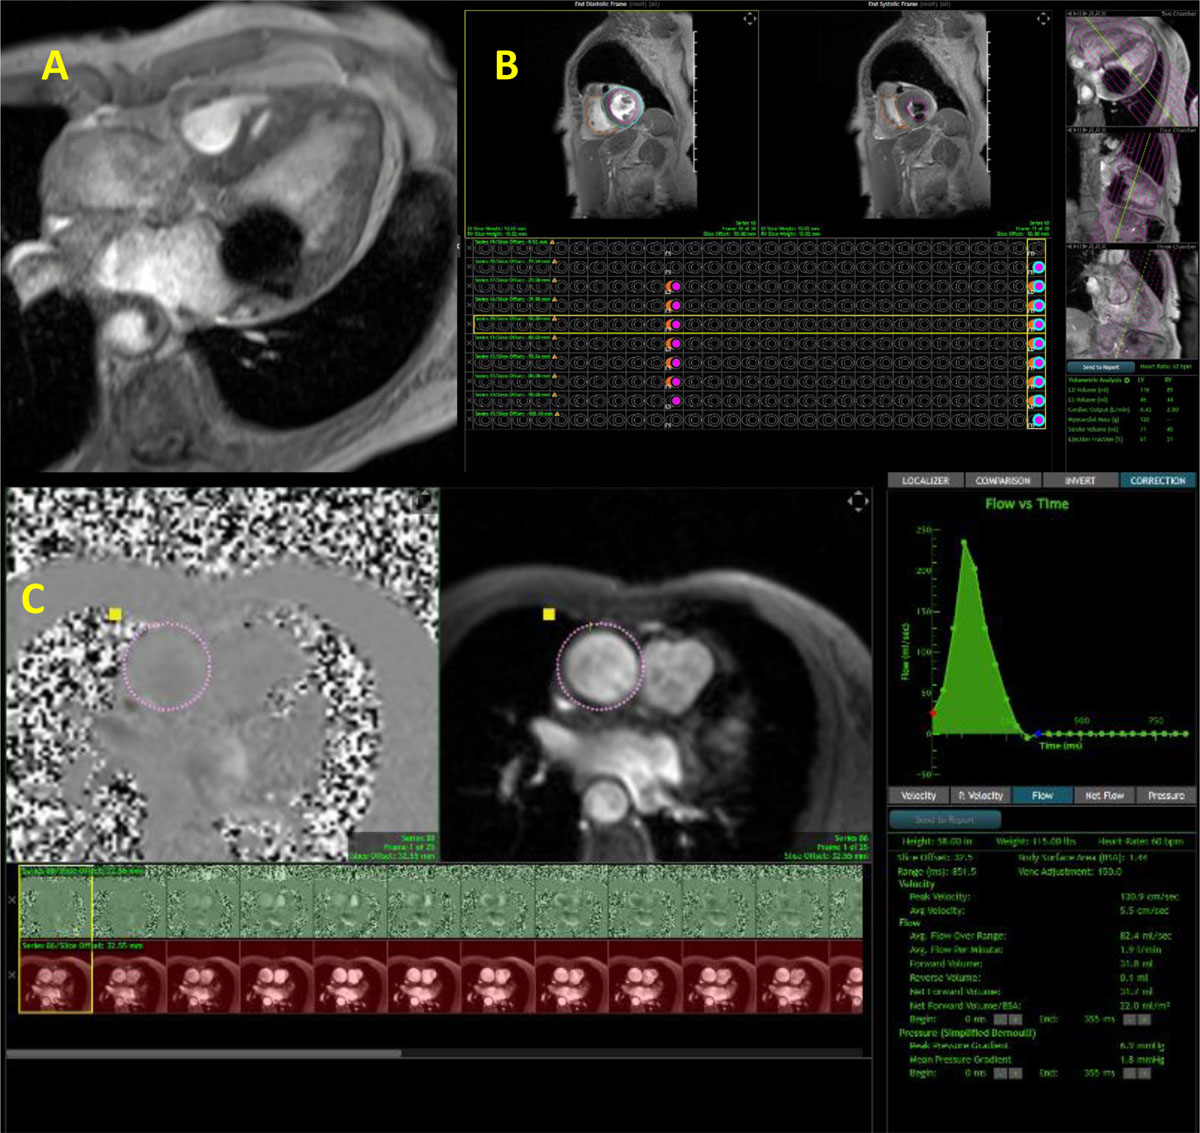
Figure 16
Cardiac magnetic resonance showing (A) Gradient echo cine clip void artifact with MitraClip noted within the mitral valve, (B) left and right ventricular volumes, and (C) velocity encoding of the aortic valve to calculate the aortic forward flow. Residual mitral regurgitation was calculated at 39 mL (moderate MR). See Figure 16 A videoclip at https://youtube.com/shorts/dzBitLYytBE.
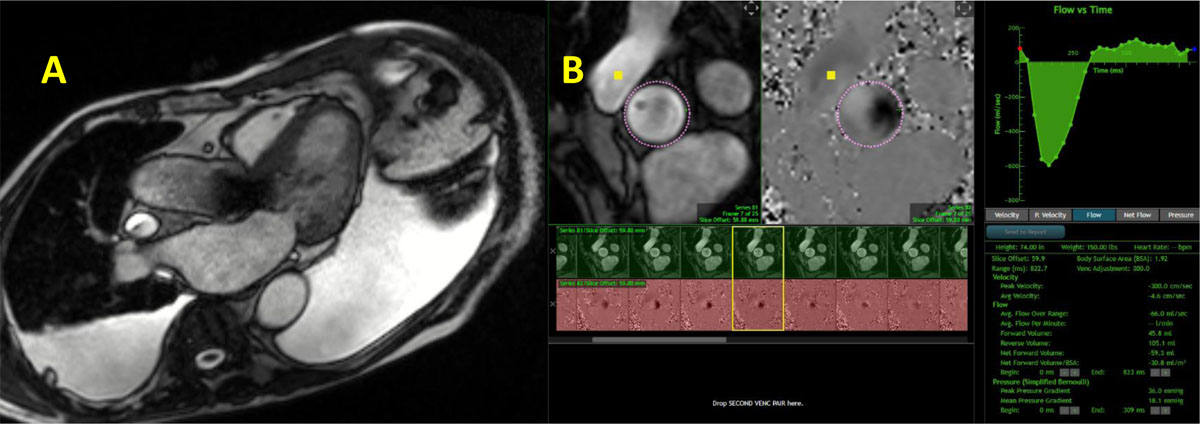
Figure 17
Cardiac magnetic resonance showing (A) gradient echo clip with transcatheter aortic valve implantation prosthesis. (B) Velocity encoding of the aortic valve to calculate the aortic forward flow and aortic regurgitation; the latter was estimated at 46 mL. See Figure 17 A videoclip at https://youtu.be/QzSLwsdtRxA.
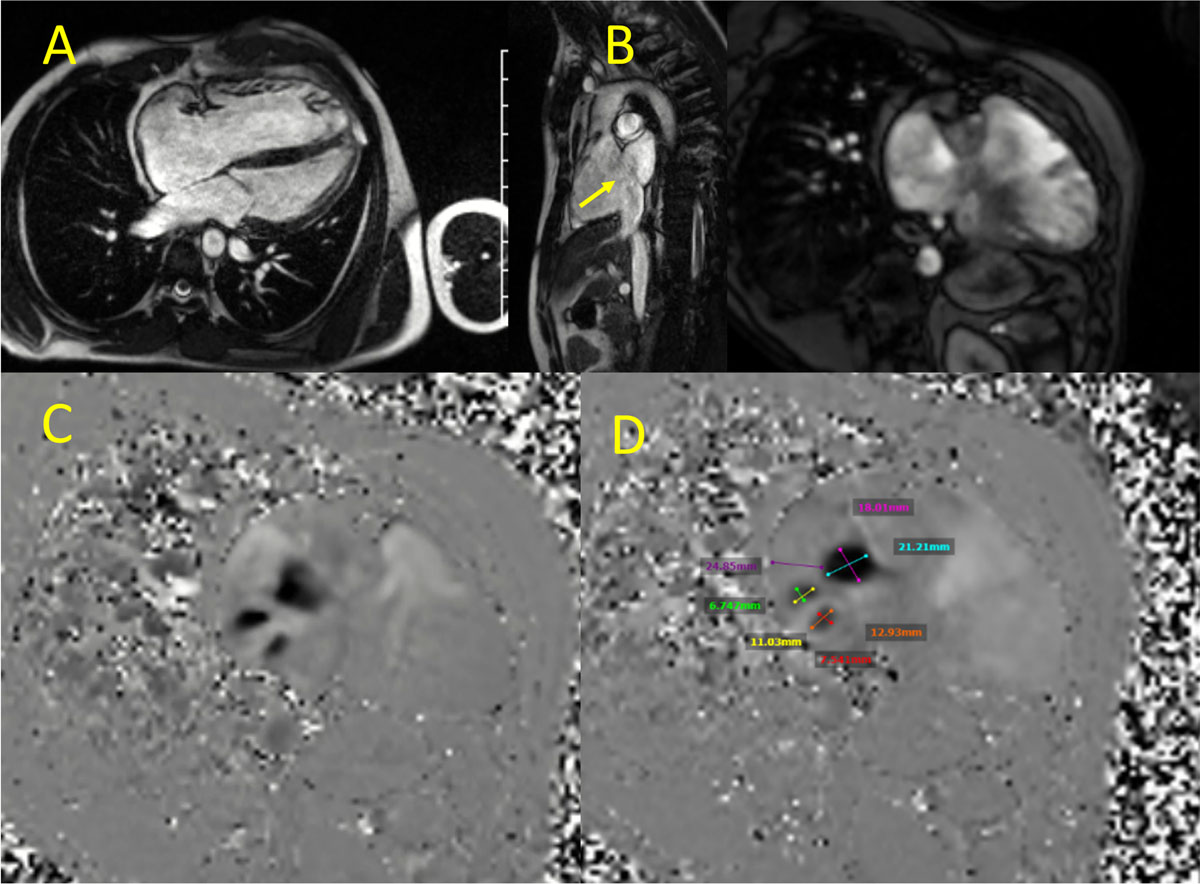
Figure 18
Cardiac magnetic resonance showing (A) steady state free precession (SSFP) cine clip showing right atrial and ventricular enlargement, (B) secundum atrial septal defect (yellow arrow), (C) SSFP cine clip 2-chamber view of the right ventricle, and (D) velocity encoding, 2-chamber view of the right ventricle showing 3 atrial septal defects with their measurements. See Figure 18 Top Center videoclip at https://youtu.be/8dMYzYOpQ2k, Figure 18 Top Left videoclip at https://youtu.be/zg6snVhWxMg and Figure 18 Top Right videoclip at https://youtu.be/_ZQrmcqkrdU
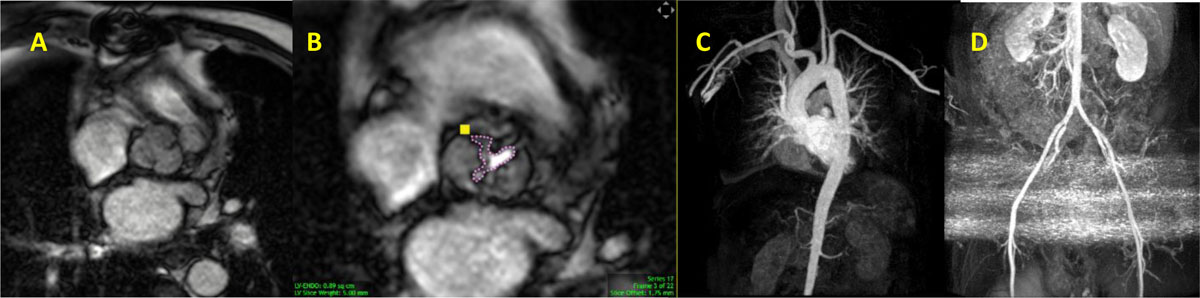
Figure 19
Cardiac magnetic resonance showing (A) gradient echo clip short axis view of the aortic valve. Stenosis is noted. (B) Planimetry of the aortic valve demonstrating severe aortic stenosis with aortic valve area of 0.9 cm2. (C and D) Maximal intensity projection of the aorta and lower extremity arteries. See Figure 19 A videoclip at https://youtube.com/shorts/sVsBIuobsUU.
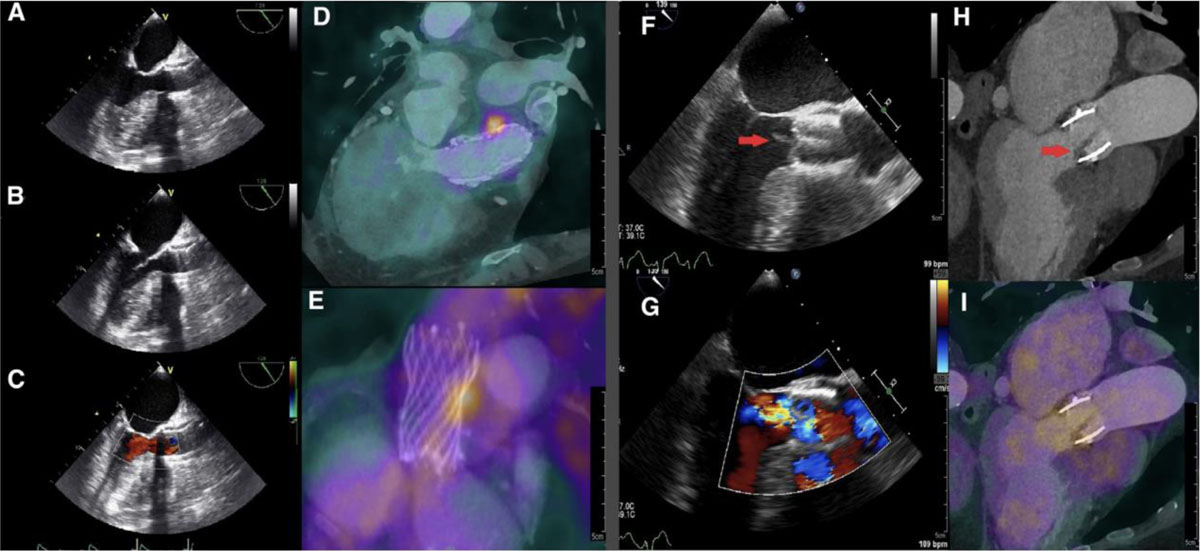
Figure 20
Two cases of one positive PET/CT and one negative PET/CT for TAVI-IE. Case 1 (A to E): A 75-year-old female with suspected Corevalve TAVI-IE underwent a TEE without signs of endocarditis (A to C). PET/CT images (D/E) demonstrated focal FDG uptake alongside the Corevalve as positive sign of TAVI-IE. This case was previously published as a case report. Reprinted with permission.19
Case 2 (F to I): An 81-year-old female with suspected Edwards-Sapien TAVI-IE underwent a TEE (F/G) with a vegetation on the aortic valve and mild aortic regurgitation. CTA demonstrated thickening of the aortic valve leaflets (H) as possible signs of vegetation. However, PET/CT images (I) showed no focal 18F-FDG uptake on the leaflets. This was explained by the low inflammatory activity and 2 weeks of intravenous antibiotic therapy prior to the PET/CT scan. Reprinted with permission.20 PET/CT: positron emission tomography/computed tomography; TAVI-IE: transcatheter aortic valve implantation-infective endocarditis; FDG: fludeoxyglucose F18; TEE: transesophageal echocardiography; CTA: computed tomography angiography