
Table 1
Long-term clinical outcomes of landmark TAVI trials in prohibitive and high-surgical-risk patients.
| SURGICAL RISK | TRIAL | YEAR | INTERVENTION | TAVI VALVE TYPE | AGE (Y) | % MALE | FOLLOW-UP AT 5 YEARS | LONG-TERM OUTCOMES |
|---|---|---|---|---|---|---|---|---|
| Prohibitive risk | PARTNER 1B8 (Mean STS 11.7%) | 2015 | N = 358 179 TAVI 179 Standard therapy† | BE first-generation SAPIEN (Edwards) | 83 | 46% | 49/179 TAVI survived 5/179 SAVR survived | At 5 years, TAVI vs standard therapy: • All-cause death (71.8% vs 93.6%, ss) • CV mortality (57.5% vs 85.9%, ss) • Rehospitalization (47.6% vs 87.3%, ss) • All stroke (16.0% vs 18.2%, ss) |
| CoreValve US Pivotal9 (Mean STS 10.4%) | 2021 | N = 639 639 TAVI compared with meta-analysisdata | SE First-generation CoreValve (Medtronic) | 83 | 48% | 158/639 survived at 5 years | At 5 years, TAVI: • All-cause death or major stroke (72.6%) • Major stroke (11.5%) • Major/life-threatening bleed (29.4%) • AV Reintervention (2.9%) • PPI (46.8%) • Aortic valve rehospitalization (48.3%) • Moderate or severe PVR (3.1%) | |
| High risk | PARTNER 1A10 (Mean STS 11.7%) | 2015 | N = 699 348 TAVI 351 SAVR | BE first-generation SAPIEN (Edwards) | 84 | 58% | Median follow-up 3.14 years (IQR 0·68–4·92) | At 5 years, TAVI vs SAVR: • All-cause death (67.8% vs 62.4%, ns) • Rehospitalization (42.3% vs 34.2%, ns) • All-strokes (15.9% vs 14.7%, ns) • Moderate or Severe PVR (TAVI > SAVR, ss) |
| CoreValve US Pivotal11 (Mean STS 7.4%) | 2018 | N = 797 391 TAVI 359 SAVR | SE First-generation CoreValve (Medtronic) | 83 | 53% | Median follow-up 49.9 months (TAVI), 41 months (SAVR) | At 5 years, TAVI vs SAVR: • All-cause death (55.3% vs 55.4%, ns) • Major stroke (17.5% vs 21.0%, ns) • Myocardial infarction (3.1% vs 3.3%, ns) • AV Reintervention (3.0% vs 1.1%, ss) • PPI (38.6% vs 22.3%, ss) • Moderate SVD (9.2% vs 26.6%, ss) |
[i] STS: Society of Thoracic Surgeons; BE: balloon-expandable; SE: self-expandable; TAVI: transcatheter aortic valve replacement; SAVR: surgical aortic valve replacement; CV: cardiovascular; PPI: permanent pacemaker implantation; PVR: paravalvular regurgitation; SVD: structural valve degeneration; AV: aortic valve; ss: statistically significant; ns: statistically nonsignificant; IQR: interquartile range
† 140 (79%) of 179 patients in the standard treatment group underwent balloon aortic valvuloplasty.
Table 2
Long-term clinical outcomes of landmark TAVI trials in intermediate and low-surgical risk patients.
| SURGICAL RISK | TRIAL | YEAR | INTERVENTION | TAVI VALVE TYPE | AGE (Y) | % MALE | FOLLOW UP% | LONG-TERM OUTCOMES |
|---|---|---|---|---|---|---|---|---|
| Intermediate risk | PARTNER 212 (Mean STS 5.8%) | 2020 | N = 2032 1011 TAVI 1021 SAVR | BE second-generation SAPIEN XT (Edwards) | 82 | 55 | 91% TAVI 81.4% SAVR | At 5 years, TAVI vs SAVR: • All-cause death or disabling stroke (47.9% vs 43.4%, ns) • All-cause death (46% vs 42.1%, ns) • Disabling Stroke (9.8% vs 8.6%, ns) • Rehospitalization (33.3% vs 25.2%, ss) • New PPI (15.5% vs 13%, ns) • AV Reintervention (3.2% vs 0.8%, ss) • Moderate to severe PVR (4.1% vs 0.42%, ss) |
| SURTAVI13 (Mean STS 4.5%) | 2022 | N = 1660 864 TAVI 796 SAVR | SE CoreValve (84%) Evolut R (16%) (Medtronic) | 80 | 56 | 93.7% TAVI 95.5% SAVR | At 5 years, TAVI vs SAVR: • All-cause death or disabling stroke (31.3% vs 30.8%, ns) • All-cause death (30.0% vs 28.7%, ns) • Valve thrombosis (0.5% vs 0.4%, ns) • AV Reintervention (3.5% vs 1.9%, ss) • Moderate or severe PVR (3.0% vs 0.7%, ss) | |
| Low risk | PARTNER 3*17 (Mean STS 1.9%) | 2021 | N = 950 496 TAVI 454 SAVR | BE SAPIEN 3 (Edwards) | 73 | 69 | 99% TAVI 93.8% SAVR | *At 2 years, TAVI vs SAVR: • All-cause death, stroke, or rehospitalization (11.5% vs 17.4%, ss) • Death or Disabling stroke (3% vs 3.8%, ns) • Rehospitalization (8.5% vs 12.5%, ss) • Valve thrombosis (VARC-2) (2.6% vs 0.7%, ss) • Mild PVR (26% vs 2.3%, ss) |
| Evolut Low risk trial**18 (Mean STS 1.9%) | 2023 | N = 1414 730 TAVI 684 SAVR | SE CoreValve (3.6%) Evolut R (74.1%) Evolut PRO (22.3%) (Medtronic) | 74 | 65 | 97.3% TAVI 92.3% SAVR | **At 3 years, TAVI vs SAVR: • All-cause death or disabling stroke (7.4% vs 10.4%, ns) • All-cause death (3.5% vs 4.4%, ns) • Disabling stroke (1.5% vs 2.7%, ns) • Mild PVR (21.3% vs 2.7%, ss) • New PPI (23.2% vs 9.1%, ss) | |
| NOTION19 (Mean STS 3%) | 2021 | N = 280 145 TAVI 135 SAVR | SE first-generation CoreValve (Medtronic) | 79 | 53 | 98.5% TAVI 99.3% SAVR | At 8 years, TAVI vs SAVR: • All-cause mortality (51.8% vs 52.6%, ns) • CV death (40.6% vs 43.6%, ns) • Stroke (8.3% vs 9.1%, ns) • New-onset Atrial Fibrillation (50% vs 74.1%, ss) • New PPI (42.5% vs 10.9%, ss) |
[i] STS: Society of Thoracic Surgeons; BE: balloon-expandable; SE: self-expandable; TAVI: transcatheter aortic valve replacement; SAVR: surgical aortic valve replacement; CV: cardiovascular; PPI: permanent pacemaker implantation; PVR: paravalvular regurgitation; SVD: structural valve degeneration; AV: aortic valve; ss: statistically significant; ns: statistically nonsignificant
* Only 2-year outcomes are available till date. ** 3-year outcomes are available till date.
Table 3
RCTs comparing long-term durability of TAVI to SAVR using standardized definitions.
| STUDIES | SURGICAL RISK | NO. OFPATIENTS | THV (N)SAVR (N) | FOLLOW-UP (Y) | DURABILITYDEFINITION | SVD (%)TAVI VS SAVR, P | BVF (%)TAVI VS SAVR, P |
|---|---|---|---|---|---|---|---|
| Pooled analysis of CoreValve US Pivotal and SURTAVI55 | Inter-mediate/High | 4762 | CoreValve 3661 Evolut R 130 SAVR 971 | 5 | VARC-3, European task force (2017) | 2.2% vs 4.38%, ss | — |
| PARTNER 2A trial and Sapien 3 registry47 | Inter-mediate | 2329 | Sapien XT (774) S3 (891) SAVR (664) | 5 | VARC-3, European task force (2017) | 9.5% Sapien XT vs 3.5%, ss 3.9% S3 vs 3.5%, ns | 4.7% Sapien XT vs 1.3%, ss 2.6% S3 vs 1.3%, ns |
| CoreValve US Pivotal High risk Trial11 | High | 797 | CoreValve (391) SAVR (359) | 5 | European task force (2017) | 9.5% vs 26.6%, ss | — |
| NOTION trial19 | Low | 280 | CoreValve (139) SAVR (135) | 8 | European task force (2017) | 13.9% vs 28.3%, ss | 8.7% vs 10.5%, ns |
[i] RCTs: randomized controlled trials; SVD: structural valve degeneration; BVF: bioprosthetic valve failure; VARC: Valve Academic Research Consortium; P2A: PARTNER 2A; S3: Sapien 3; ss: statistically significant; ns: statistically nonsignificant
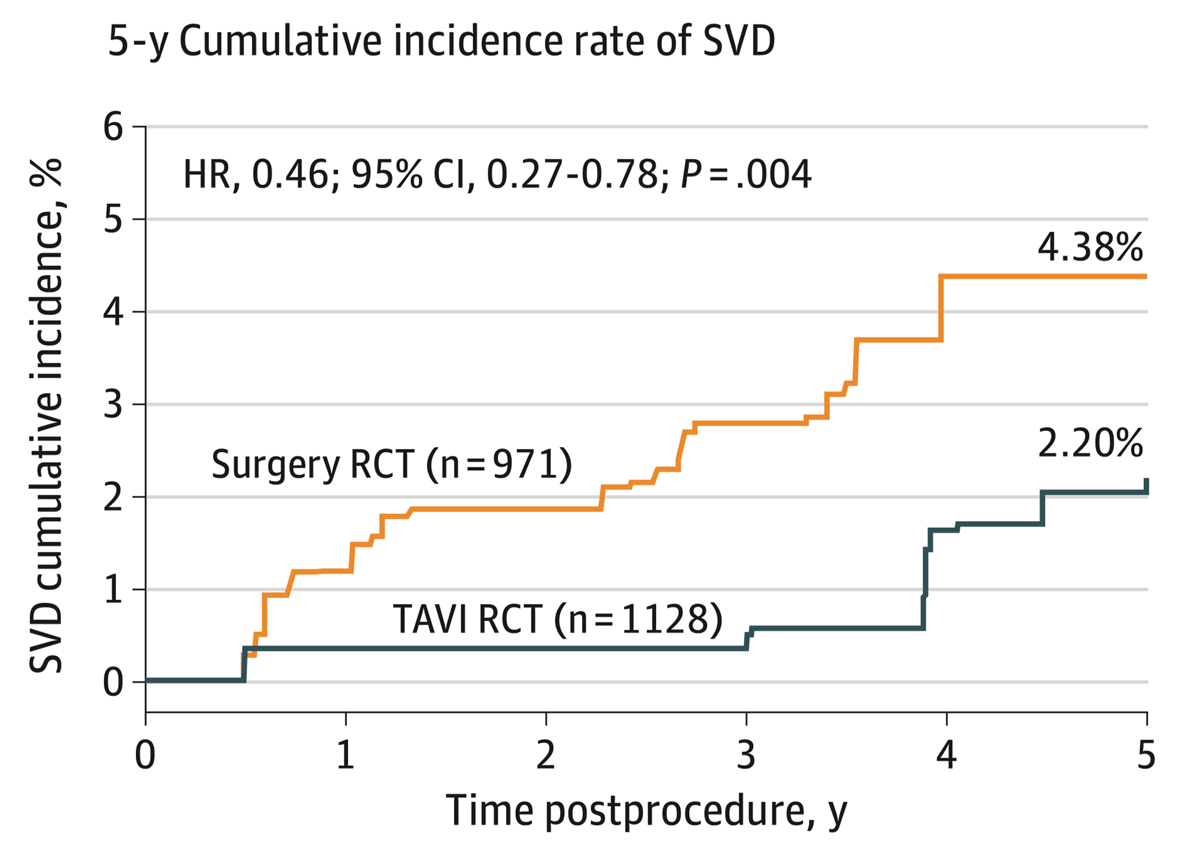
Figure 1
Five-year cumulative incidence rate of structural valve degeneration (SVD) in patients randomized to surgery or transcatheter aortic valve replacement (TAVI) from post hoc analysis pooled data from the CoreValve US High Risk Pivotal (n = 615) and SURTAVI (n = 1484) randomized clinical trials (RCTs). Reproduced with permission from JAMA Cardiol. Copyright©2023 American Medical Association. All rights reserved.58