
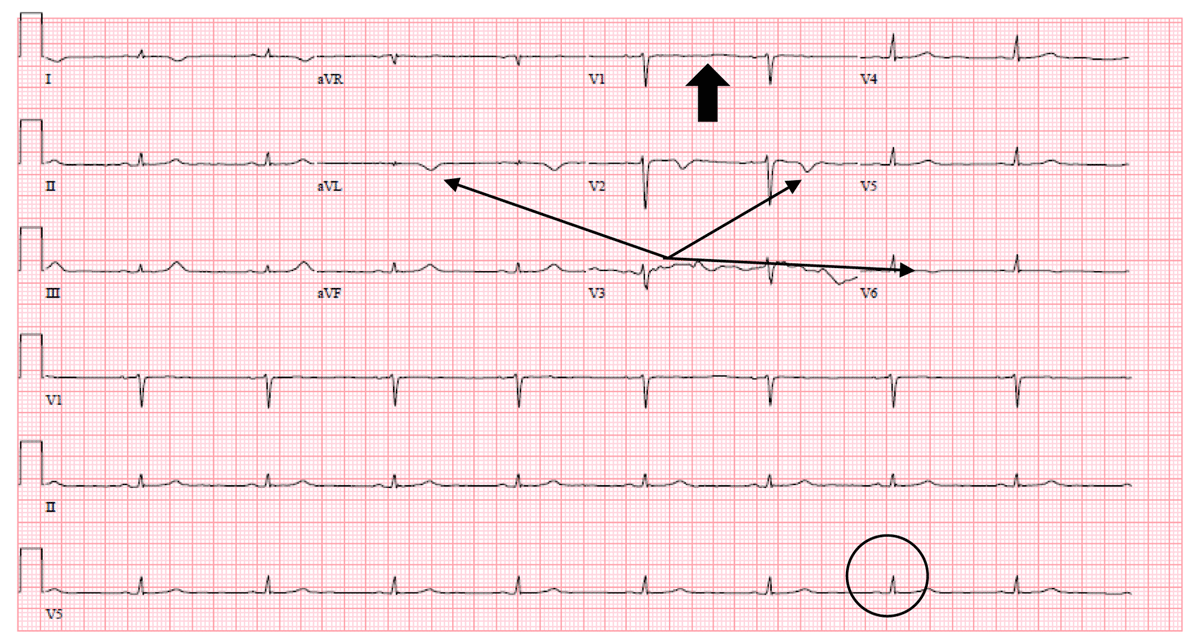
Figure 1
Electrocardiogram on postoperative day 1. Electrocardiogram shows sinus bradycardia with low-voltage QRS complexes (circle), T-wave inversions in leads aVL, V2, V6 (thin arrows), and T-wave flattening in V1(block arrow).
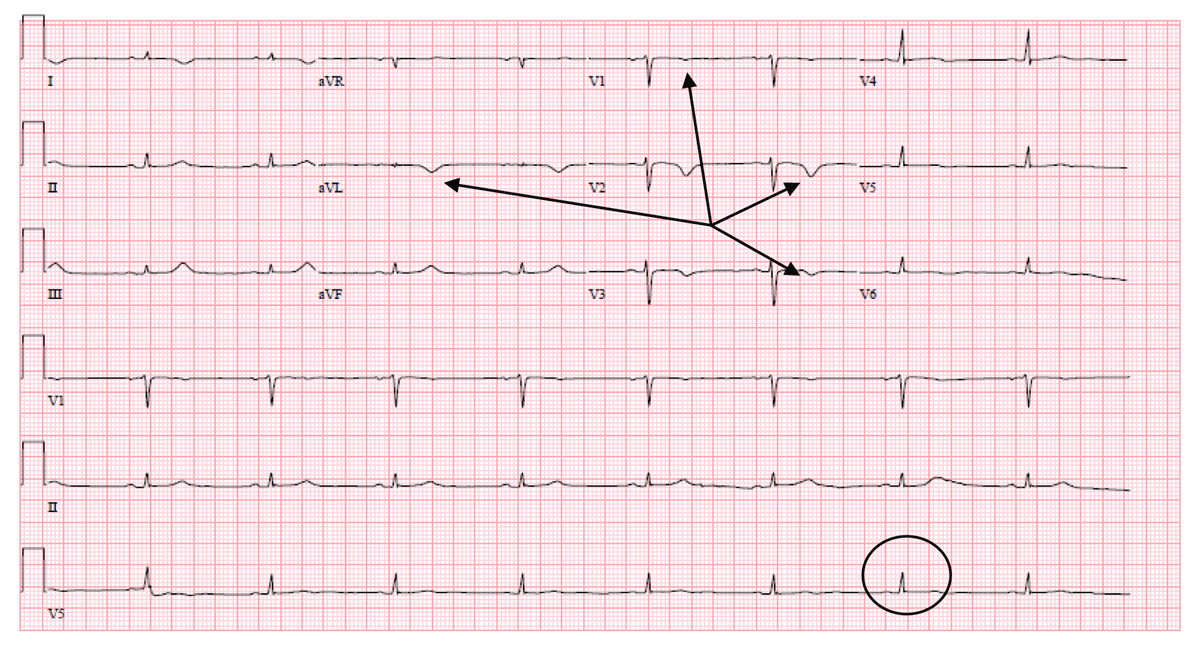
Figure 2
Electrocardiogram on postoperative day 2. Electrocardiogram shows sinus bradycardia with low-voltage QRS complexes (circle), T-wave inversions in leads aVL and V1-V3 (thin arrows).
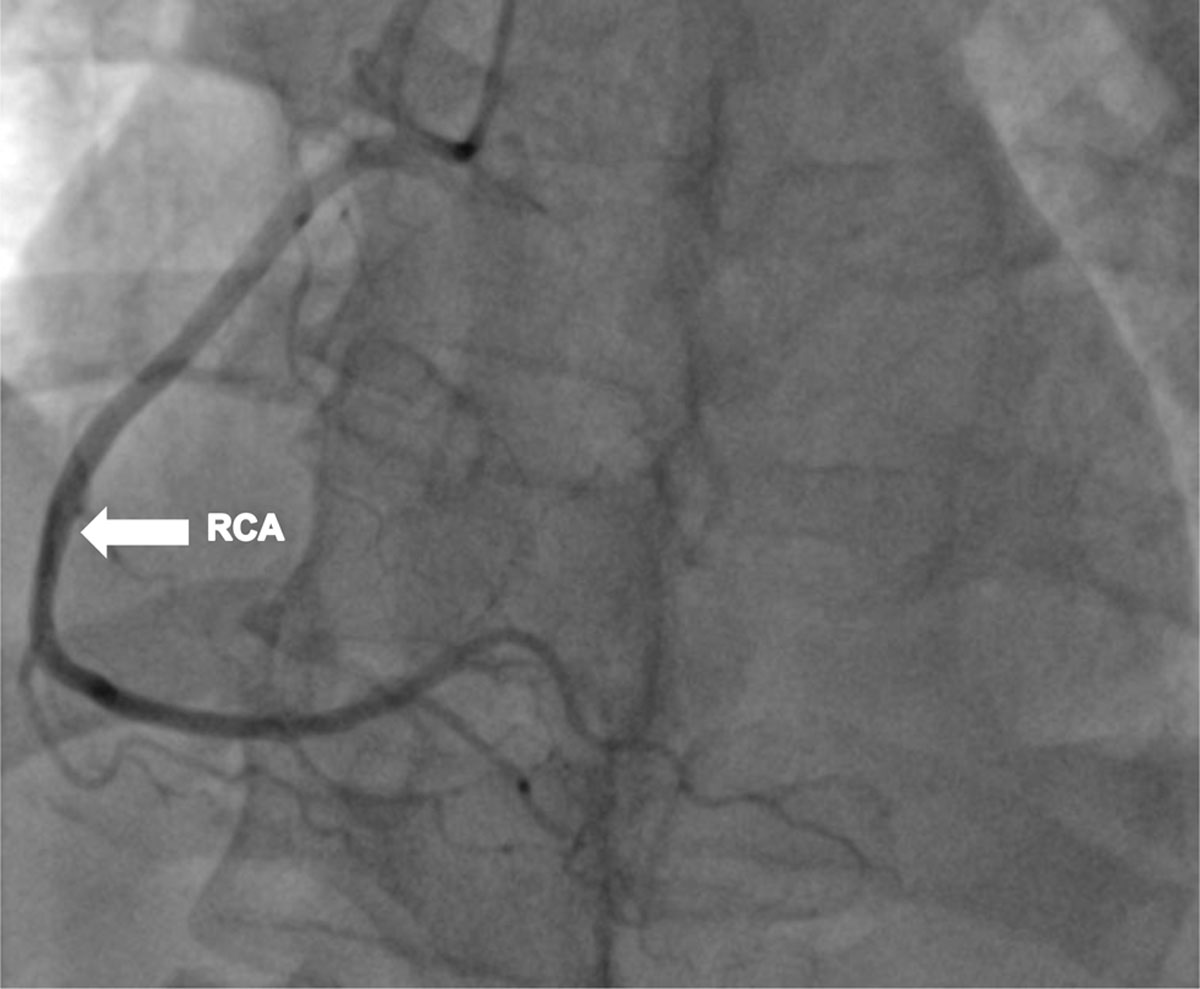
Figure 3
Cardiac catheterization on postoperative day 3. Left anterior oblique (LAO) cranial angulation view shows the right coronary artery along with its branches.
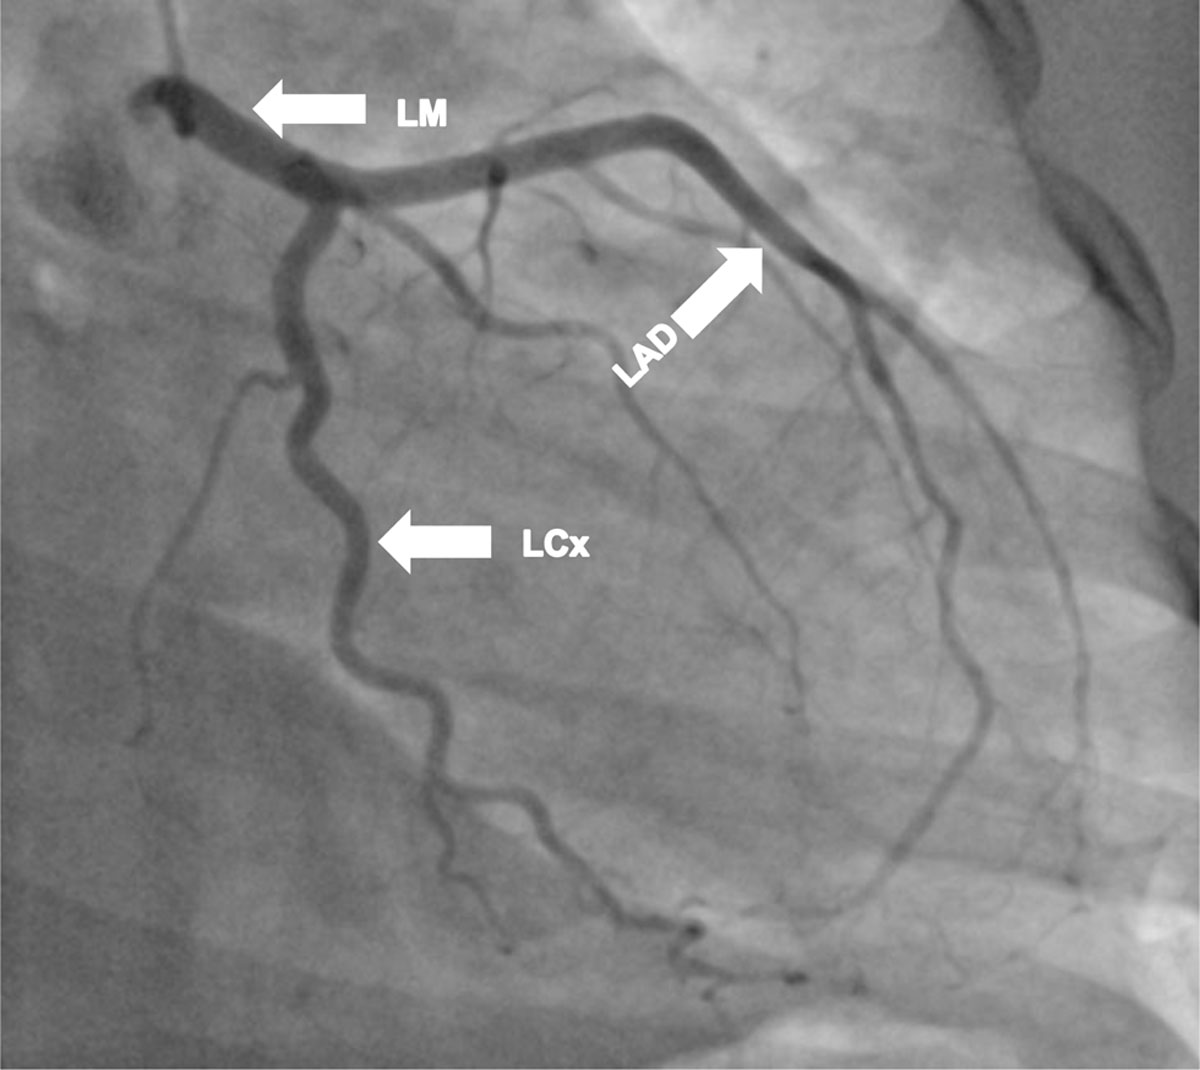
Figure 4
Cardiac catheterization on postoperative day 3. Right anterior oblique (RAO) caudal angulation view shows the left main (LM), left anterior descending (LAD) and left circumflex (LCx) arteries and its branches.
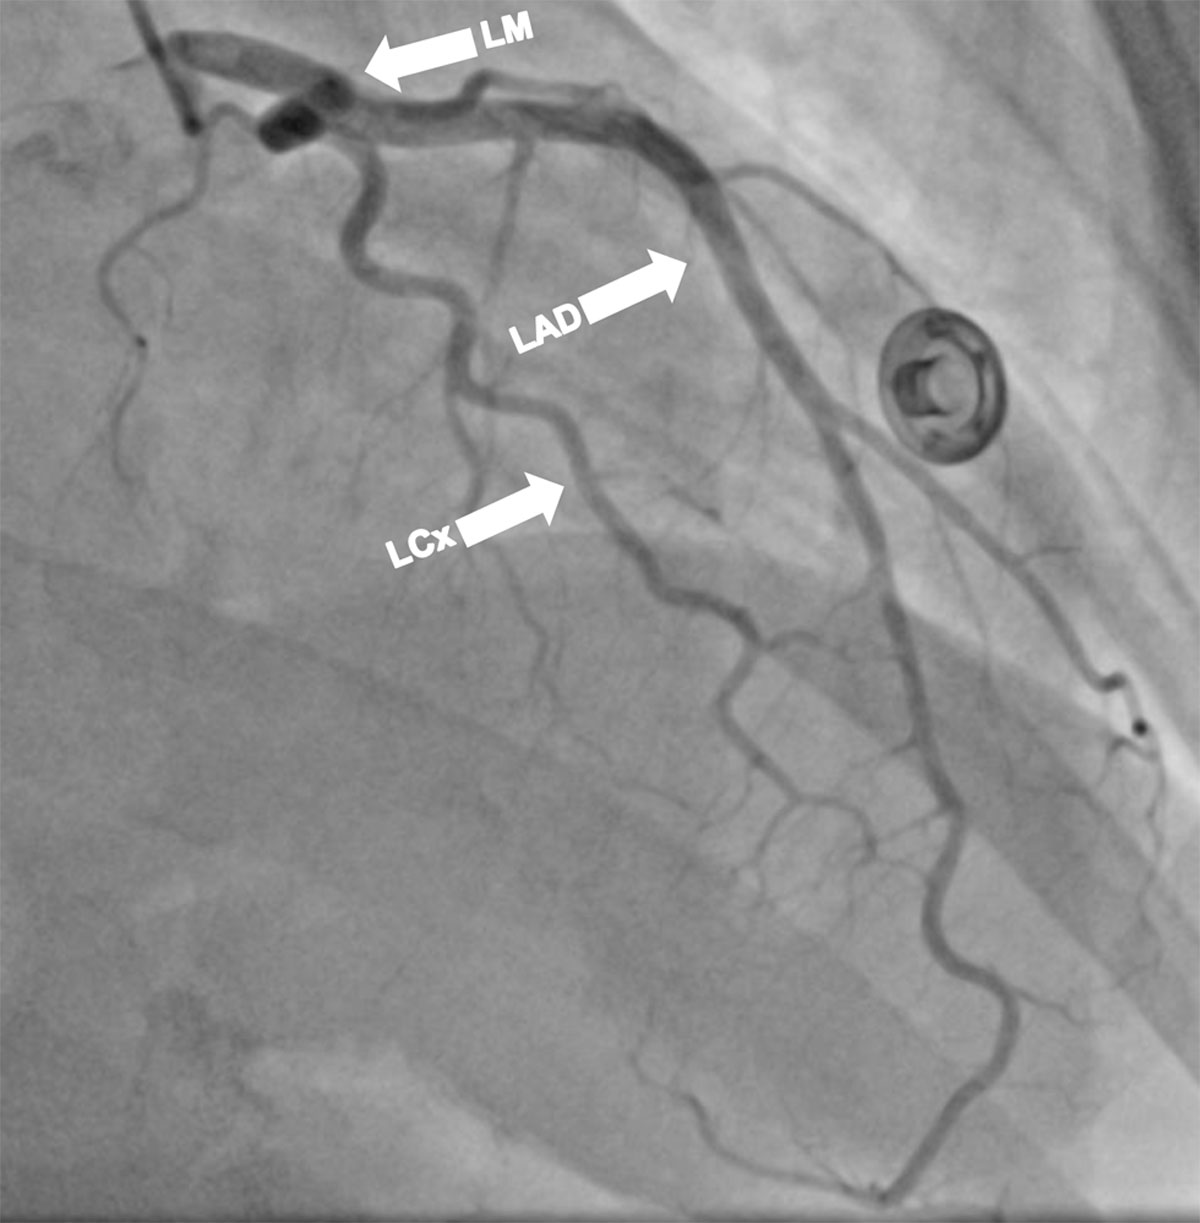
Figure 5
Cardiac catheterization postoperative day 3. Right anterior oblique (RAO) cranial angulation view shows the left main (LM), left anterior descending (LAD), and left circumflex (LCx) arteries along with its branches.
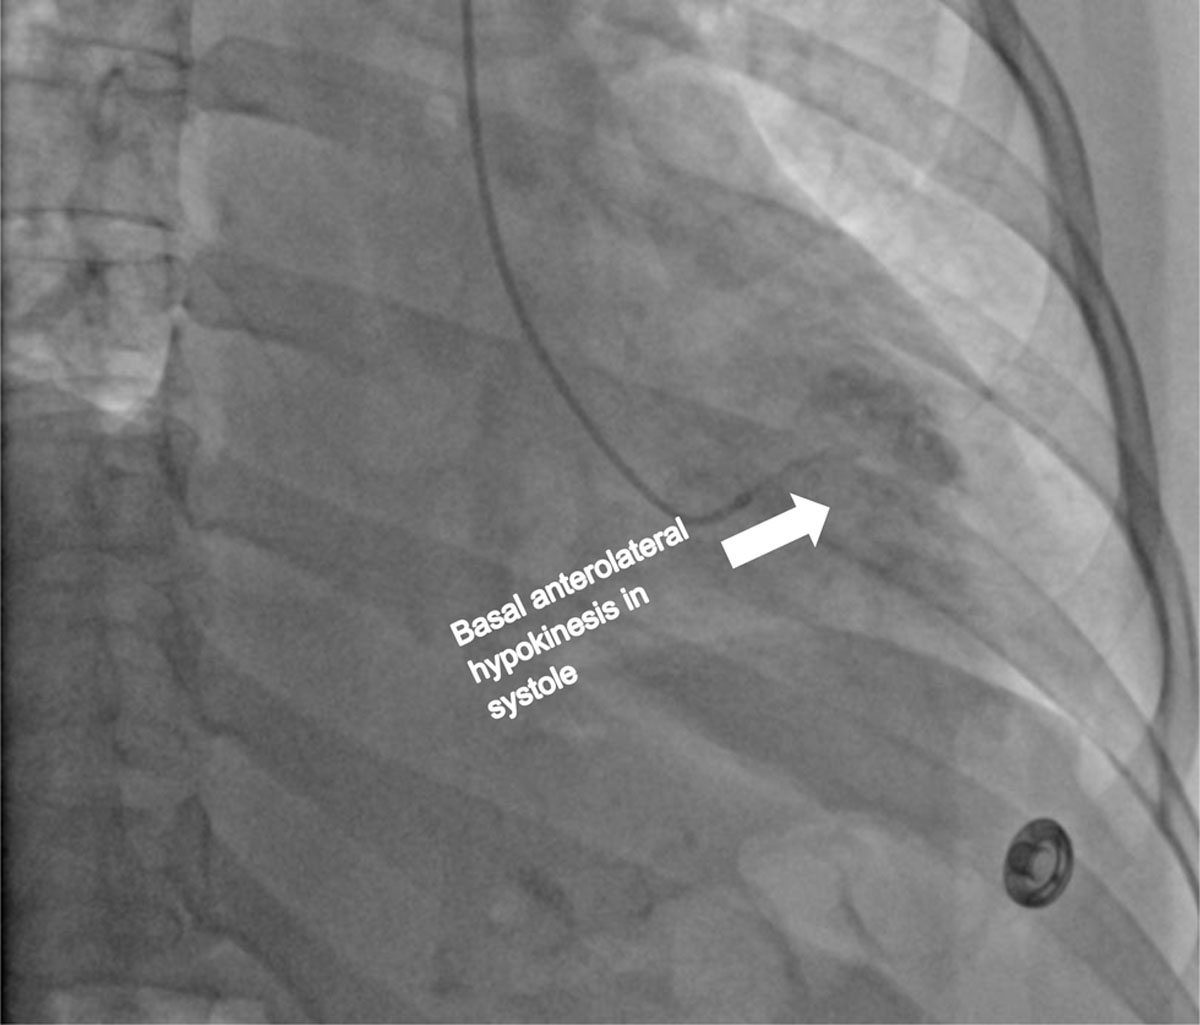
Figure 6
Left ventriculogram on postoperative day 3. Left anterior oblique (LAO) view shows the left ventricle and different segments during systole.
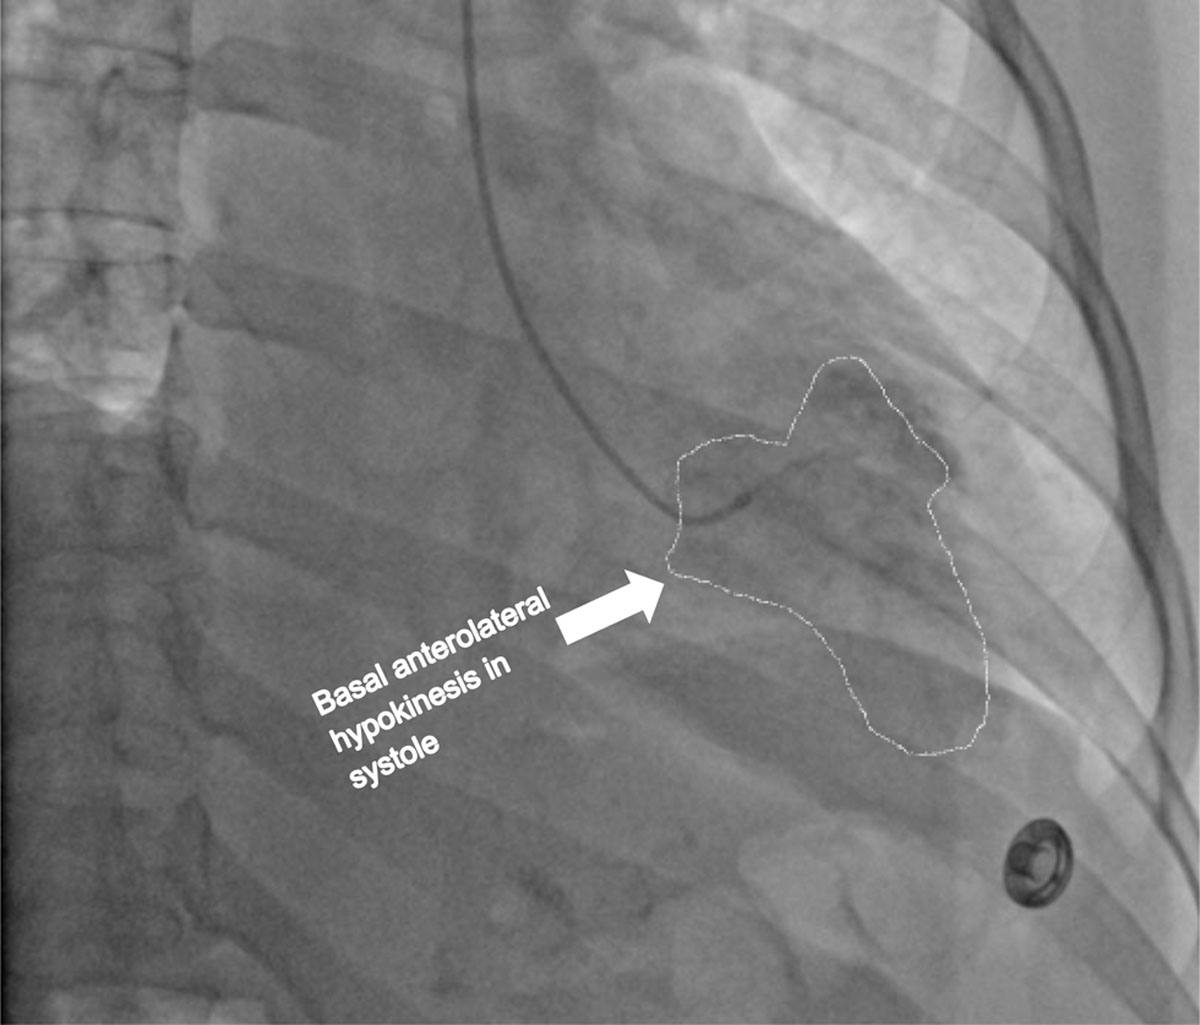
Figure 7
Left ventriculogram on postoperative day 3. Left anterior oblique (LAO) view shows the left ventricle and different segments during systole.
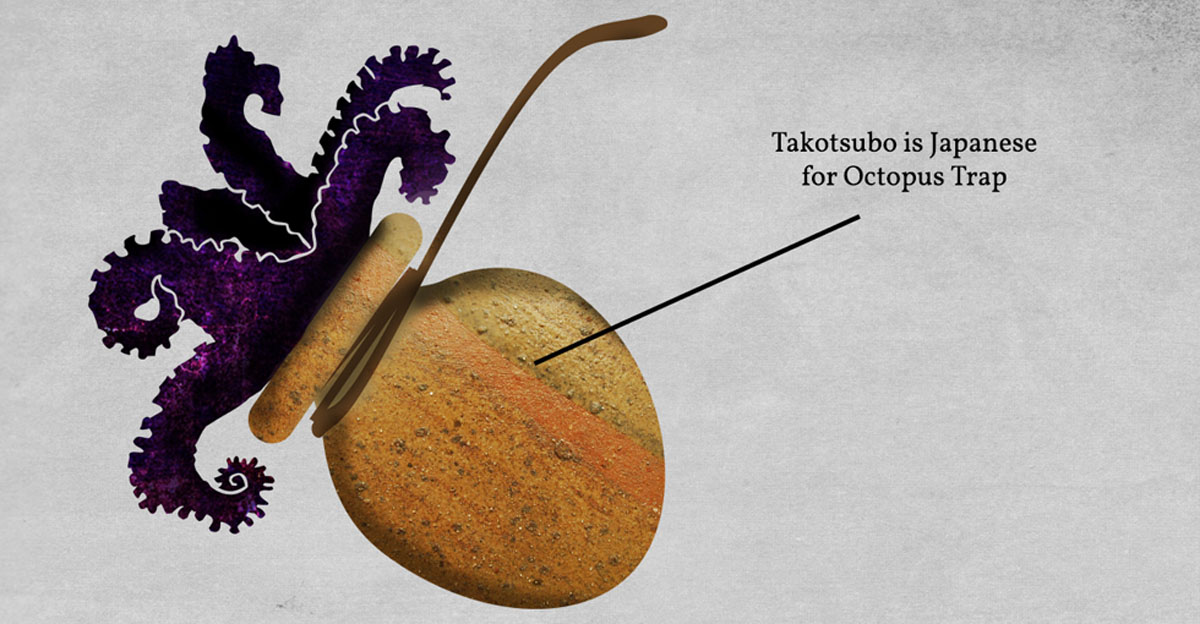
Figure 8
Takotsubo. Source: http://emdidactic.blogspot.com/2016/05/takotsubo-cardiomyopathy.html