
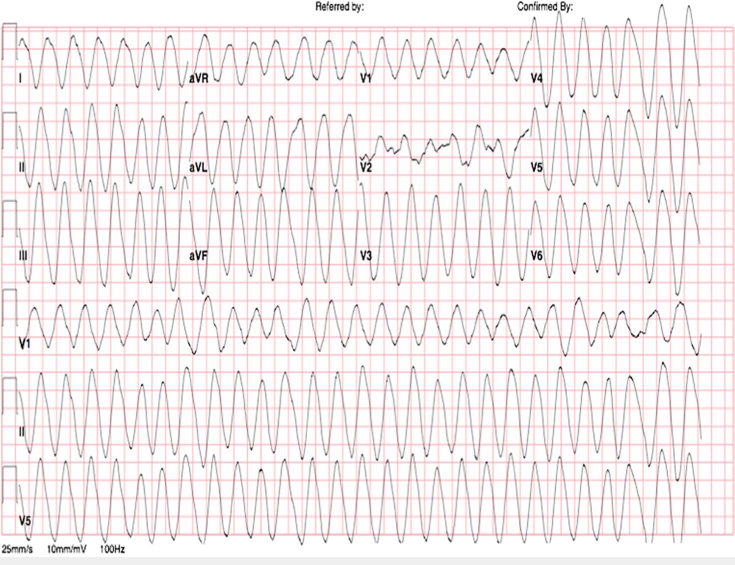
Figure 1.
Electrocardiogram showing polymorphic ventricular tachycardia.4 Reprinted with permission from Elsevier.
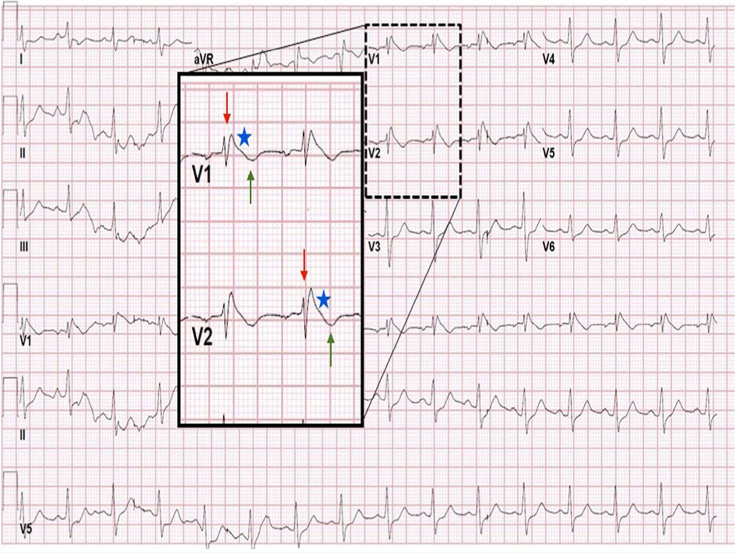
Figure 2.
Electrocardiogram showing sinus rhythm with right bundle branch pattern (red arrow), coved ST segment elevation (blue star), and inverted T waves (green arrow).4 Reprinted with permission from Elsevier.
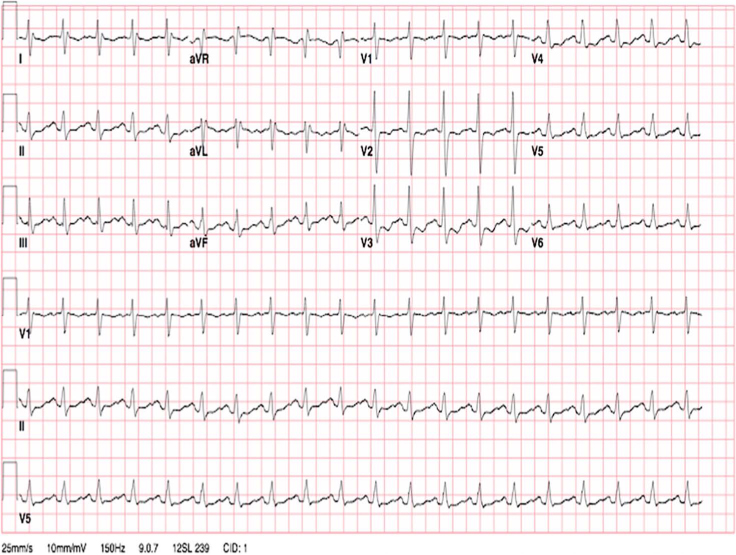
Figure 3.
Electrocardiogram showing resolution of Brugada phenotype after treatment with intravenous sodium bicardonate.4 Reprinted with permission from Elsevier.