
Figure 1.
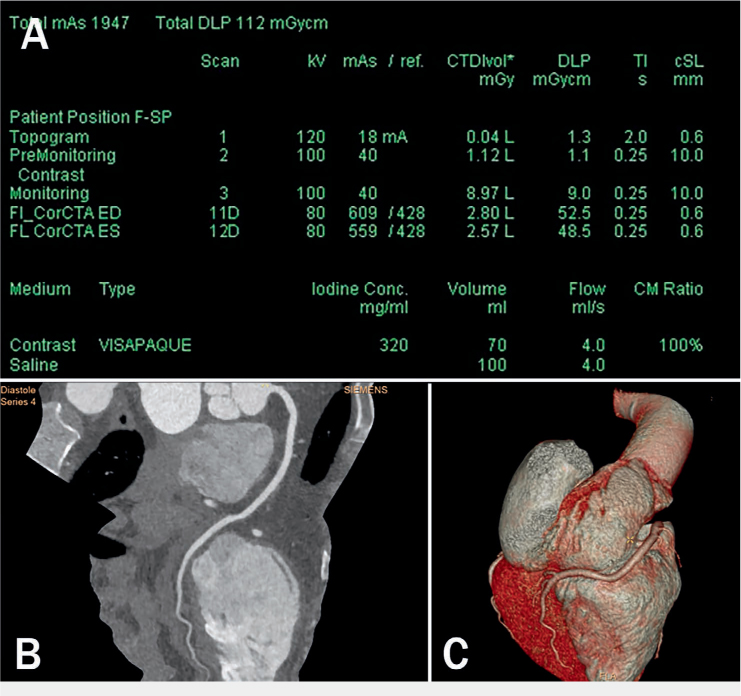
Technological advances. (A) Cardiac computed tomography angiography (CCTA) performed on a third-generation dual-source CT with the electrocardiograph-triggered high-pitch mode obtained at mid diastole (shown here) and systole with single 70-mL contrast bolus injection. Data acquisition of the entire z-axis of the adult heart was obtained within a fraction of one cardiac cycle (around 260 ms) with tube voltage of 80 kV and tube current of 560 mAs. The contrast injection rate was 4 mL/sec. Effective dose estimation by the dose length product (DLP) for each scan was around 50 mGy cm (effective dose of < 1 mSv). (B) Multiplanar reformation and (C) three-dimensional volume rendering of the right coronary artery in the same patient. The image quality of the coronary artery in spite of low-radiation-dose CT is optimal.
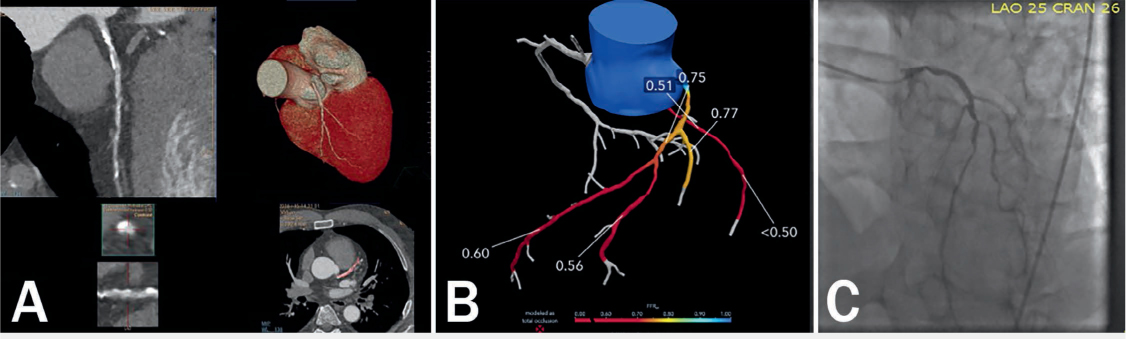
Figure 2.
Fractional flow reserve computed tomography (FFRCT) case of a 58-year-old man. (A) Multiplanar reformation of the coronary computed tomography angiograph (CTA) demonstrating calcified and noncalcified atherosclerotic plaque in the proximal and mid left anterior descending artery associated with positive remodeling. Note the moderate stenosis in the proximal lesion with calcified plaque and moderate-to-severe stenosis in the mid lesion with predominantly noncalcified plaque. (B) FFRCT analysis added to coronary CTA to assess the hemodynamic significance. FFRCT across the proximal left anterior descending coronary artery (LAD) was 0.75 and across the mid and distal lesion was 0.60, suggesting the likelihood of hemodynamic significance. (C) Invasive coronary angiography showed sequential lesions from the proximal to mid LAD with the mid LAD lesion having an instantaneous wave-free ratio value of 0.72.
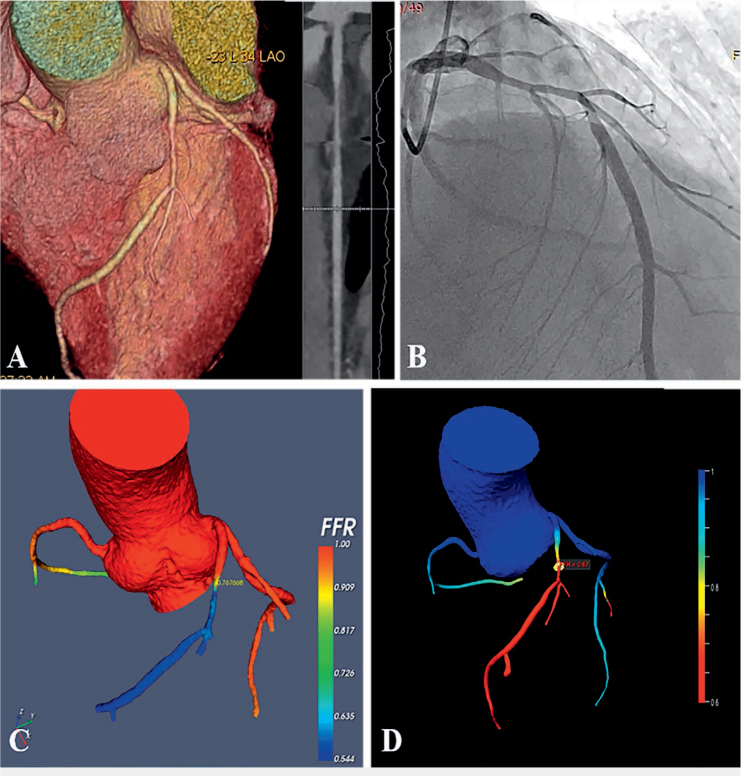
Figure 3.
Fractional flow reserve computed tomography (FFRCT) case of a 58-year-old man with recurrent chest pain for 2 months. (A) Coronary computed tomography angiography (CCTA) showed the presence of noncalcified plaque and moderate stenosis (70%) in proximal and mid-left anterior descending artery (LAD). (B) Invasive coronary angiography (ICA) showed LAD had a long lesion with 70% stenosis. (C) FFRCT calculated with computational fluid dynamics (CFD). (D) FFRCT using machine learning algorithm. The FFRCT values with CFD and machine learning were 0.76 and 0.67, respectively. Both were positive with different value. The invasive catheter-derived FFR (as the gold standard) was 0.74. The patient was treated with a stent placed in the LAD.
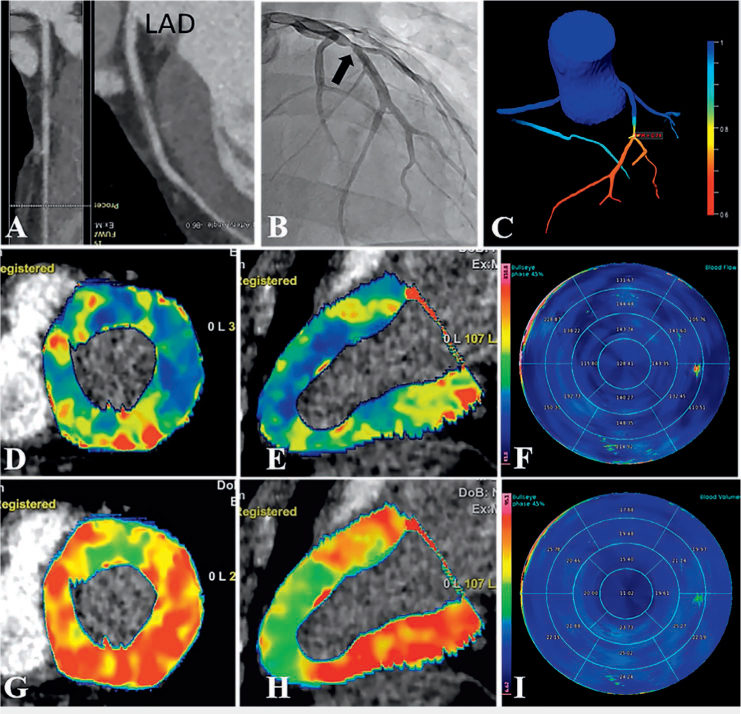
Figure 4.
Functional coronary computed tomography angiography (CCTA) imaging: Case of 28-year-old man with precordial discomfort for 1 month. (A) CCTA images showed the presence of noncalcified plaque and > 70% stenosis in proximal left anterior descending artery. (B) Invasive coronary angiography images confirmed the left anterior descending artery stenosis as about 70%. (C) CT-derived fractional flow reserve (FFRCT) computed using machine learning algorithm; the FFRCT was positive of 0.74. (D, G) Short-axis images of myocardial blood flow (MBF) and myocardial blood volume (MBV) in adenosine-stress dynamic CT perfusion (CTP); the stressed dynamic CTP images manifested the reduced values of MBF and MBV in the apical and middle segments of the anterior and lateral wall. (E, H) Long-axis of CTP images showed reduced values of both MBF and MBV on apical and anterior wall of the left ventricle. (F, I) Bulls-eye diagram images show the quantitative values of both MBF and MBV. Courtesy of Drs. Na Zhao and Yang Gao.
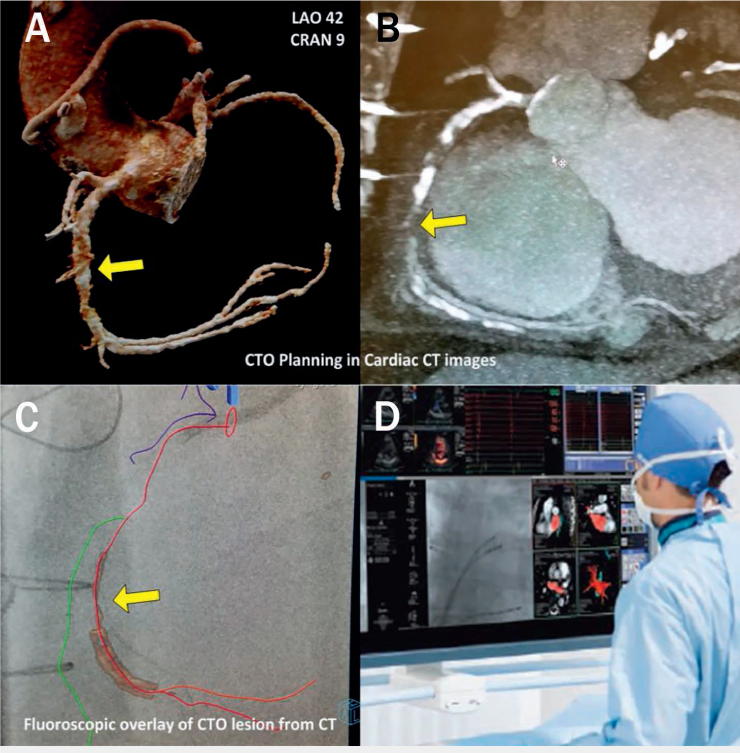
Figure 5.
Computed tomography (CT)-guided percutaneous coronary intervention (PCI) of a chronic total occlusion (CTO) during a live case in the cath lab. A shows three-dimensional anatomy of the coronary arteries derived from CT angiography (CTA). B is the multiplanar reformation of a coronary CTA of the right coronary artery (RCA) demonstrating severe calcification with diffuse plaque in the entire RCA and chronic total occlusion in the mid segment. This facilitates identification of projections without foreshortening for each respective vessel segment. C demonstrates the CTA and fluoroscopic data combined to show coronary segments and visualization of the occluded segment in the cath lab. D shows this data in a road map during a CT-guided PCI of a CTO.