
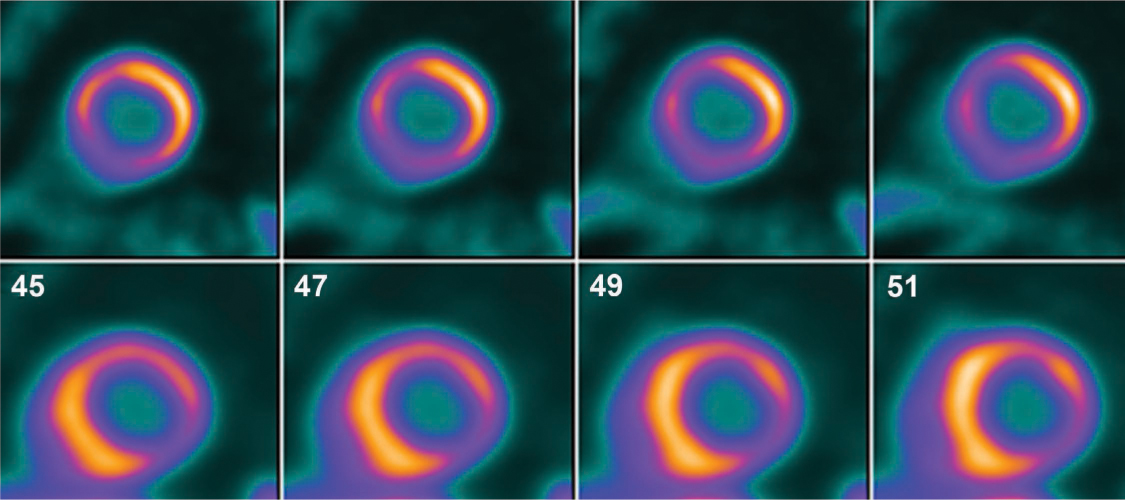
Figure 1.
An example of a perfusion-metabolism mismatch. The lower row shows the perfusion images with a large anterolateral and inferolateral perfusion defect that has normal metabolic activity (as seen on metabolic images using fluorodeoxyglucose positron emission tomography imaging on the upper row). The anterolateral and inferolateral walls are viable.
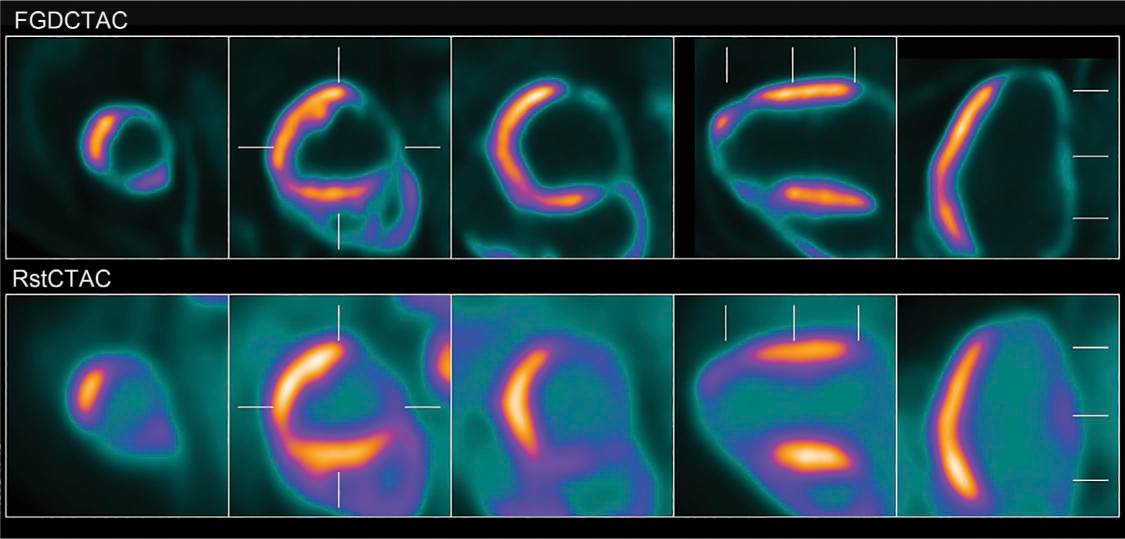
Figure 2.
Matched defect between perfusion and metabolic images. There is a severe perfusion defect in the entire inferior wall and apical walls, with no fluorodeoxyglucose (FDG) uptake in the same area of perfusion defect, suggesting near-transmural scarring in this territory. CTAC: computed tomography attenuation correction.
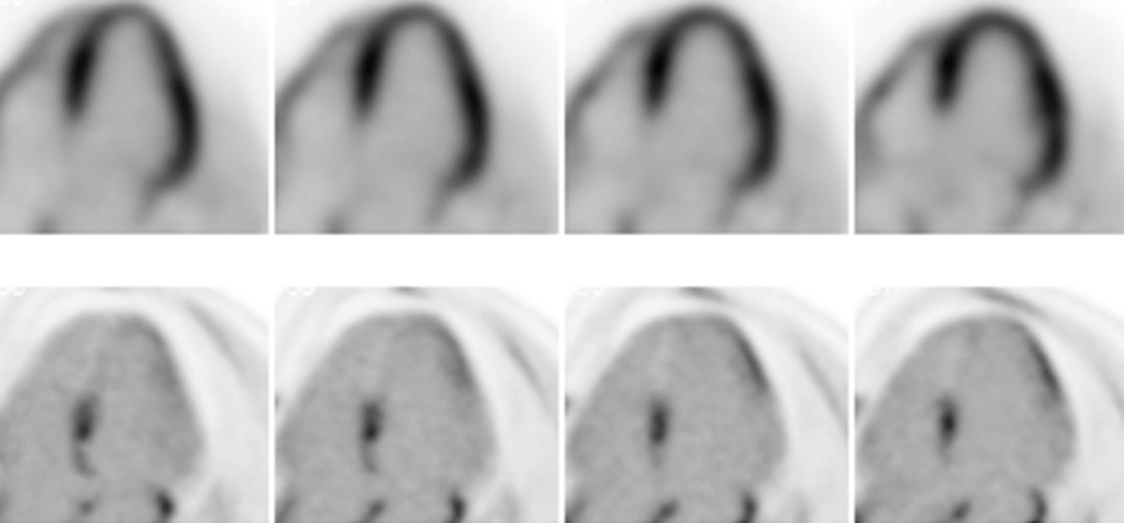
Figure 3.
Fluorodeoxyglucose positron emission tomography (FDG-PET) imaging in a patient with suspected cardiac sarcoidosis. Upper rows are FDG images; lower rows are perfusion images. Notice the perfusion defects in the basal septum, proximal anterior wall and apical segments. There is significant FDG uptake in the areas of the perfusion defects, indicating active inflammation.
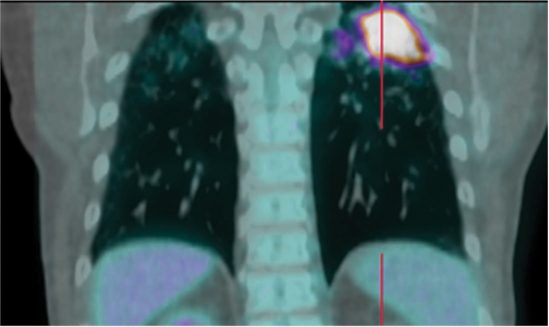
Figure 4.
Fluorodeoxyglucose positron emission tomography (FDG-PET) imaging in a patient with known pulmonary sarcoidosis. There is severe intense uptake in the left upper lobe of the lung. This patient had no FDG uptake in the myocardium.