
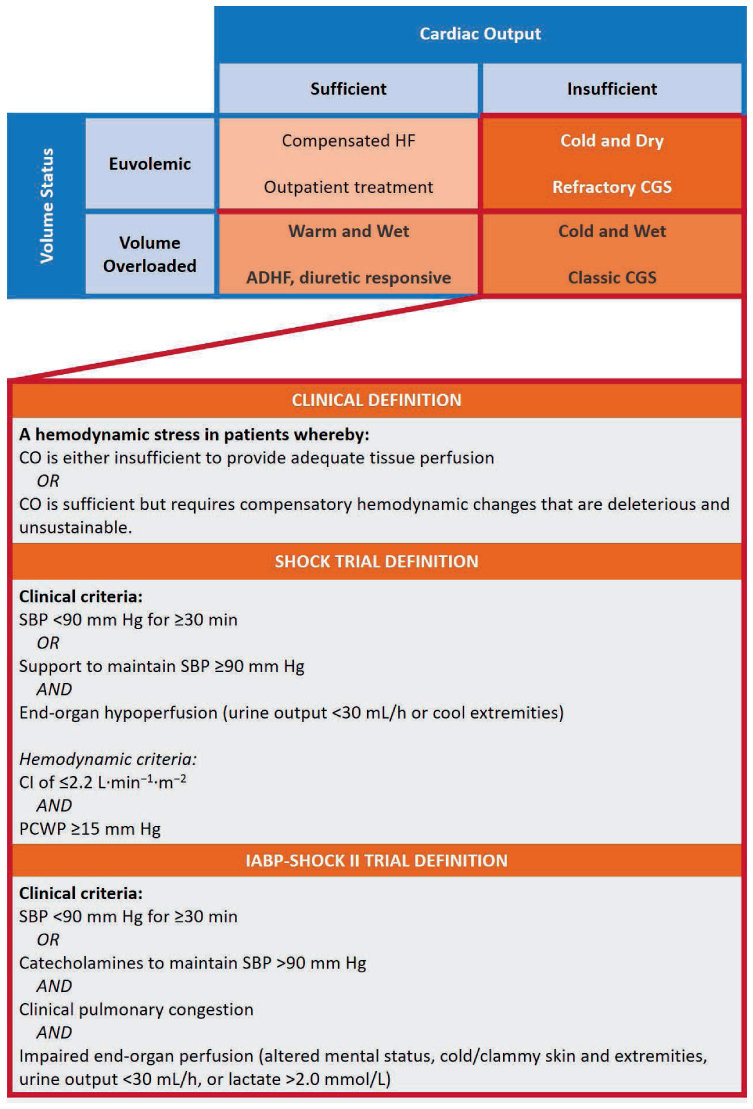
Figure 1.
The Stevenson model for conceptualizing acutely decompensated heart failure according to volume status and cardiac output, and definitions for cardiogenic shock from the SHOCK and IABP-SHOCK II trials. Reprinted with permission.5
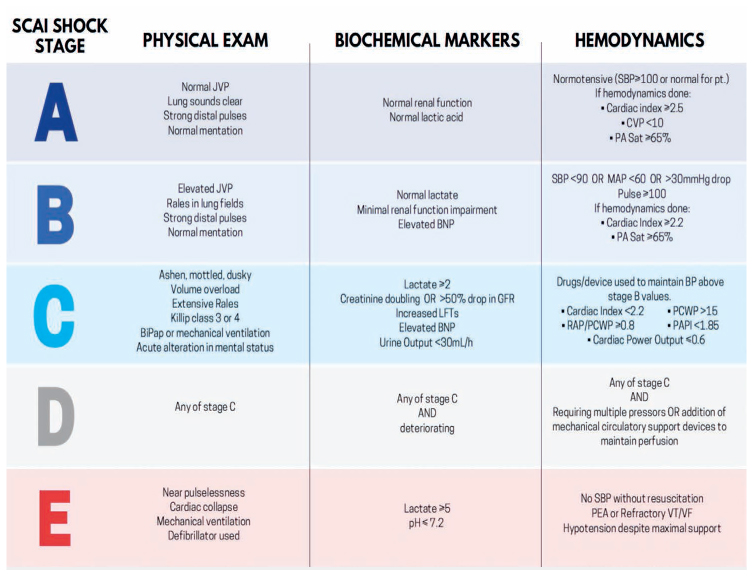
Figure 2.
The recently released Society for Coronary Angiography and Intervention schema for categorizing patients with cardiogenic shock. Reprinted with permission.8 JVP: jugular venous pressure; SBP: systolic blood pressure; CVP: central venous pressure; PA Sat: pulmonary artery oxygen saturation; BNP: brain natriuretic peptide; RAP: right atrial pressure; PCWP: pulmonary capillary wedge pressure; PAPI: pulmonary artery pulsatility index; PEA: pulseless electrical activity; VT/VF: ventricular tachycardia/ventricular fibrillation.
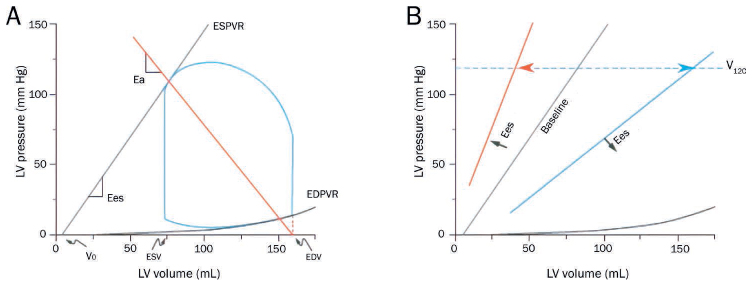
Figure 3.
(A) The normal pressure-volume loop is bounded by the end-systolic pressure-volume relationship (ESPVR) and end-diastolic pressure-volume relationship (EDPVR). ESPVR is approximately linear with slope, Ees, and volume-axis intercept, Vo. Effective arterial elastance (Ea) is the slope of the line extending from the end-diastolic volume (EDV) point on the volume axis through the end-systolic pressure-volume point of the loop. (B) The ESPVR shifts with changes in ventricular contractility, which can be a combination of changes in Ees and Vo. Changes in contractility can be indexed by V120, the volume at which the ESPVR intersects 120 mm Hg. Reprinted with permission.19
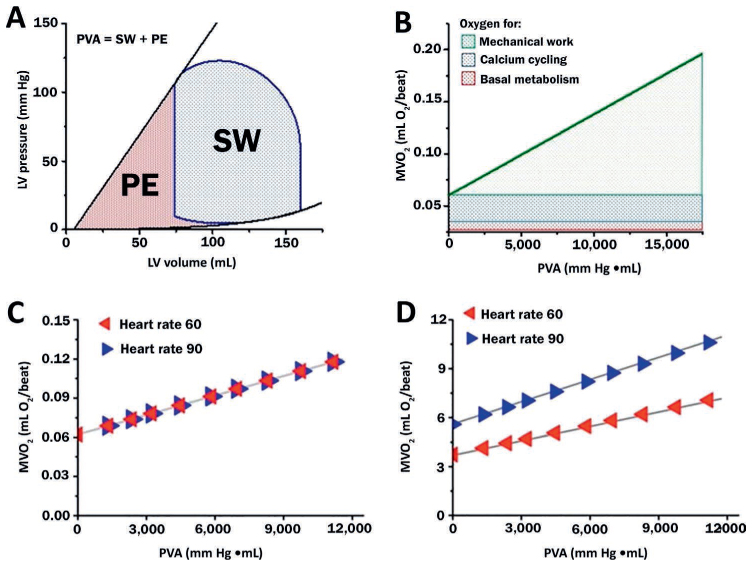
Figure 4.
(A) Pressure-volume area (PVA) is the sum of stroke work (SW, the area bounded within the PV loop) and potential energy (PE, area bounded by the end-systolic pressure-volume relationship and end-diastolic pressure-volume relationship). (B) Myocardial oxygen consumption (MVO2) is linearly correlated with PVA and is divided into 3 major components. (C) Heart rate has a minimal impact on the beat-to-beat relationship between PVA and MVO2, (D) but these small differences are amplified when considering the relationship between PVA and MVO2 per minute. Burkhoff D, Dickstein ML, Schleicher T. Harvi – Online. Retrieved from http://harvi.online. Date of access: 2019 Nov 21. LV: left ventricular
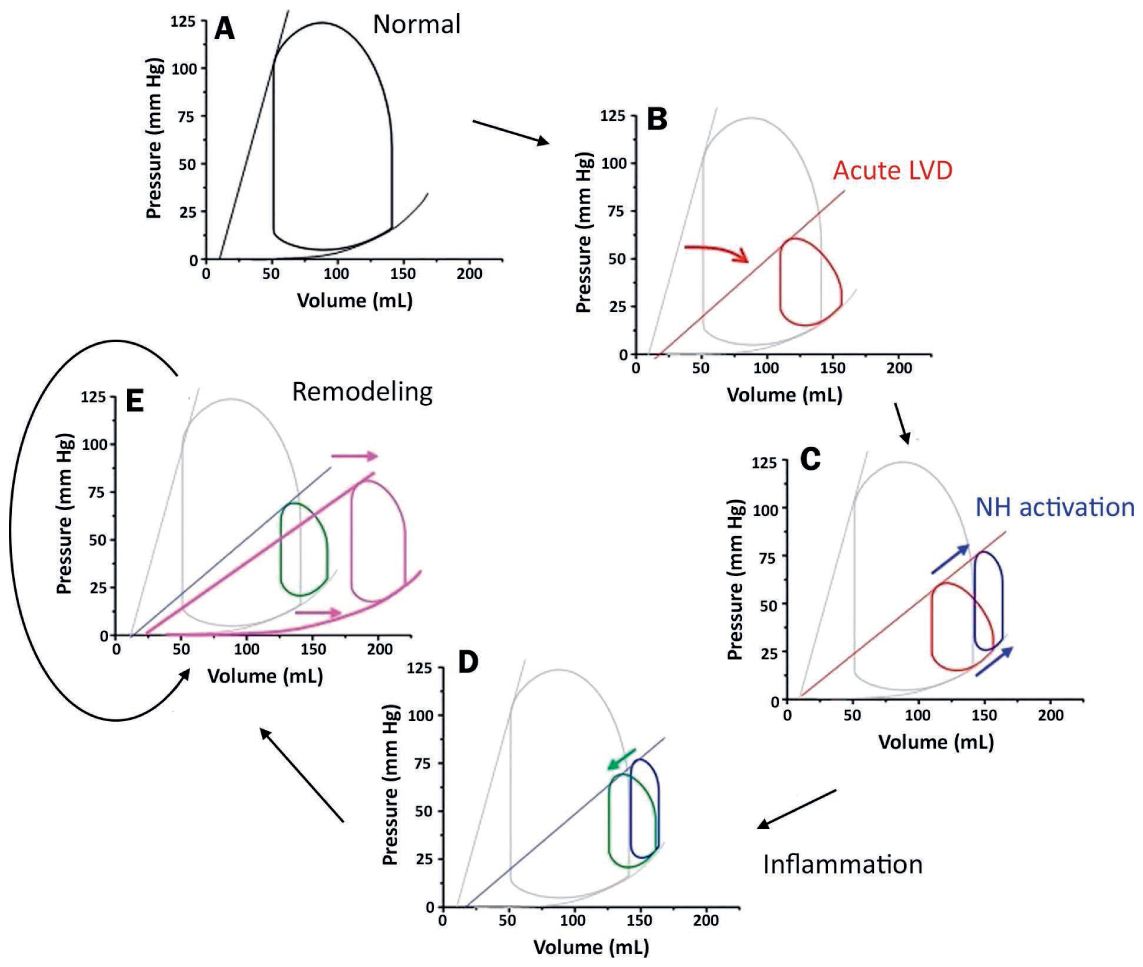
Figure 5.
The pathophysiology of cardiogenic shock illustrated by pressure-volume (PV) loops. (A) The normal PV loop; (B) the PV loop reflecting changes following an acute myocardial infarction (red); (C) changes caused by autonomic response to decreased contractility (blue); (D) changes caused by release of inflammatory mediators (green); (E) the PV loop reflecting manifestations of cardiac remodeling (pink) with changes in both the end-systolic and end-diastolic pressure-volume relationships. Reprinted with permission.23
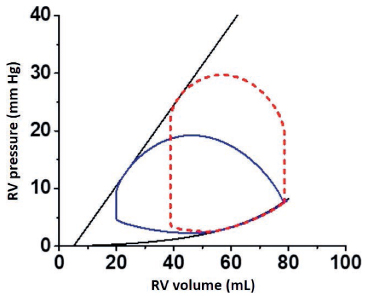
Figure 6.
The normal right ventricular (RV) pressure-volume (PV) loop (solid blue line) compared to the normal left ventricular (LV) PV loop (red dashed line). The slope of the RV end-systolic pressure-volume relationship is shallower and systolic pressures are less than those seen in the LV PV loop. The right and left ventricular end-diastolic pressure-volume relationships are similar. Burkhoff D, Dickstein ML, Schleicher T. Harvi – Online. Retrieved from http://harvi.online. Date of access: 2019 Nov 21.