
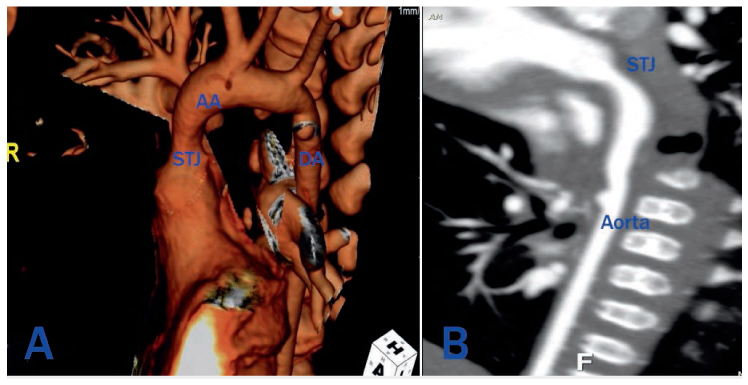
Figure 1.
(A) Three-dimensional reconstruction and (B) maximum intensity projection image showing hourglass narrowing starting at the sinotubular junction extending to the ascending aorta. The entire aorta appears small in caliber.
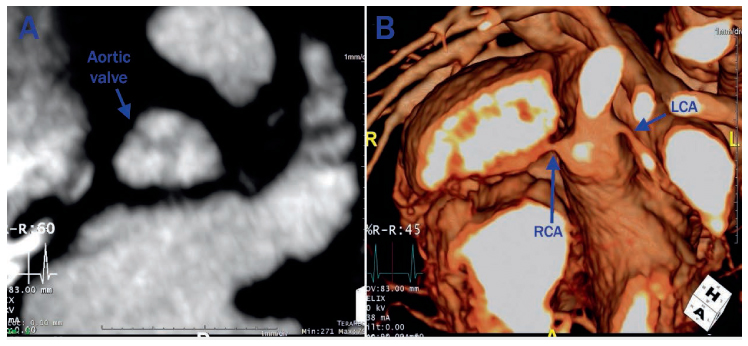
Figure 2.
(A) Maximum intensity projection image of aortic valve showing thickening of leaflets. (B) Three-dimensional reconstruction image showing high origin of the left circumflex anterior artery from narrowed sinotubular junction.
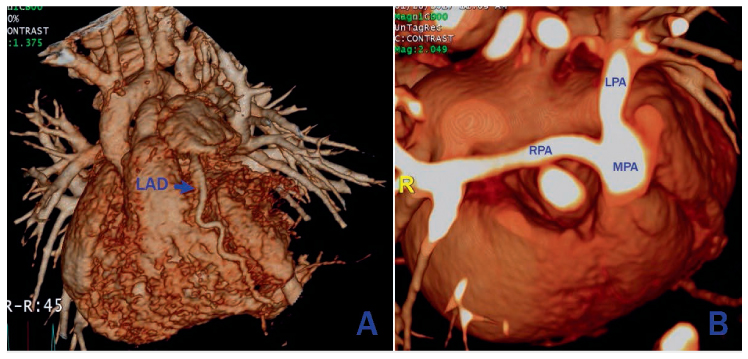
Figure 3.
(A) Three-dimensional (3D) reconstruction showing dilated and tortuous left anterior descending artery. (B) 3D reconstruction image showing small pulmonary arteries.
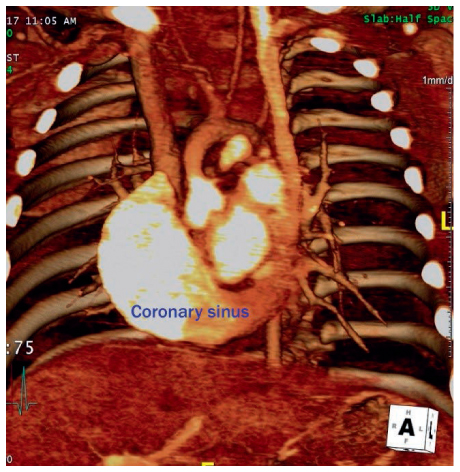
Figure 4.
Three-dimensional reconstruction image showing double superior vena cava (SVC) with left SVC draining into coronary sinus.