
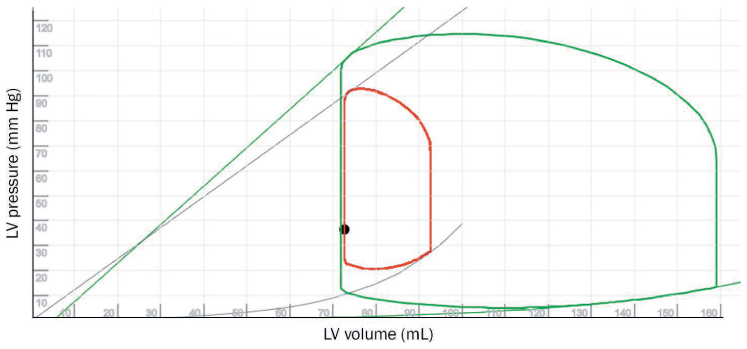
Figure 1.
Pressure-volume (PV) loop showing a normal left ventricle (LV; green loop) and LV with acute cardiogenic shock with a comparatively restrictive pattern (red loop). The grey and green lines represent contractility (end-systolic PV relationship; ESPVR) and grey and green curves represent ventricular elastance (end-diastolic PV relationship; EDPVR). See Online Video 1.
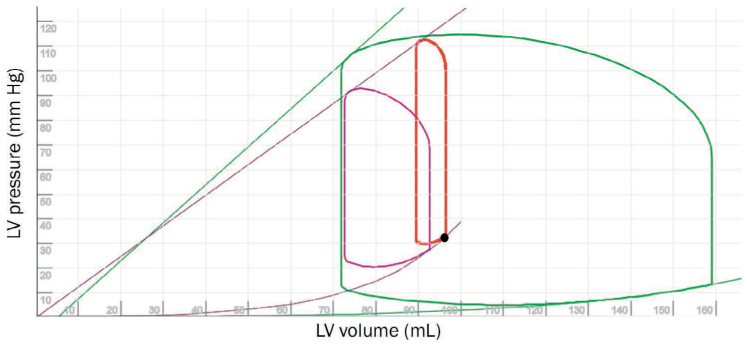
Figure 2.
Pressure-volume (PV) loop showing the impact of extracorporeal membrane oxygenation in a poorly functioning left ventricle (LV; red loop). While the systemic arterial pressure has increased compared to the cardiogenic shock state (purple loop), the end-diastolic volume has increased with a significant increase in afterload (red loop). The green loop represents a normally functioning heart. Purple and green lines represent contractility (end-systolic PV relationship; ESPVR) and purple and green curves represent ventricular elastance (end-diastolic PV relationship; EDPVR). See Online Video 2.
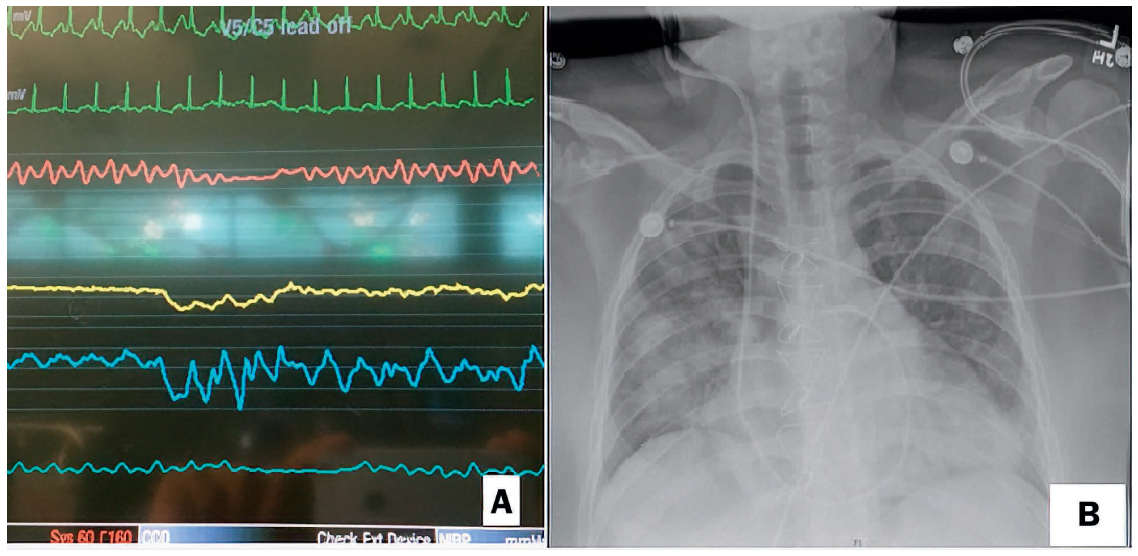
Figure 3.
(A) Bedside monitor shows intermittent loss of pulsatility with extracorporeal membrane oxygenation and inotrope support. (B) Chest x-ray shows congested lungs due to high left ventricular end-diastolic pressure.
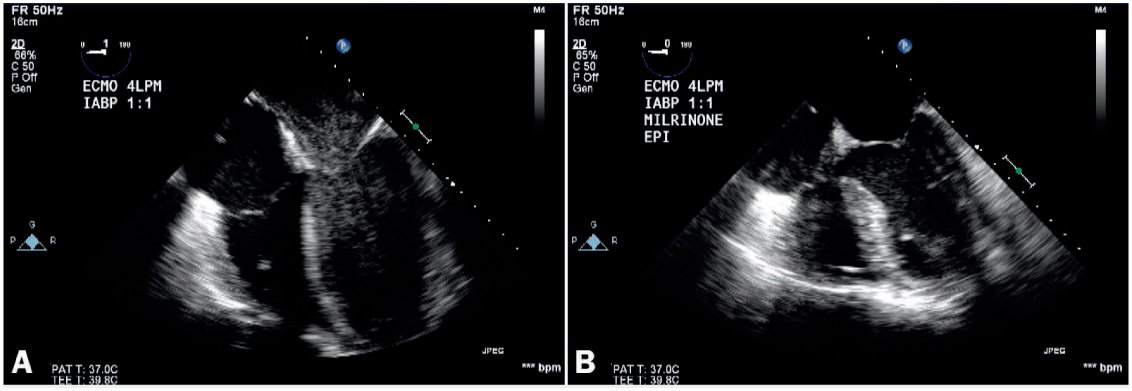
Figure 4.
Transesophageal echocardiogram, midesophageal four-chamber view, of a patient on extracorporeal membrane oxygenation (without an unloading device) showing (A) stagnation with smoke at baseline that (B) resolves on promoting contractility with milrinone, reflecting the importance of aortic valve opening.
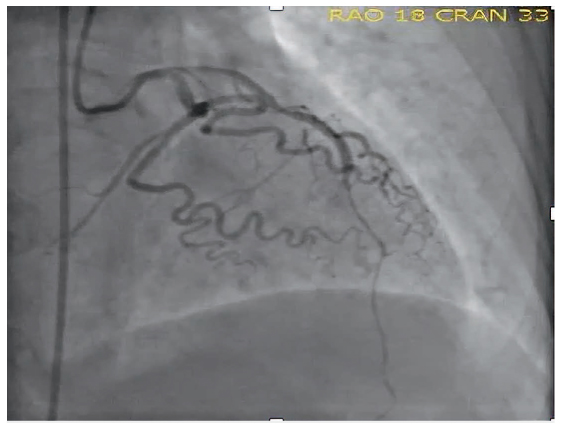
Figure 5.
Coronary angiography of patient's left coronary system. Note the residual poor perfusion in the diffusely diseased distal left anterior descending artery.
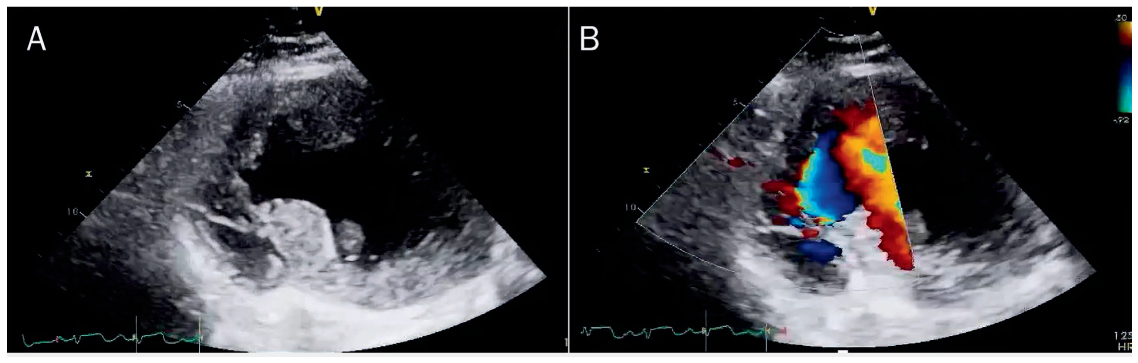
Figure 6.
Transthoracic echocardiogram, parasternal short-axis view, demonstrates (A) evidence of interruption of the interventricular septum and (B) color Doppler through the existent gap.
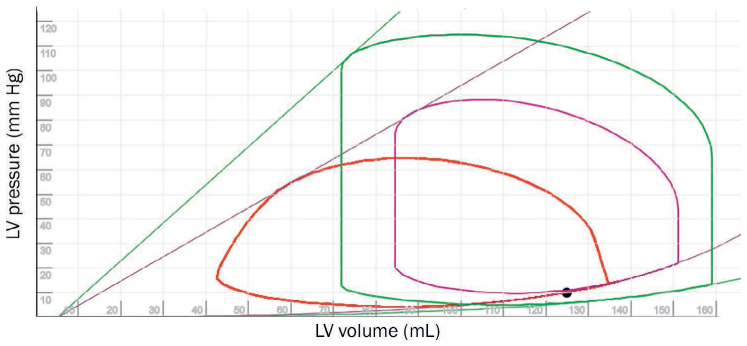
Figure 7.
Pressure-volume (PV) loops illustrating the physiology of a ventricular septal defect (VSD). The green PV loop represents the normal state, the purple loop represents an acute heart failure state, and the red loop represents a VSD in the setting of acute heart failure. Note that the onset of a VSD has changed the shape of the PV loop, reflective of decreased afterload, shortened isovolumetric time, and higher stroke volume. Although the lines for end-systolic PV relationship (ESPVR; straight lines) and end-diastolic pressure-volume relationship (EDPVR; bottom curves) are different compared to normal PV loop, they are the same for acute heart failure with and without a VSD, suggesting that the true myocardial properties have not changed. See Online Video 3. LV: left ventricle.
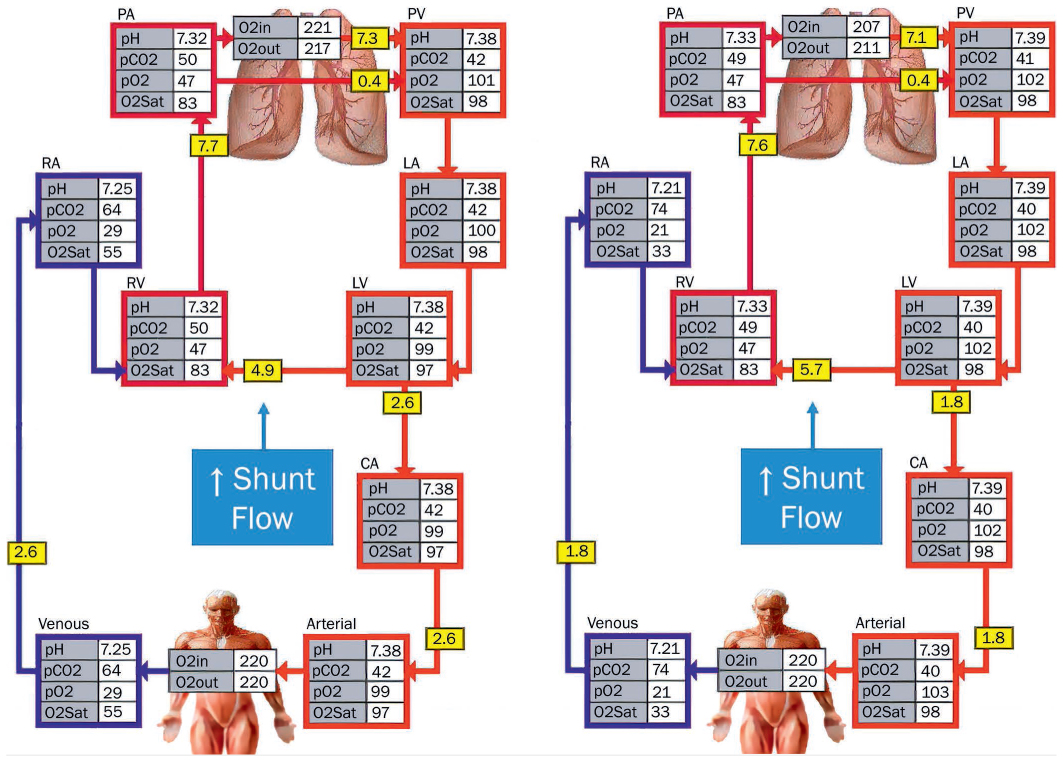
Figure 8.
(A) Physiological schematic representing a ventricular septal defect (VSD) with shunt flow of 4.9 L/min with a step-up in oxygenation from the left to right ventricle. (B) With increasing norepinephrine and afterload on the left ventricle, the shunt flow increases to 5.7 L/min while the forward cardiac output to the systemic circulation drops from 2.6 L/min at baseline to 1.8 L/min. See Online Video 8.
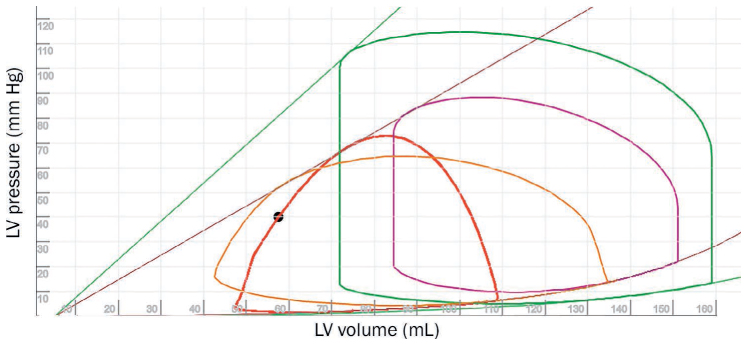
Figure 9.
Pressure-volume (PV) loops illustrating the physiology of a ventricular septal defect (VSD). The green PV loop represent a normal state, purple PV loop represents acute heart failure, and the orange loop represents VSD on the setting of acute heart failure. When a TandemHeart device is placed in a patient with VSD, the PV loop (red) takes on a triangular shape secondary to proper unloading of the left-sided preload. The purple and green lines represent contractility (end-systolic PV relationship; ESPVR) and grey and green curve represent ventricular elastance (end-diastolic PV relationship; EDPVR). See Online Video 9. LV: left ventricle.
Table 1.
Simulation of 10-mm ventricular septal defect (VSD) on Harvi software showing the quantified impact of mechanical circulatory support devices. CO: cardiac output; PA: pulmonary artery; IABP: intra-aortic balloon pump; ECMO: extracorporeal membrane oxygenation
| DEVICE TYPE | DEVICE FLOW (L/MIN) | CO (L/MIN) | VSD FLOW (L/MIN) | PA FLOW (L/MIN) | QP/QS |
|---|---|---|---|---|---|
| None | n/a | 2.69 | 5.4 | 8.07 | 3.01 |
| IABP 1:1 (40 cc) | n/a | 3.03 | 5.04 | 8.05 | 2.65 |
| ECMO | 3.37 | 0.51 | 7.41 | 7.89 | 15.49 |
| Tandem | 4.2 | 0.00 | 4.4 | 8.64 | 0 |
| Impella CP | 3.55 | 0.00 | 4.66 | 8.17 | 0 |
| Impella 5.0 | 4.6 | 0.00 | 3.43 | 8.00 | 0 |