
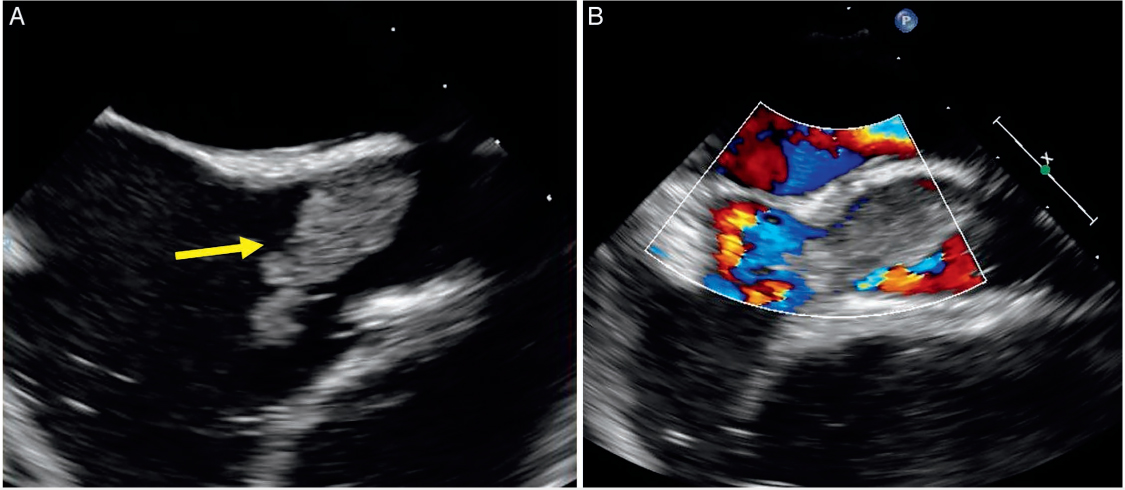
Figure 1.
Thrombus in a patient with bilateral ovarian cancer. (A) Bicaval view on transesophageal echocardiogram (TEE) showing an echodensity determined to be a thrombus (yellow arrow). (B) Color flow Doppler on TEE demonstrating partial obstruction of flow around the thrombus.
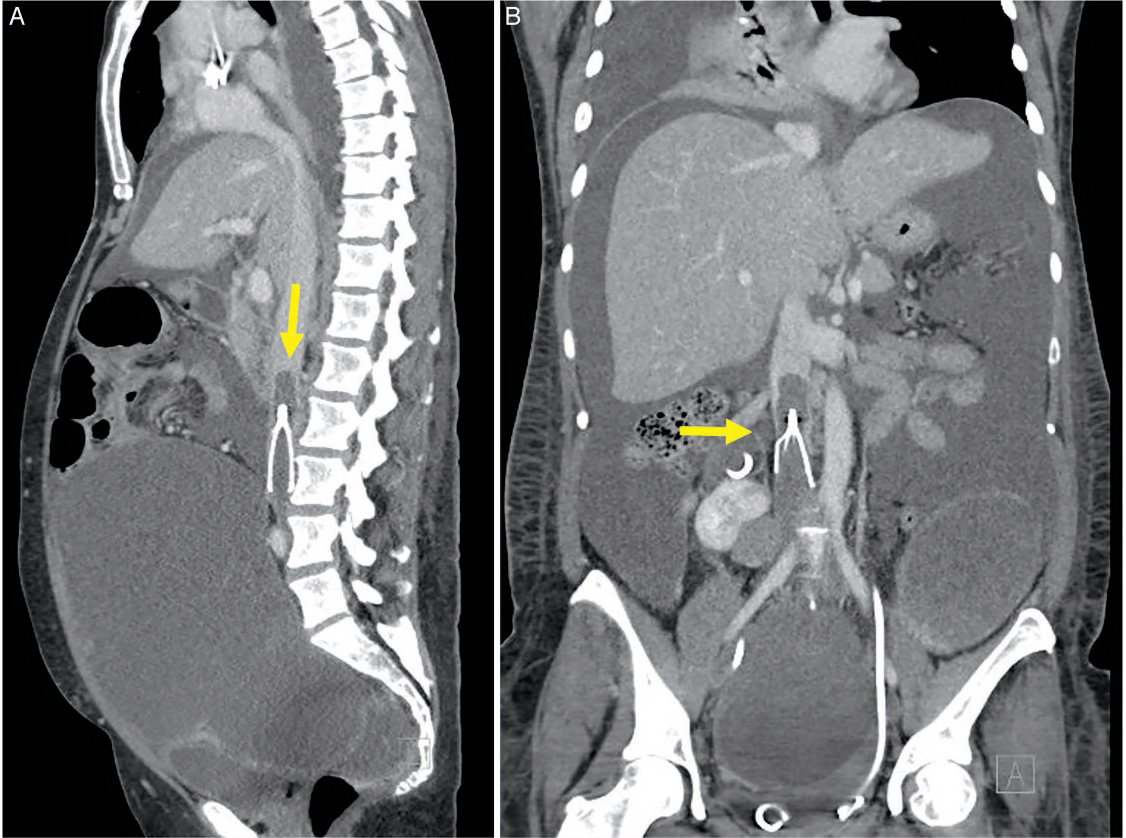
Figure 2.
Thrombus in a patient with bilateral ovarian cancer. (A) Sagittal view on computed tomography (CT) scan demonstrating the presence of an inferior vena cava (IVC) filter with thrombus extending cranially (yellow arrow). (B) Coronal view on CT scan shows an IVC filter in place with thrombus (yellow arrow) involving the IVC and external and common iliac veins.
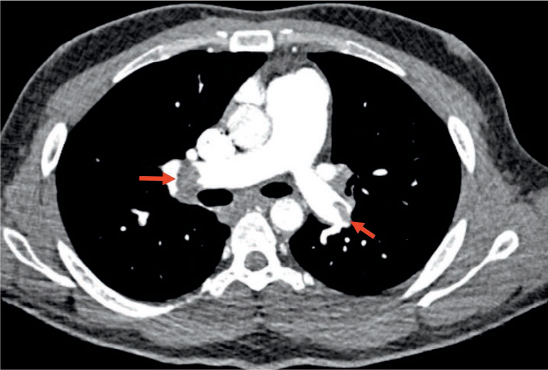
Figure 3.
Chest computed tomography demonstrates multiple bilateral pulmonary emboli (red arrows) in a 27-year-old man with synovial sarcoma in the left thigh.
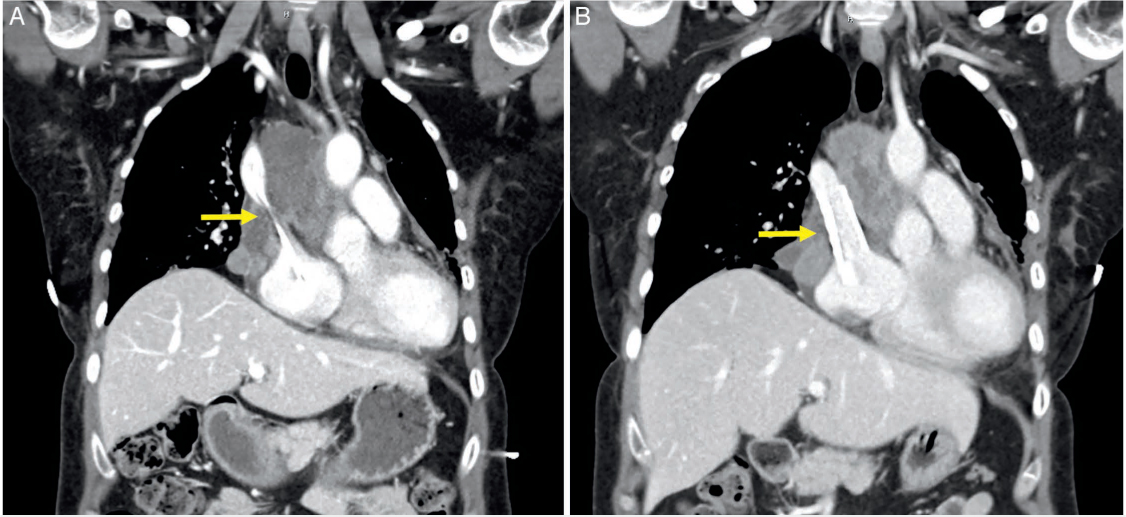
Figure 4.
Computed tomography (CT) of patient diagnosed with pericardial mesothelioma who developed superior vena cava (SVC) syndrome. (A) Chest CT scan with intravenous contrast demonstrates narrowing of the SVC as it enters the right atrium (yellow arrow). (B) Chest CT scan with intravenous contrast demonstrates relief of SVC obstruction with stenting (yellow arrow).
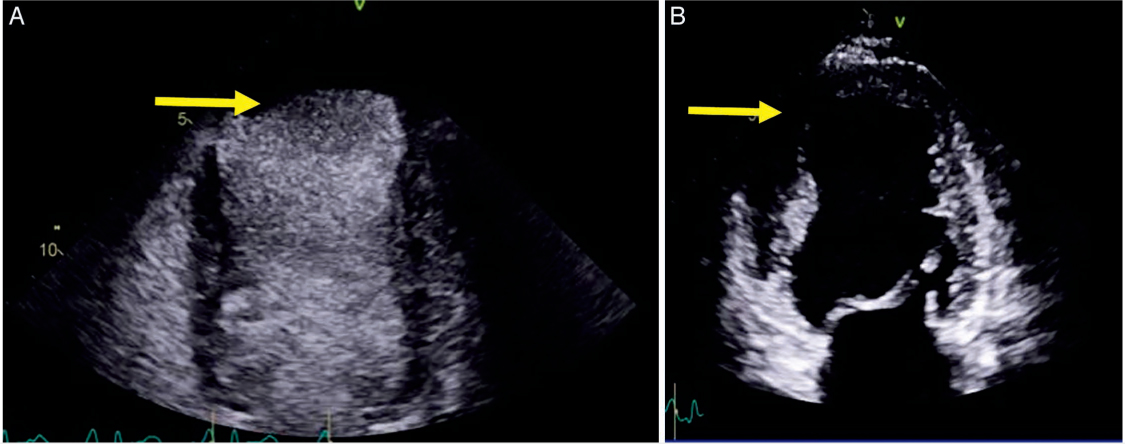
Figure 5.
Patient diagnosed with adenocarcinoma of the lung with brain metastases. (A) Transthoracic echocardiogram with contrast shows evidence of left ventricular (LV) apical thrombus (yellow arrow). (B) Transthoracic echocardiogram without contrast demonstrating LV apical aneurysm (yellow arrow).
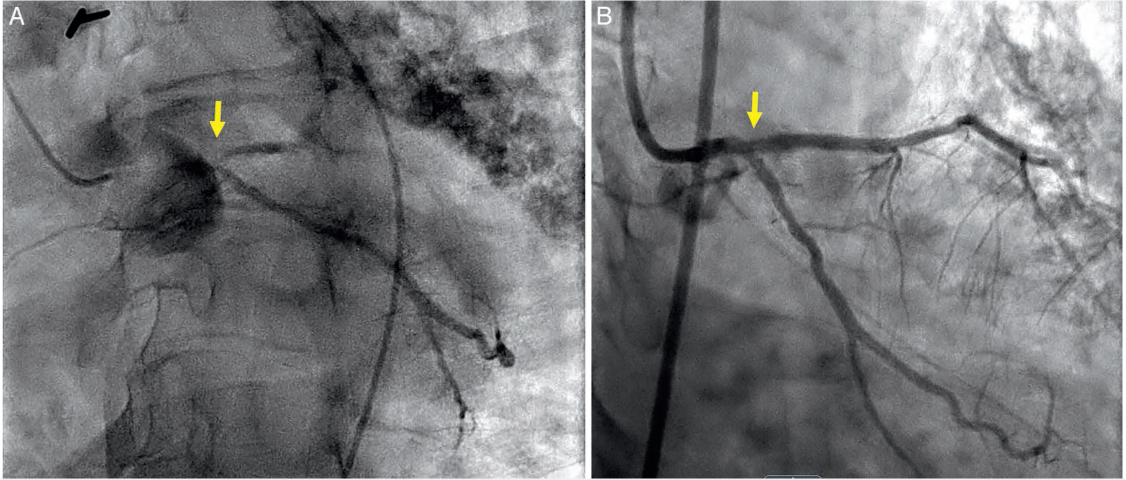
Figure 6.
Patient with Hodgkin lymphoma. (A) Left heart catheterization shows severe stenosis involving the proximal left anterior descending artery in a patient with prior mantle radiation and graft versus host disease (yellow arrow). (B) Left heart catheterization shows restoration of coronary flow after percutaneous coronary intervention with a drug-eluting stent (yellow arrow).
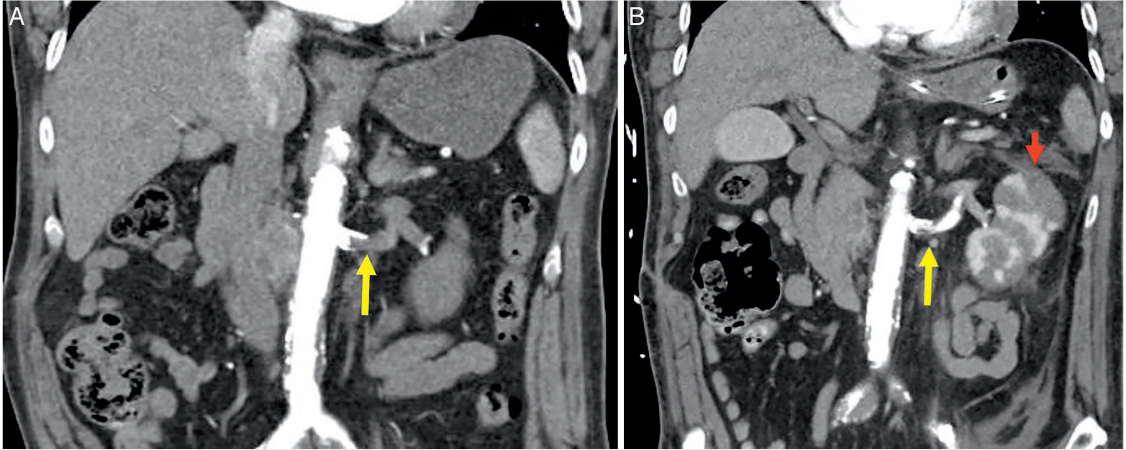
Figure 7.
Patient with with renal cell carcinoma. (A) Computed tomography (CT) scan with intravenous contrast demonstrates thrombosis of the left renal artery (yellow arrow) in a patient with significant peripheral vascular disease undergoing cancer treatment with pazopanib. (B) CT scan with intravenous contrast demonstrates partial restoration of blood flow in the left renal artery following suction thrombectomy (yellow arrow). There is evidence of multiple renal thrombi (red arrow).
Table 1.
Evaluation and management of vascular complications in patients with cancer.
| HISTORY AND PHYSICAL EXAMINATION | Establish baseline cardiovascular risk based on traditional risk factors (eg, diabetes) and pre-existing cardiovascular disease. | ||
Identify potential vascular complications from treatment
| |||
Use validated tools (eg, Khorana score) to establish venous thromboembolism risk
| |||
| Assess the risk for bleeding including history of major bleeding event(s). | |||
| ARTERIAL THROMBOSIS | VENOUS THROMBOSIS | ACCELERATED ATHEROSCLEROSIS | |
| DIAGNOSIS | Vascular Doppler ultrasound Noninvasive angiography Invasive angiography | Pulmonary embolism
| Electrocardiogram Troponin Coronary CTA Stress test Cardiac catheterization |
| TREATMENT | Anticoagulation Antiplatelet therapy Statin therapy Revascularization | Anticoagulation
| Risk factor modification Antiplatelet therapy Statin therapy Antianginal therapy Anticoagulation
|