
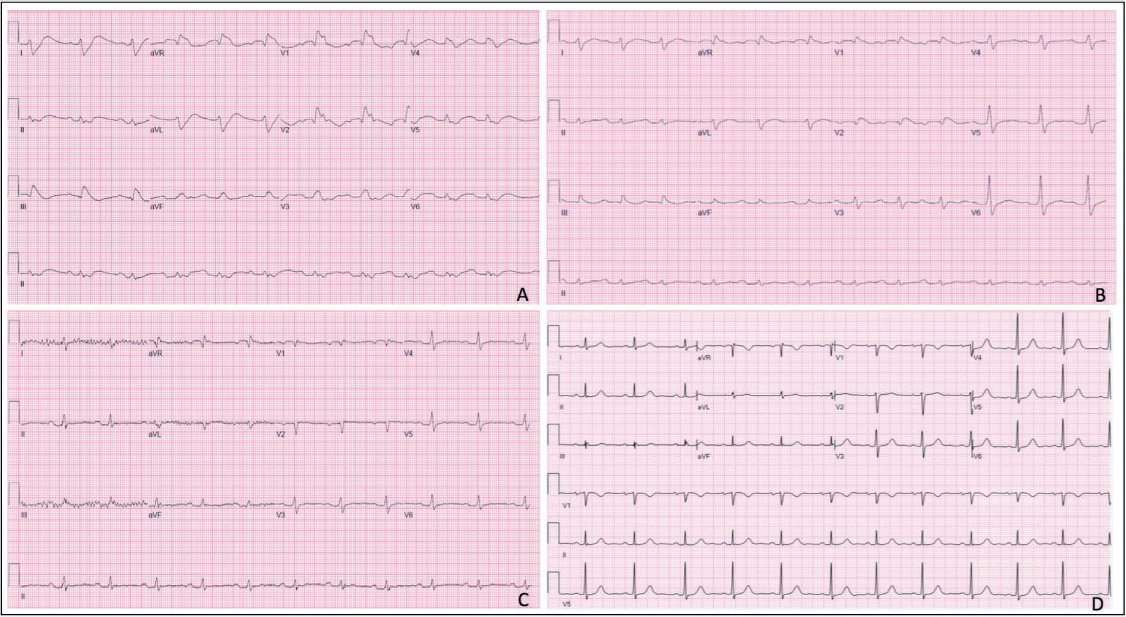
Figure 1.
Electrocardiograms (EKGs) at different stages during hospitalization. (A) EKG on admission: mimic of type 1 Brugada pattern on leads V1-V2, RAD, first-degree AVB with PR interval 239 ms, RBBB with QRSd 270 ms, and QTc 578 ms. (B) EKG on day 2 of admission: mimic of type 1 Brugada pattern on leads V1-V2, RAD, first-degree AVB with PR interval 276 ms, RBBB with QRSd 162 ms, and QTc 522 ms. (C) EKG on day 3 of admission: NSR with first-degree AVB with PR 251 ms, QRSd 150 ms, and QTc 458 ms. (D) Baseline EKG from prior admission: NSR, PR 193 ms, QRSd 98 ms, and QTc 458 ms. RAD: right axis deviation; AVB: atrioventricular block; RBBB: right bundle branch block; NSR: normal sinus rhythm