
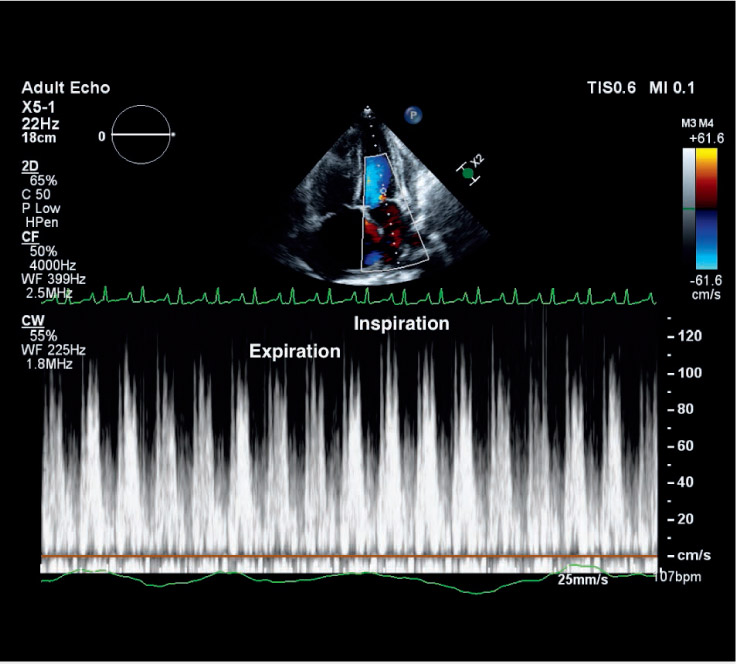
Figure 1.
Pulse wave Doppler recording of the mitral valve inflow showing reversal of the expected respiratory variation prior to pericardiocentesis.
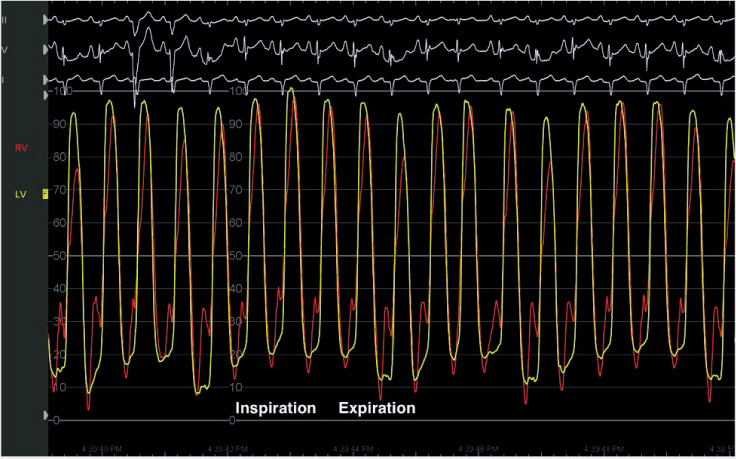
Figure 2.
Cardiac catheterization shows a decrease in left ventricular systolic and diastolic pressures during expiration.
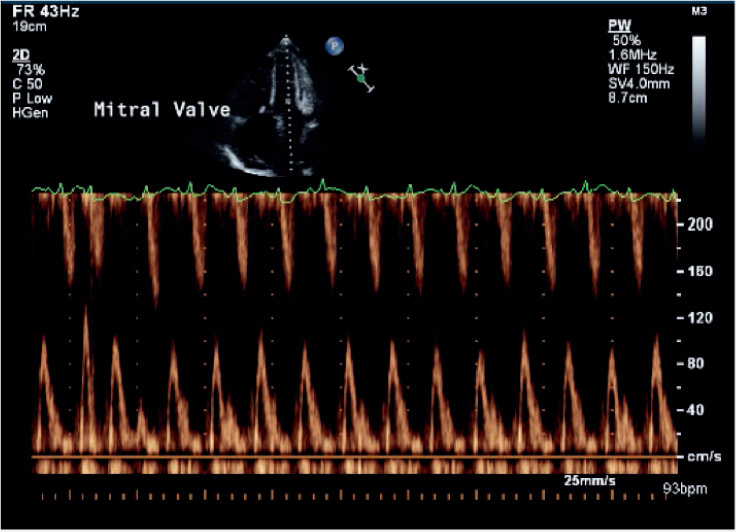
Figure 3.
Pulse wave Doppler recording of tricuspid valve inflow showing normal respiratory variation 1 week after pericardiocentesis. I: inspiration, E: expiration
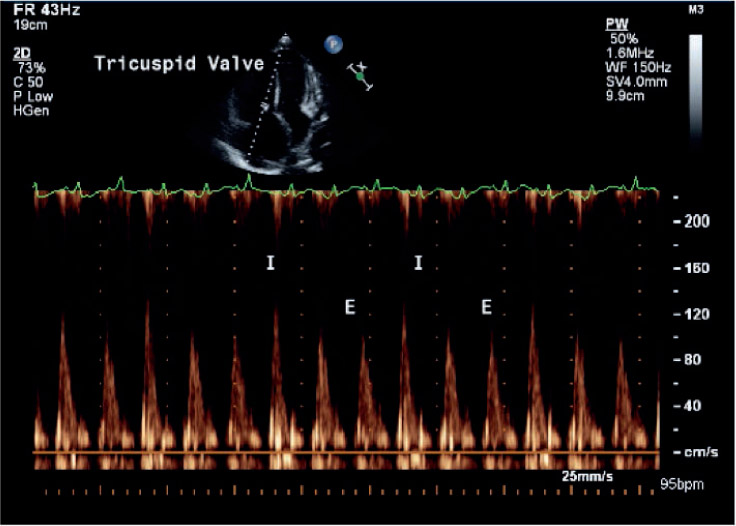
Figure 4.
Pulse wave Doppler recording of mitral valve inflow showing minimal respiratory variation 1 week after pericardiocentesis.