
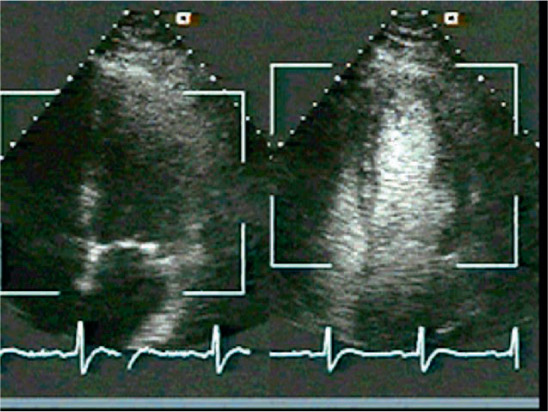
Figure 1.
Demonstration of improved endocardial detection using an echocardiographic contrast agent. The left image was captured using tissue harmonic imaging, but the endocardium is not well delineated. The right image was acquired after the injection of an echocardiographic contrast agent, and all of the endocardium is well visualized. Reprinted with permission.18
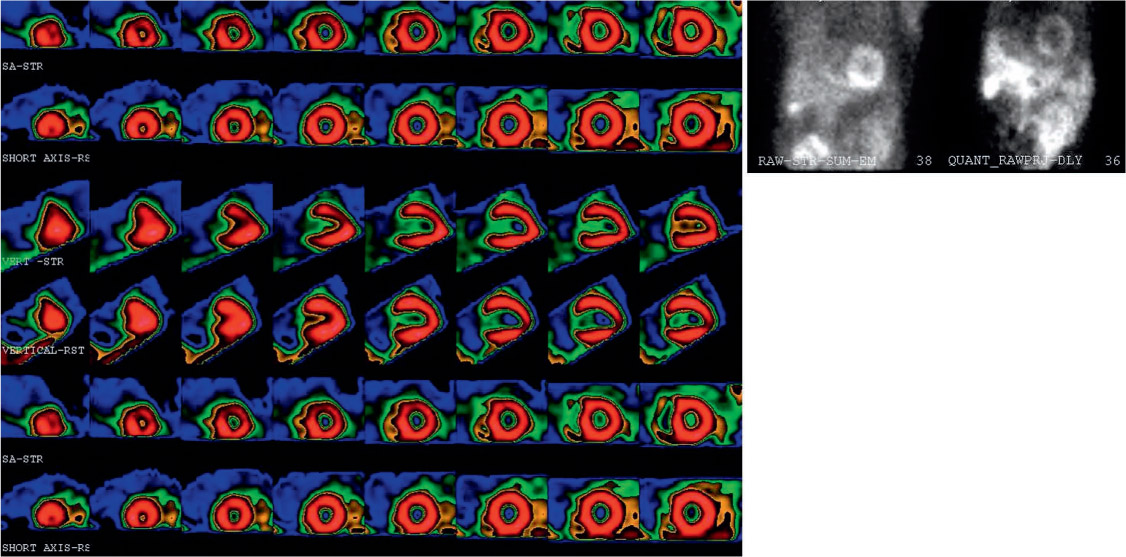
Figure 2.
Demonstration of a large breast attenuation defect masquerading as ischemia in the LAD distribution. Left panel: the top, third, and fifth rows are the short (SA), vertical (VERT), and horizontal (HORZ) axes images obtained at peak stress, which are compared to the corresponding rest images in the second, fourth, and sixth rows. At peak stress, a large defect is evident in the anteroseptal, anterior, and anterolateral walls. Right panel: comparison of the raw data at peak stress (RAW-STR-SUM-EM) to the raw data at rest (QUANT_RAWPRJ-DLY) reveals homogeneous attenuation of the heart by the breast tissue at rest, whereas at peak stress the breast attenuates only the upper half of the heart; this results in the illusion of a large ischemic defect in the LAD distribution. ECG gating (not shown here) demonstrated normal wall motion in all segments at peak stress.19 Reprinted with permission. LAD: left anterior descending artery; ECG: electrocardiogram
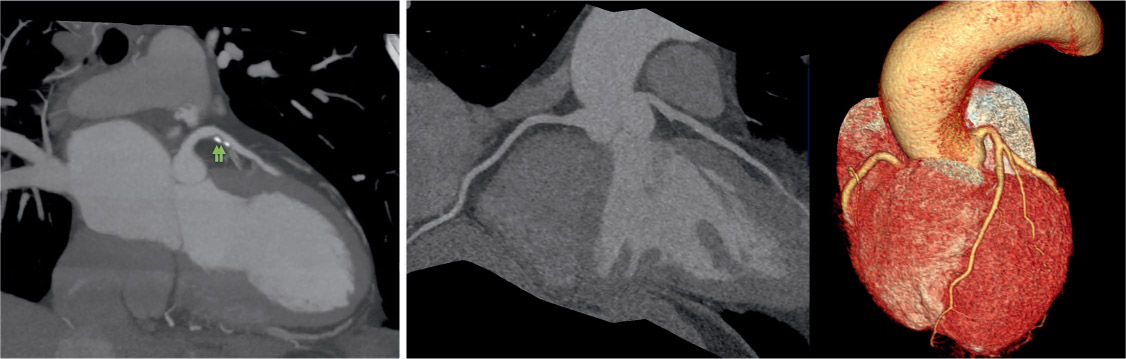
Figure 3.
(Left) Proximal left anterior descending coronary artery on CTA showing obstructive atherosclerotic plaque (> 50% stenosis) with high-risk features including positive remodeling and spotty calcifications (arrows). (Right) Curved planar reformat and volume-rendered images on CTA showing essentially normal coronary arteries in a middle-aged female patient with risk factors and recurrent chest pains. CTA: computed tomography angiography
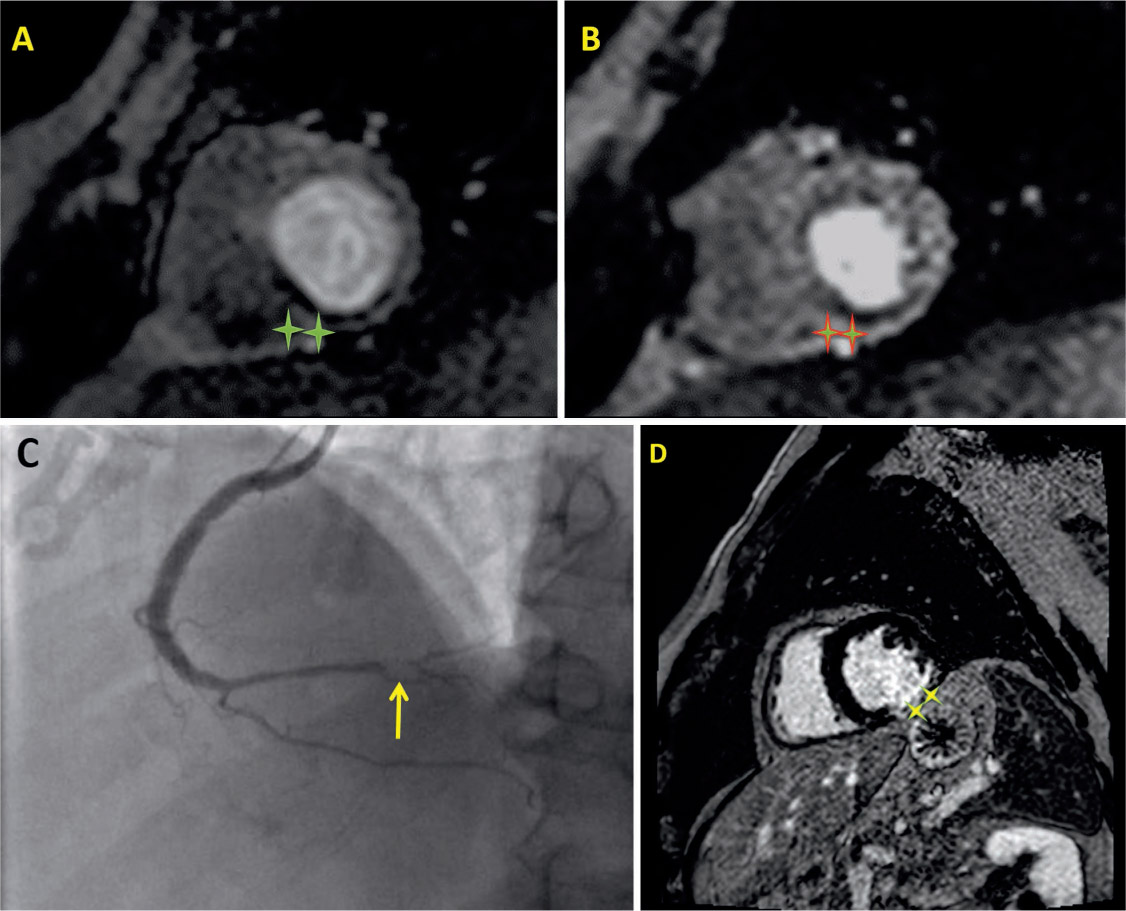
Figure 4.
(A–C) Short-axis views of the left ventricle on CMR showing basal to mid inferior and basal inferoseptal inducible ischemia on first-pass perfusion imaging. Hypoperfused myocardial segments are seen as dark regions (A and B asterisks) of low signal. Panel C demonstrates the lesion seen on invasive coronary angiography responsible for the CMR findings. (D) CMR-delayed contrast imaging showing hyperenhancement (asterisks) in the inferolateral wall, suggestive of myocardial fibrosis. CMR: cardiac magnetic resonance