
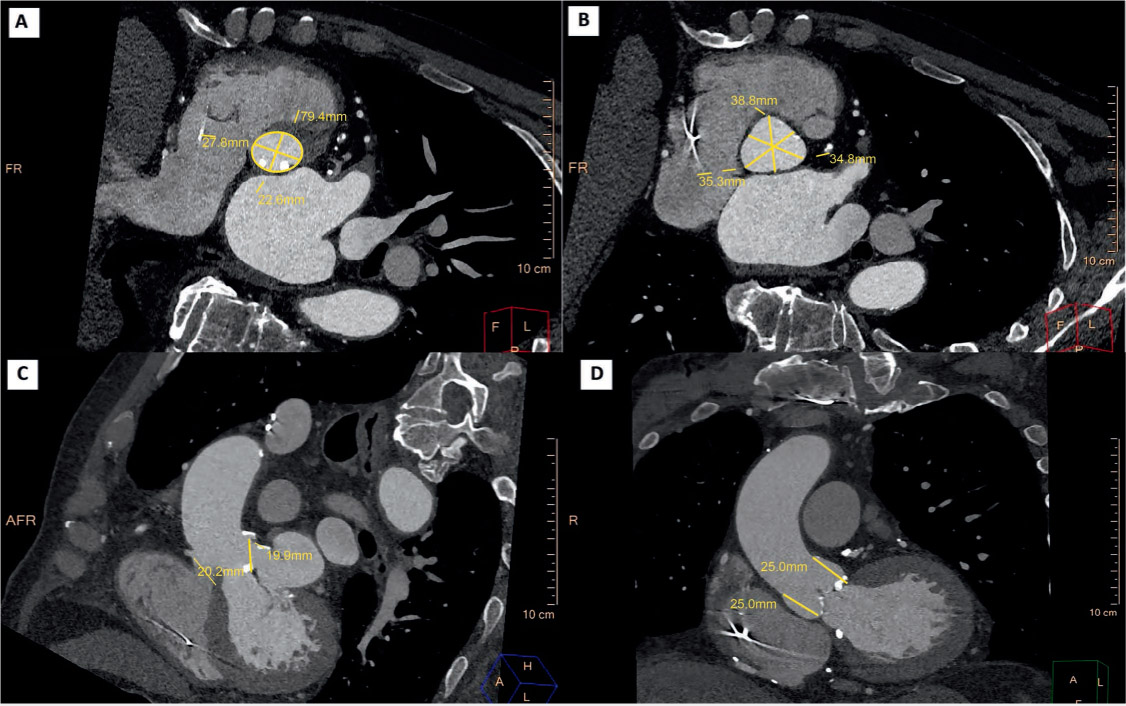
Figure 1.
Standard measurements of the aortic root in pre-TAVR computed tomography. (A) Aortic annulus major/minor diameters and perimeter. (B) Sinus of Valsalva width. (C) Coronary ostia height. (D) Sinotubular junction height.
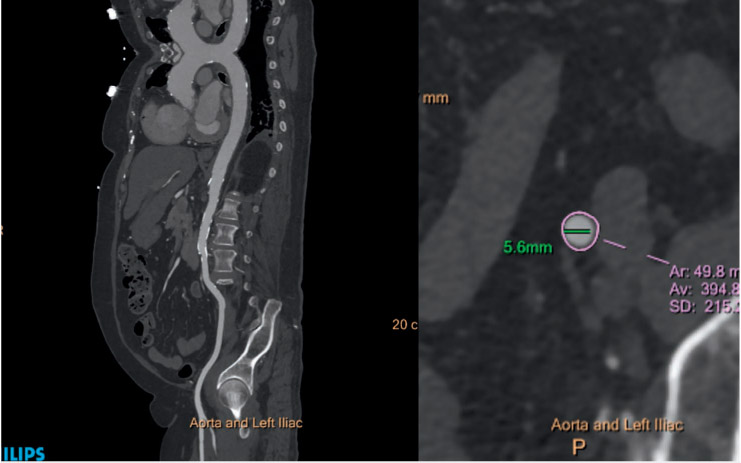
Figure 2.
Computed tomography assessment of peripheral vasculature. Left panel: Curved multiplanar reconstruction of the thoracic and abdominal aorta and left iliac system showing no significant obstructive lesion and mild calcification. Right panel: Short-axis minimal luminal diameter of the left external iliac artery.
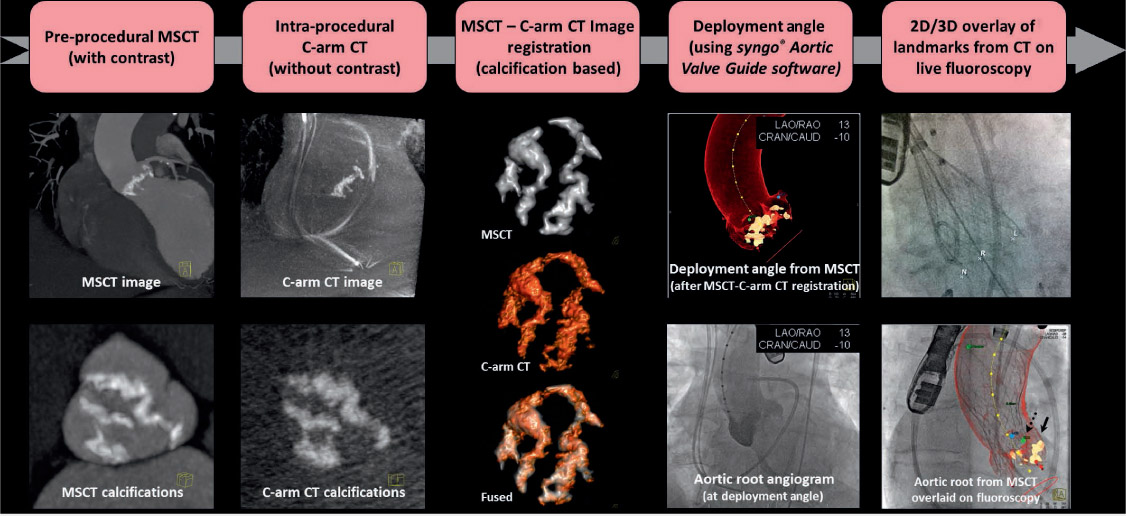
Figure 3.
Workflow for fusion imaging in the catheterization lab. MSCT: multislice computed tomography; CT: computed tomography. Printed with permission from Ponraj Chinnadurai, MBBS, MMST, Siemens Medical Solutions USA, Inc.
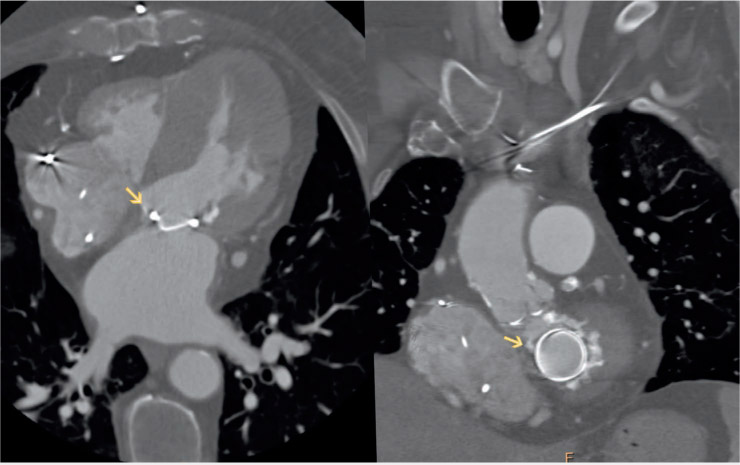
Figure 4.
Computed tomography image of the paravalvular (PV) defect. Left panel: 4-chamber view of the heart showing medial PV defect. Right panel: Same defect located at 11 o'clock on an “en face” view of the mitral annulus.
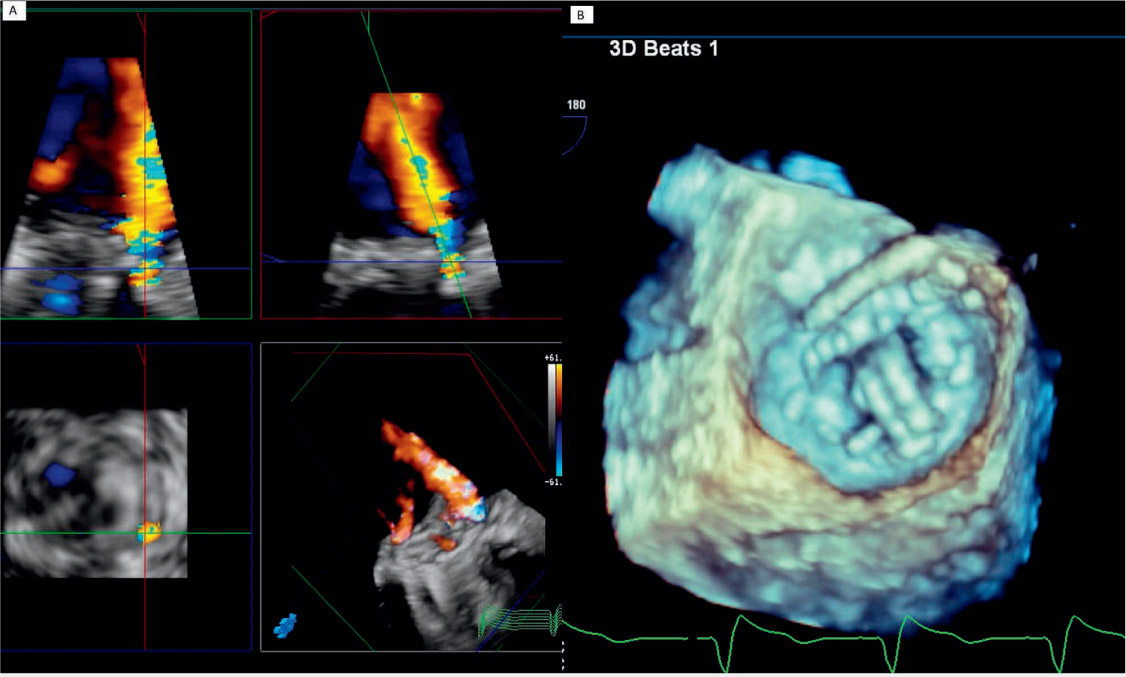
Figure 5.
Three-dimensional transesophageal echocardiography images demonstrating the paravalvular defect. (A) Moderate-to-severe paravalvular mitral regurgitation. (B) Wire placement at 11 o'clock during paravalvular leak closure (same location as seen by computed tomography on Figure 4 left panel).
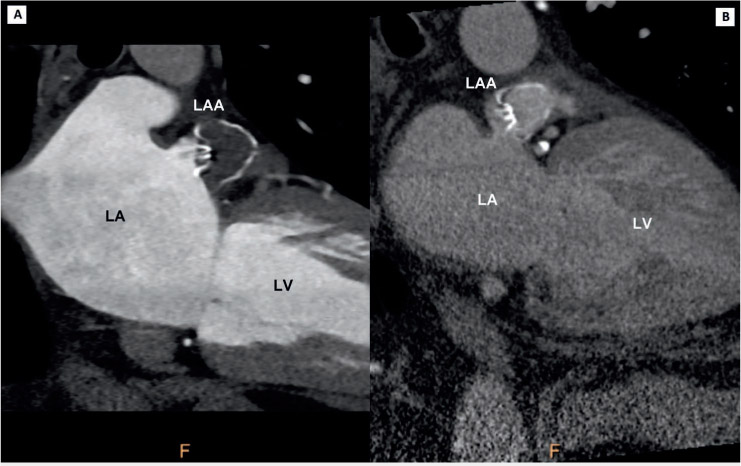
Figure 6.
Computed tomography imaging of left atrial appendage (LAA) WATCHMAN closure device. (A) Successfully thrombosed LAA appendage. (B) Persistent filling of left atrial appendage. LA: left atrium; LV: left ventricle