
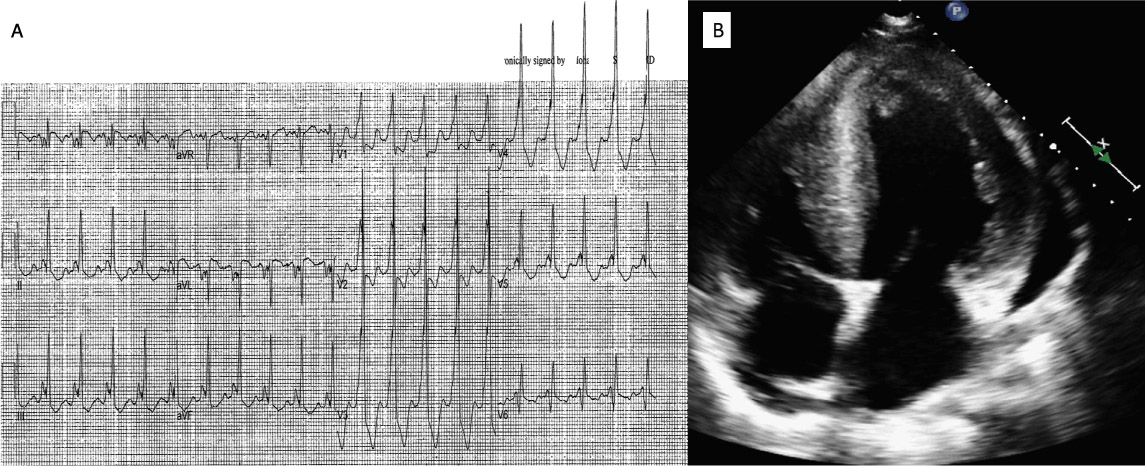
Figure 1.
(A) Electrocardiogram showed sinus tachycardia with Wolff-Parkinson-White pre-excitation pattern. (B) Transthoracic echocardiogram apical 4-chamber view showed severe concentric left ventricular hypertrophy; the thickness of interventricular septum and lateral wall were 27 mm and 21 mm. LA: left atrium; LV: left ventricle; RA: right atrium; RV: right ventricle.
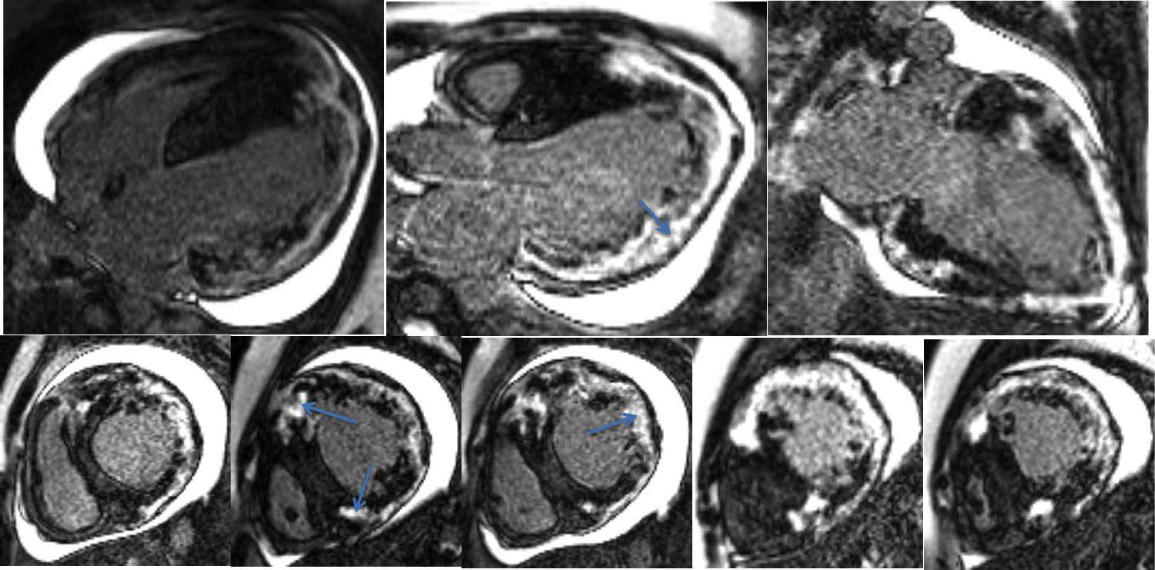
Figure 2.
Late gadolinium enhancement (LGE) cardiac magnetic resonance. The top row (4-chamber, 3-chamber, and 2-chamber LGE images) and the bottom row (from basal to apical short axis LGE images, left to right) showed diffuse LGE in the right ventricular insertion points and mid-myocardium, most prominent in the left ventricular lateral segments (arrows).
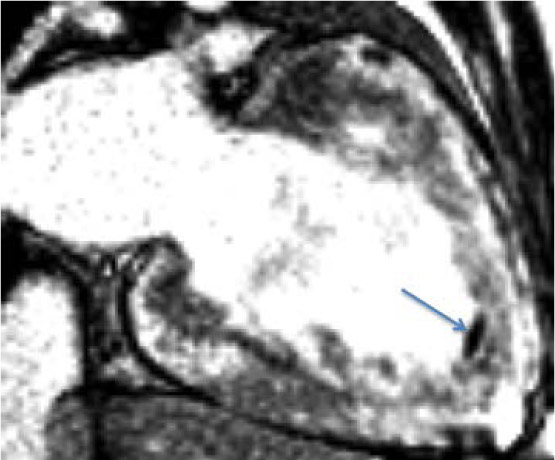
Figure 3.
Cardiac magnetic resonance delayed enhancement TI 600 ms showed a definite left ventricular apical thrombus (arrow).
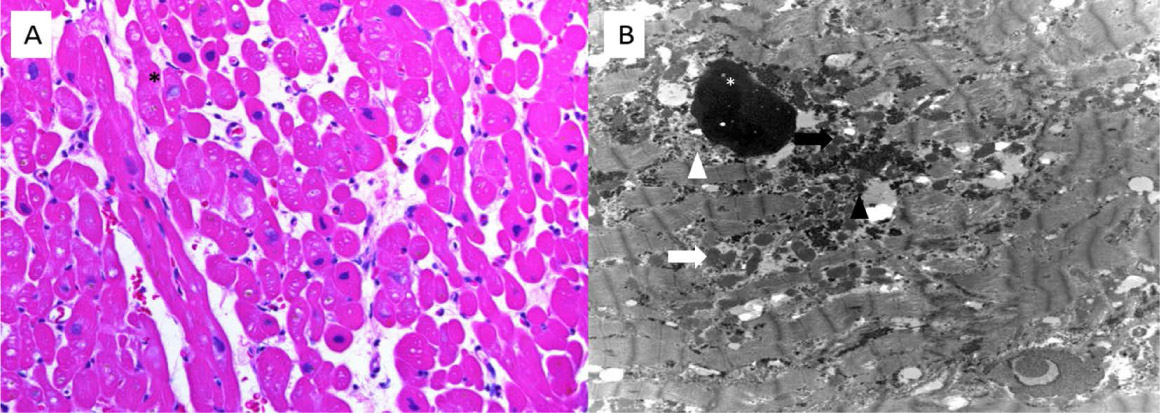
Figure 4.
(A) Endomyocardial biopsy showed enlarged and vacuolated cardiomyocytes, hematoxylineosin statin, original magnification 400×. (B) Ultrastructure of myocardial biopsy showed myocardial fibers with accumulation of autophagic vacuoles, with degenerating mitochondria, glycogen, small vesicles, and granular debris. Magnification 8000×.