
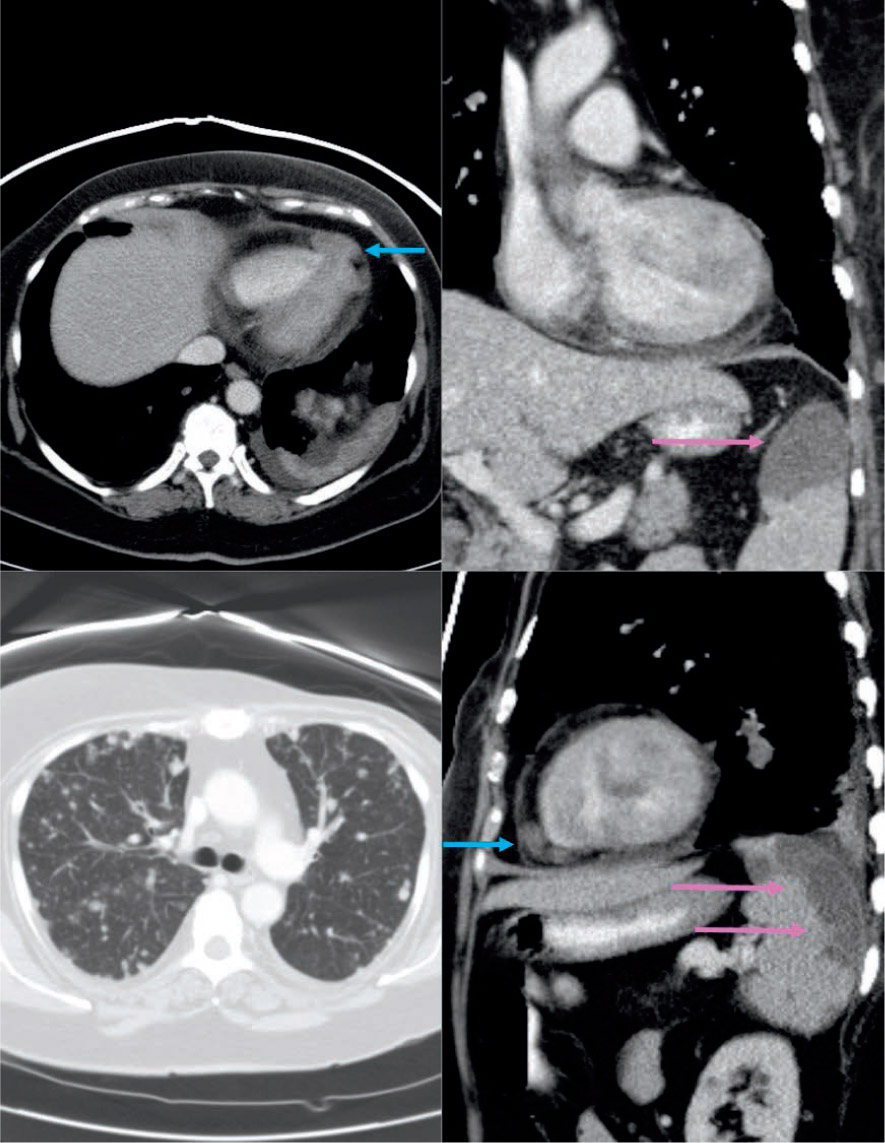
Figure 1.
Intravenous contrast-enhanced computed tomography images through the chest and abdomen. Top left is axial image representing a pericardial metastasis (blue arrow) at the level of the heart, appearing as an oval-shaped enhancing mass adjacent to the right ventricular apex. Incidentally, there are left pleural metastases with small malignant pleural effusion. Top right coronal image through the left upper abdomen shows a wedge-shaped hypoenhancing upper splenic pole representing infarct from metastasis (pink arrows). Bottom left axial image through the lung bases demonstrates randomly distributed enhancing round lung masses. Bottom right sagittal image through left hemithorax and abdomen shows pericardial metastasis (blue arrow) and splenic infarct (pink arrows).
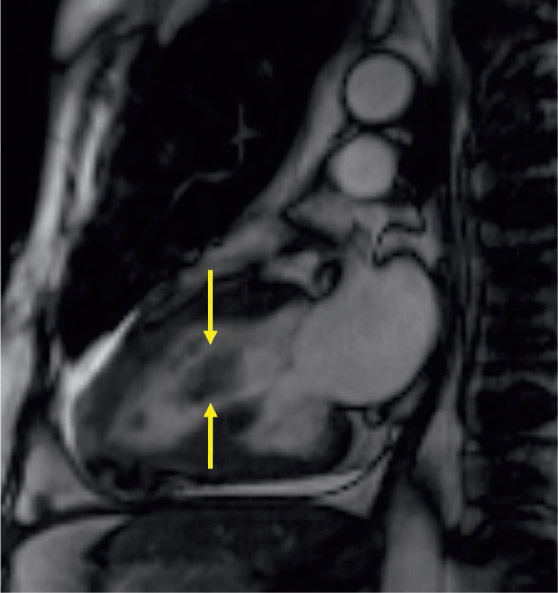
Figure 2.
Two-chamber view SSFP MR image (TR: 39.6, TE: 1.12, flip angle: 74°, FOV: 276 × 340) demonstrates the lateral left ventricular wall irregular hypointense lesion representing metastasis (yellow arrows). SSFP: steady state free precession; MR: magnetic resonance; TR: repetition time; TE: echo time; FOV: field of view.
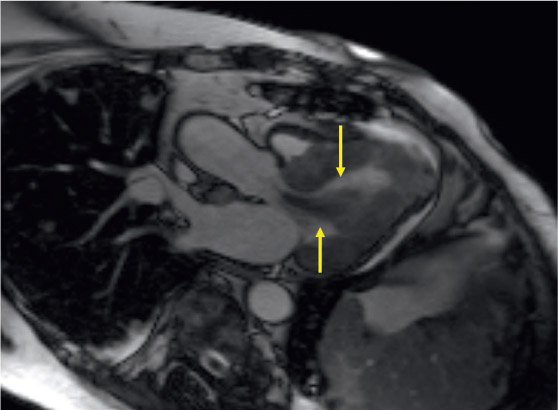
Figure 3.
Three-chamber LVOT view SSFP MR image (TR: 42.8, TE: 1.19, flip angle: 75°, FOV: 276 × 340) demonstrating the lateral wall lesion resulting in dynamic obstruction of the outflow track. LVOT: left ventricular outflow track; SSFP: steady state free precession, MR: magnetic resonance; TR: repetition time; TE: echo time; FOV: field of view.
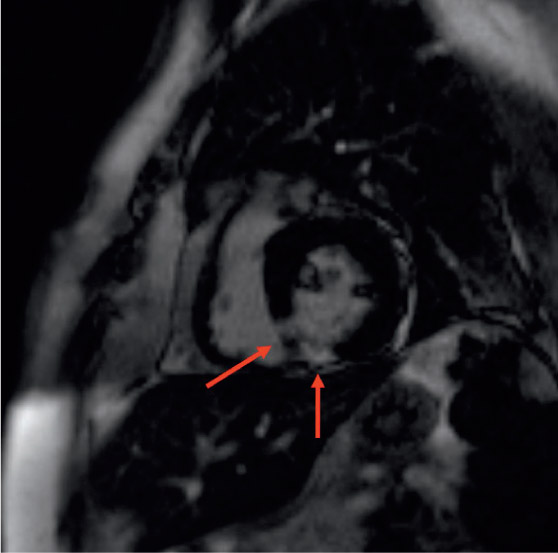
Figure 4.
Short-axis view delayed enhancement MR image (TR: 560, TE: 1.11, flip angle: 45°, FOV: 276 × 340, 30-mL intravenous gadoversetamide) of the left ventricle demonstrates basal inferoseptal full thickness wall enhancement showing a transmural infarct from presumable tumor emboli. MR: magnetic resonance; TR: repetition time; TE: echo time; FOV: field of view.