
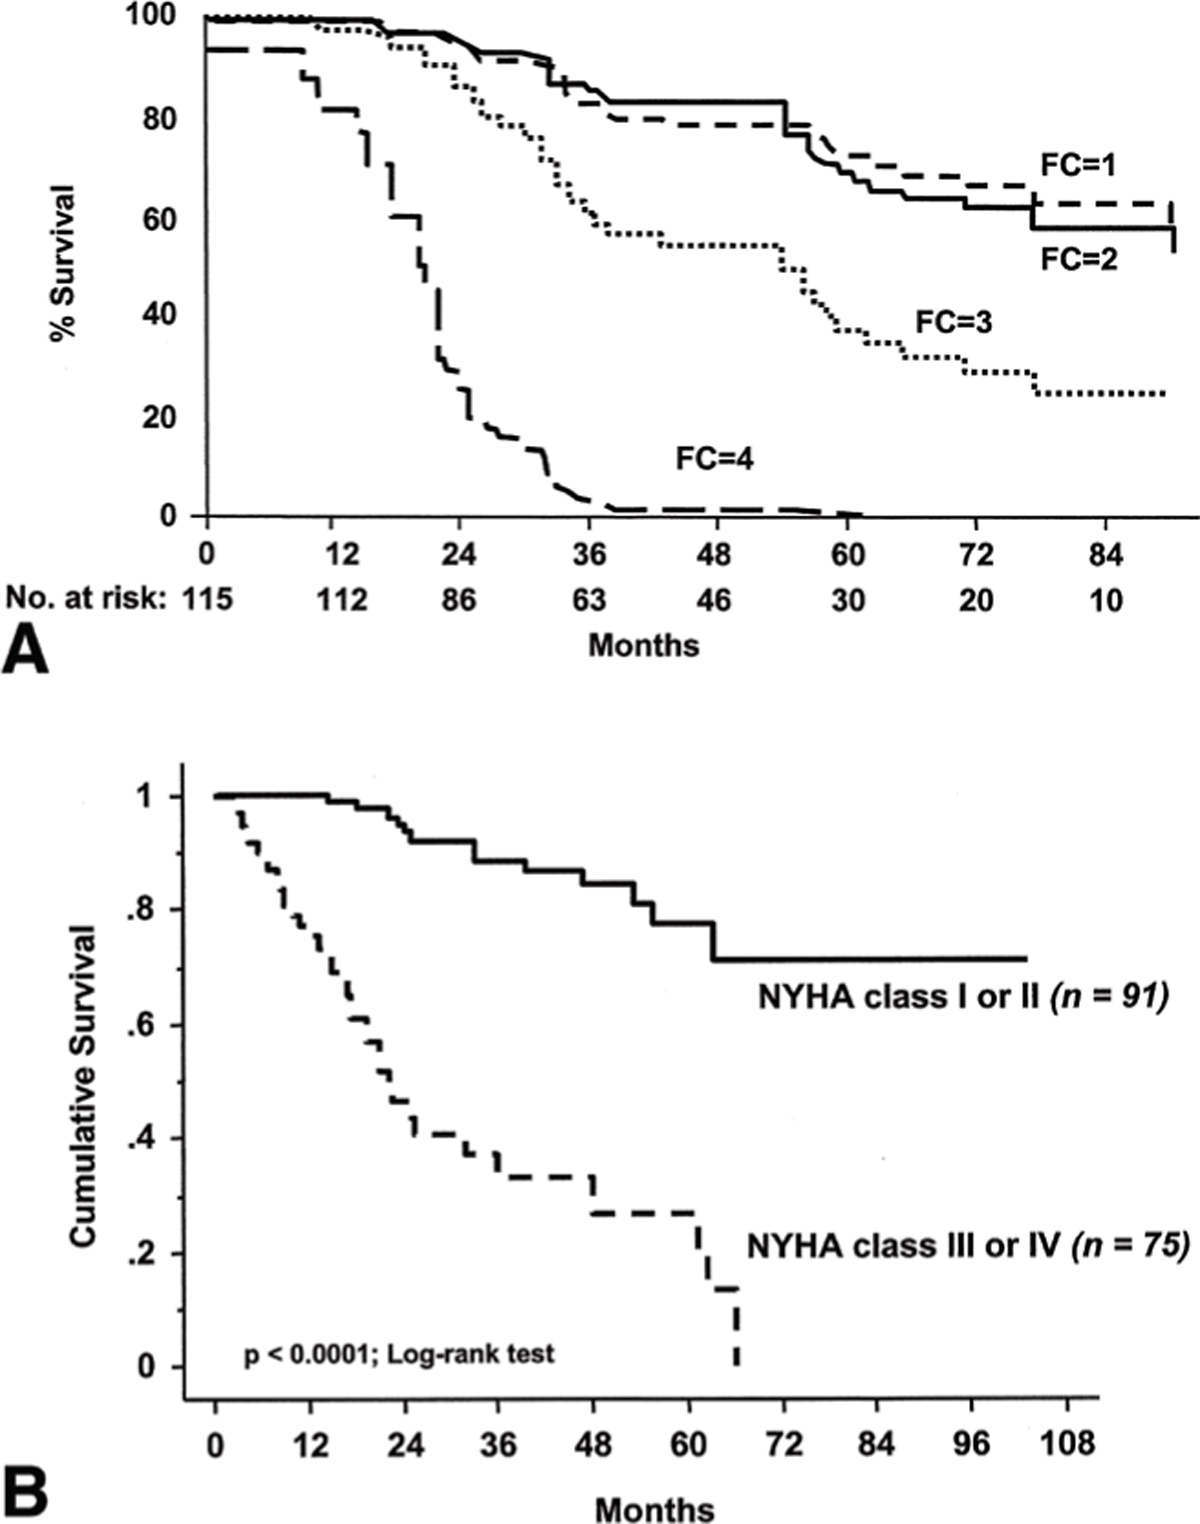
Figure 1
(A) Subsequent survival in patients with idiopathic pulmonary arterial hypertension (IPAH) stratified by functional class after 1-year epoprostenol treatment 1: P < .001 for functional class III vs functional class IV and for functional class III vs. functional class I and functional class II.30 (B) Survival in patients with IPAH treated with intravenous epoprostenol according to New York Heart Association (NYHA) functional class. After 3 months of treatment with epoprostenol, survival rates for patients reclassified in NYHA functional class I or II (solid line) were 100%, 93%, and 88% at 1, 2, and 3 years, respectively, as compared with 77%, 46%, and 33% for patients persisting in NYHA functional class III or IV (dashed line) (P < .001 by the Cox-Mantel log-rank test). Reproduced with permission of the © Elsevier Science & Technology Journals; J Am Coll Cardiol 2004;43(12 Supple S):40s–47s.17
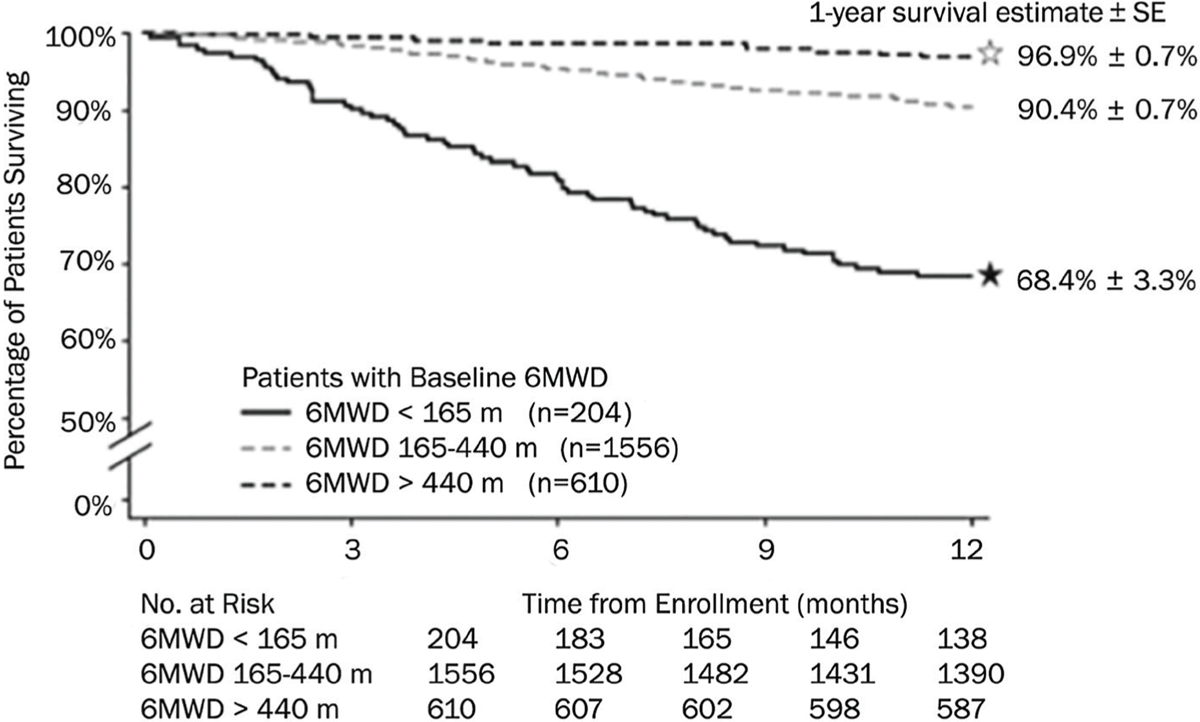
Figure 2
Kaplan-Meier survival estimates based on 6-minute walk distance (6MWD) thresholds at 165 m and 440 m and all possible 6MWD thresholds. One-year survival estimates are shown for patients with a baseline 6MWD < 165 m (black solid), 165–440 m (gray dashed), and > 440 m (black dashed). Stars mark the 1-year survival estimates for patients with a 6MWD of > 440-m threshold (white star) and patients with a 6MWD ≤ a 165-m threshold (black star) and show the relationship between the two figures. Reproduced with permission of the © Elsevier Science & Technology Journals; J Heart Lung Trans. 2015; 34: 362–368.21
Table 1
European Society of Cardiology/European Respiratory Society Guidelines risk assessment 2015. WHO: World Health Organization; 6MWD: 6-minute walk distance; BNP: brain natriuretic peptide; NT-proBNP: N-terminal proBNP; CMR: cardiac magnetic resonance; VO2: maximal oxygen uptake; VE/VCO2: minute ventilation/carbon dioxide production; RA: right atrial; RAP: RA pressure; CI: cardiac index. Reproduced with permission of the © 2021 European Society of Cardiology & European Respiratory Society. European Respiratory Journal, 46(4):903–75.5
| DETERMINANTS OF PROGNOSIS (ESTIMATED 1-YEAR MORTALITY) | LOW RISK < 5% | INTERMEDIATE RISK 5%–10% | HIGH RISK > 10% |
|---|---|---|---|
| Clinical signs of right heart failure | Absent | Absent | Present |
| Progression of symptoms | No | Slow | Rapid |
| Syncope | No | Occasional syncopeb | Repeated syncopec |
| WHO functional class | I, II | III | IV |
| 6MWD | > 440 m | 165–440 m | < 165 m |
| Cardiopulmonary exercise testing | Peak VO2 > 15
mL/min/kg (> 65% pred.) VE/VCO2 < 36 | Peak VO2 11–15
mL/min/kg (35–65% pred.) VE/VCO2 slope 36–44.9 | Peak VO2 < 11
mL/min/kg (< 35% pred.) VE/VCO2 slope ≥ 45 |
| NT-proBNP plasma levels | BNP < 50 ng/L NT-proBNP < 300 ng/L | BNP 50–300 ng/L NT-proBNP 300–1,400 ng/L | BNP > 300 ng/L NT-proBNP > 1,400 ng/L |
| Imaging (echocardiography, CMR imaging) | RA area < 18 cm2 No pericardial effusion | RA area 18–26 cm2 No or minimal pericardial effusion | RA area > 26 cm2 Pericardial effusion |
| Hemodynamics | RAP < 8 mm Hg CI ≥ 2.5 L/min/m2 SvO2 > 65% | RAP 8–14 mm Hg CI 2.0–2.4 L/min/m2 SvO2 60–65% | RAP > 14 mm Hg CI ≥ 2.5 L/min/m2 SvO2 < 60% |
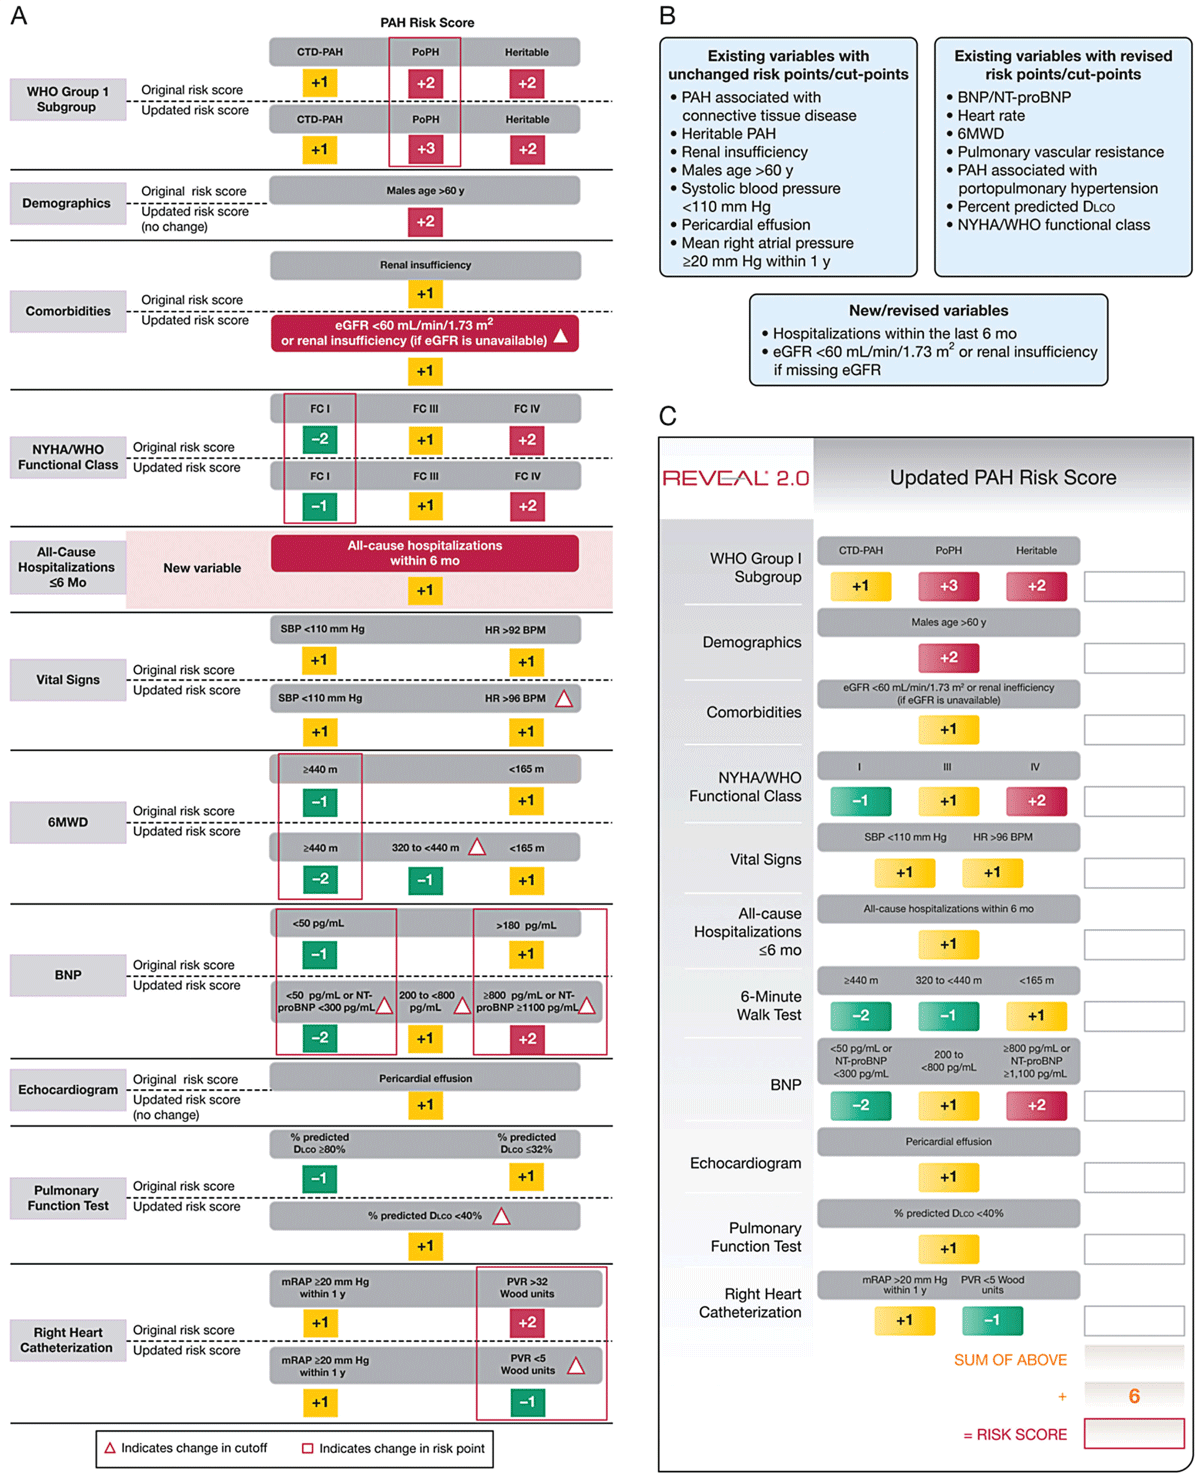
Figure 3
REVEAL 2.0 Updated Risk Score Calculator. Risk score ranges from 0 (lowest) to 23 (highest). Reproduced with permission (open access).60
Table 2
REVEAL 2.0 v REVEAL Lite 2; Hazard ratios and concordance indexes for Estimation of 1-year Mortality. Reproduced with permission (open access).59 C-index = Harrell’s concordance statistic; HR: hazard ratio; N/A: not applicable
| RISK ASSESSMENT STRATEGY AND RISK GROUP | # PATIENTS(%) | KAPLAN-MEIER ESTIMATED MORTALITY AT 1 Y (%)(95% CI) | HR (95% CI) COMPARED WITH LOW-RISK GROUP | C-INDEX (95% CI), THREE-CATEGORY/ORIGINAL |
|---|---|---|---|---|
| REVEAL 2.0 (N = 2,529) | ||||
| Low (score ≤ 6) | 1,073 (42.4) | 1.9 (1.1–2.7) | N/A | 0.73 (0.71–0.75)/0.76 (0.74–0.78) |
| Intermediate (score 7–8) | 692 (27.4) | 6.5 (4.7–8.4) | 2.73 (2.2–3.4) | |
| High (score ≥ 9) | 764 (30.2) | 25.8 (22.7–28.9) | 8.09 (6.6–9.9) | |
| REVEAL Lite 2 (N = 2,529) | ||||
| Low (score ≤ 6) | 960 (38.0) | 2.9 (1.8–3.9) | N/A | 0.70 (0.68–0.72)/0.73 (0.71–0.75) |
| Intermediate (score 7–8) | 883 (34.9) | 7.1 (5.4–8.8) | 2.27 (1.8–2.8) | |
| High (score ≥ 9) | 686 (27.1) | 25.1 (21.9–28.4) | 6.35 (5.2–7.8) | |