
Table 1.
Factors influencing the possibility of land conversion by Gasidło (1998).
| Type of factor | External factors | Internal factors | ||
|---|---|---|---|---|
| Structural | Functional | Structural | Functional | |
| Influencing factors | Location; Spatial structure; Diversity of use and quality of neighbouring areas Technical infrastructure; Form of ownership; Number of owners | Transport availability; Cultural patterns and social behaviour; Action on spatial planning, environmental protection and cultural assets; Use of property rights and marketing of real estate; Operation of special incentives (e.g. SEZs) | Size; Pollution; Geological structure of the area; Land cover; Spatial arrangement of development; Building index; Building intensity; Type of facilities | Erosion; Sedimentation; Power of natural succession; Behaviour of people in area (vandalism, wild conversions); Environmental risks |
Table 2.
Case studies of residential developments on former warehouse sites.
| Location | Characteristics of area | Characteristics of investment | Literature |
|---|---|---|---|
| Investments involving adaptation of existing storage facilities | |||
| HafenCity (Speicherstadt), Hamburg, Germany | The Speicherstadt, or Granary City, is the world’s largest complex of interconnected warehouses, often regarded as a symbol of Hamburg. The structures were built in 1888 of red brick in a neo-Gothic style. Facing the street is the front of the buildings and their rear part is the canal wall. The sites were listed as Hamburg’s protected cultural heritage in 1991 and as a UNESCO World Heritage Site in 2015. The Speicherstadt is part of the HafenCity district. | The investments in the Speicherstadt were part of the transformation of the former port and warehouse areas into the new HafenCity district between 1999 and 2025. Some of the buildings are still used as warehouses, but the majority have been allocated to other functions, including cultural – museum and exhibition activities (International Maritime Museum, Customs Museum), as well as residential functions. | Ibáñez León and Ríos Sapa (2020), Maciejewska and Turek (2019) and Heerten (2024) |
| Spichlerz Gliwice, Gliwice, Poland | Part of the barracks complex of the former Prussian Provision Office, which was then used as a hospital warehouse until the early 21st century, has been adapted for housing purposes. The building was added to the Register of Historic Buildings in 2006. | The project was conducted in 2007–2008, and the original form of the building was preserved. The architectural design involved only the addition of two cuboidal staircases, higher than the main body of the building by one storey. The brick, which is the original finishing material of the external walls, was cleaned. The usable area of the adapted building is 5000 m2. | Turek (2013) and Piegza and Rabiej (2023) |
| Meatpacking District, New York, USA | The Meatpacking District in New York City, located on the western edge of Manhattan, had served as an industrial district since the mid-19th century, dominated by the meat processing plants, cold storage facilities, warehouses and slaughterhouses from which it took its name. In the 1920s, the district was one of the main centres of the meat industry in New York City, but by the 1960s the district started to decline, and some of the buildings became derelict due to a change in the distribution structure of meat, dairy and agricultural products. The area has been on the National Register of Historic Places since 2003. | The area was revitalised in the 1990s, becoming a fashionable neighbourhood with luxury flats, boutiques, museums and restaurants, attracting residents and tourists. Some of the former warehouse buildings have been transformed into modern lofts. This is an example of the successful transformation of a warehouse space into a booming residential and entertainment centre. | Maquiaveli (2012) and Turner (2018) |
| Location | Characteristics of area | Characteristics of investment | Literature |
|---|---|---|---|
| Developments involving introduction of residential function following removal of existing development | |||
| Barangaroo, Sydney, Australia | Barangaroo in Sydney is an area that for many years served as a port and storage centre. Beginning in the 19th century, the site was a key point for the maritime industry, where goods were stored and transhipped. During the second half of the 20th century, the area gradually declined in importance, and industrial activity was extinguished. | The revitalisation of the area started in the late 20th century and the former warehouses have been transformed into one of the most rapidly growing parts of Sydney, a thriving business, residential and leisure complex. The development is a carbon-neutral estate. A significant element in the development of the estate is the special excavation that allows basements to be located below sea level. | Badelow et al. (2014) |
| Nowe Żerniki, Wrocław, Poland | The area where Nowe Żerniki in Wrocław was built was partly wasteland and partly an industrial and warehouse area, typical of peripheral urban districts, before the investment. Before being transformed into a modern housing estate, the area had not been intensively built up or developed, which made it possible to realise the concept of a model housing estate from scratch, maintaining a coherent urban vision. | Nowe Żerniki in Wrocław is a modern housing estate whose concept was born as a response to the need to create a model sustainable residential area. The project started in 2011 as an initiative to prepare the residential space of Wrocław as the European Capital of Culture 2016. Nowe Żerniki combines various types of residential development with public spaces, services and green areas. The estate is distinguished by its attention to the quality of life of its residents, with a strong emphasis on ecology, infrastructure accessibility and the integration of the local community. | Lis et al. (2022) |
| Hammarby Sjöstad, Stockholm, Sweden | Hammarby Sjöstad (literally the town around Hammarby Lake) in the late 1980s became an area occupied by a number of semi-legal or illegal small businesses and warehouses. This caused the area to be described as a slum district. Toxic substances were found in the Hammarby Sjöstad area, deposited by the businesses operating there. | In 1995, the Stockholm authorities decided to develop the area around Lake Hammarby as part of Stockholm’s bid to host the 2004 Summer Olympics. The city engaged several large private developers to make it happen. The original plan was to locate the Hammarby Sjöstad Olympic village. Despite failing to win the right to host the Games, the programme was modified to create a development in the Hammarby Sjöstad area with international leadership status in sustainable, inclusive construction and housing, with a closed water and waste recycling system for bioenergy production and renewable energy generators. | Mahzouni (2015) and Pandis Iveroth et al. (2013) |
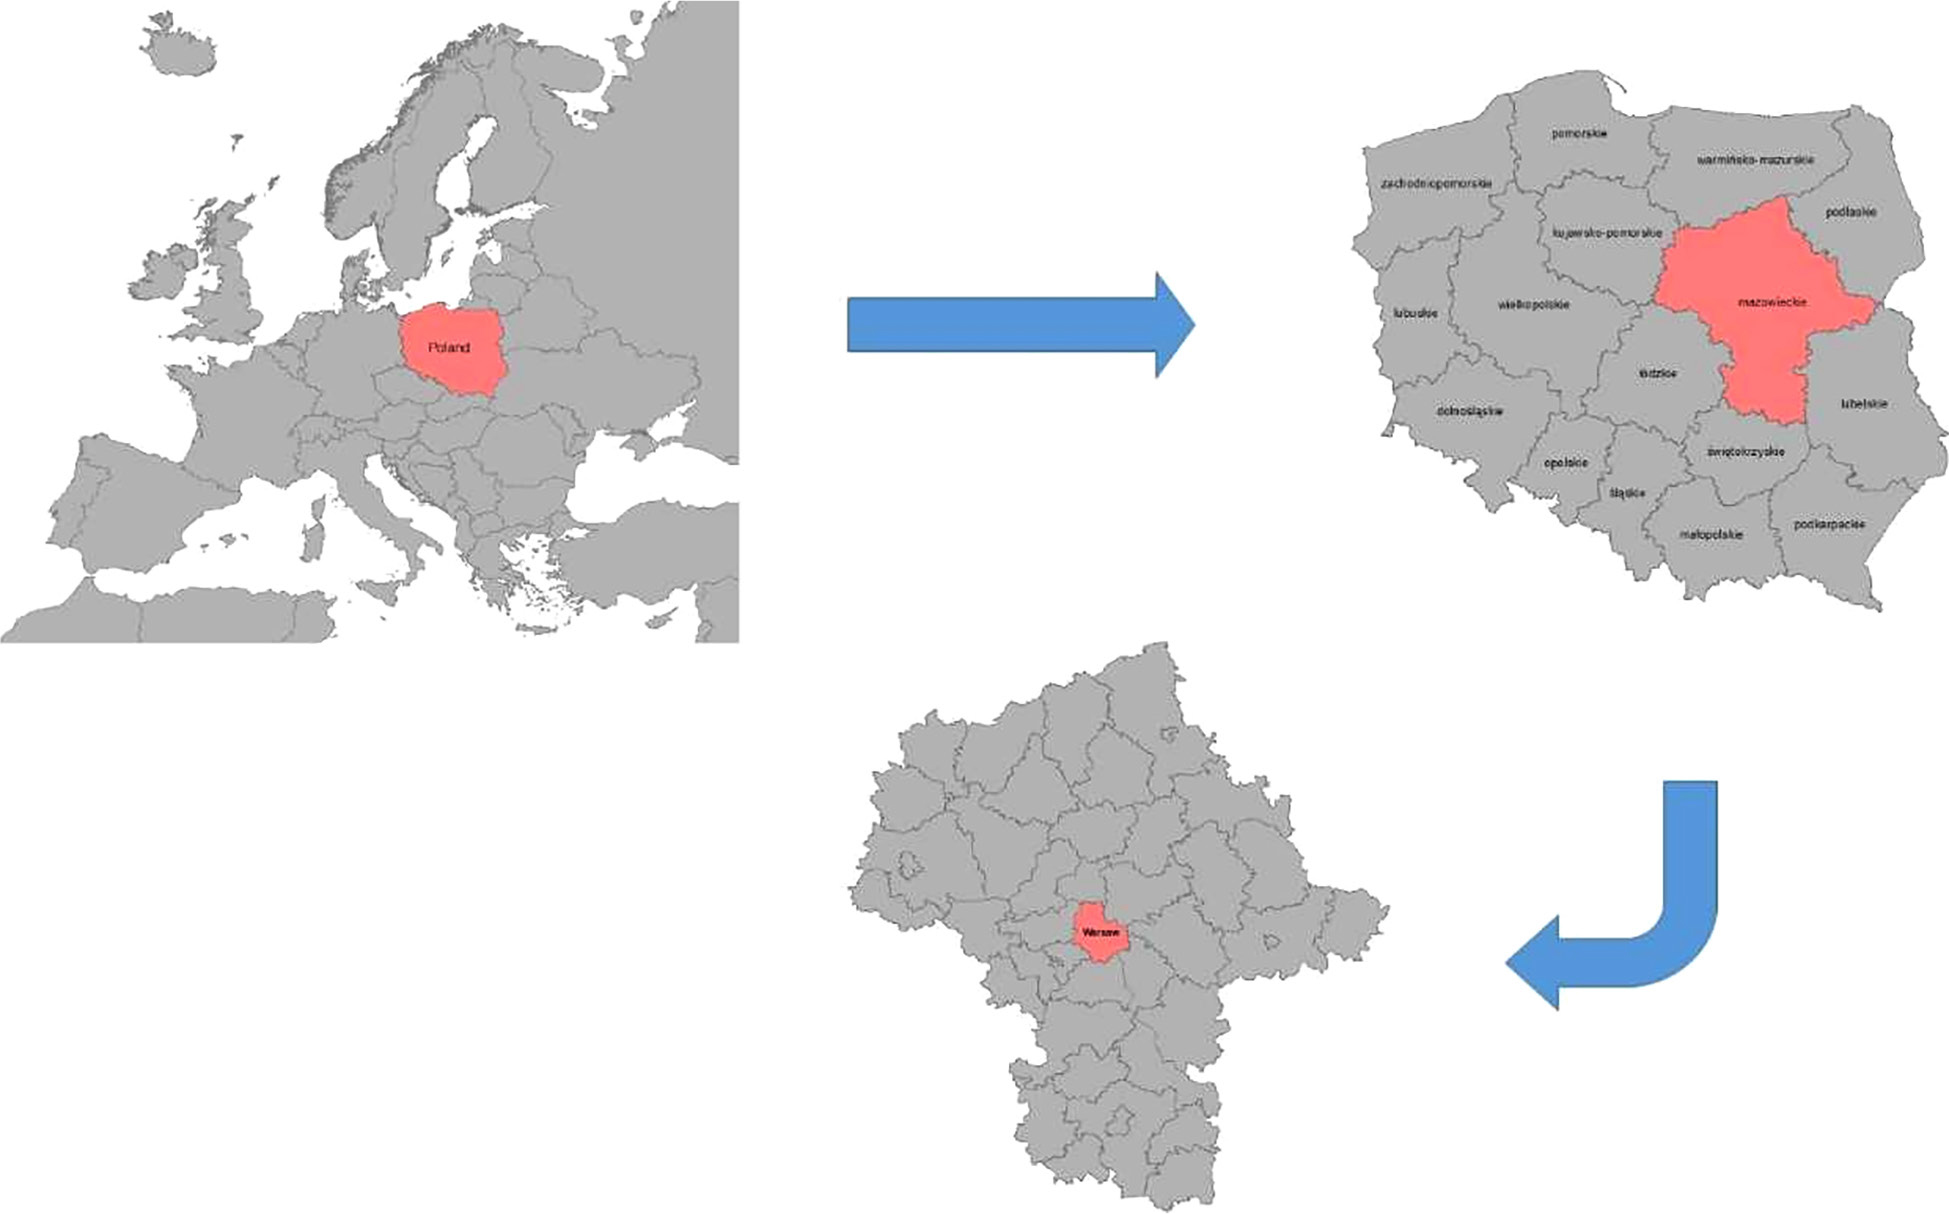
Fig. 1.
Location of the study area.
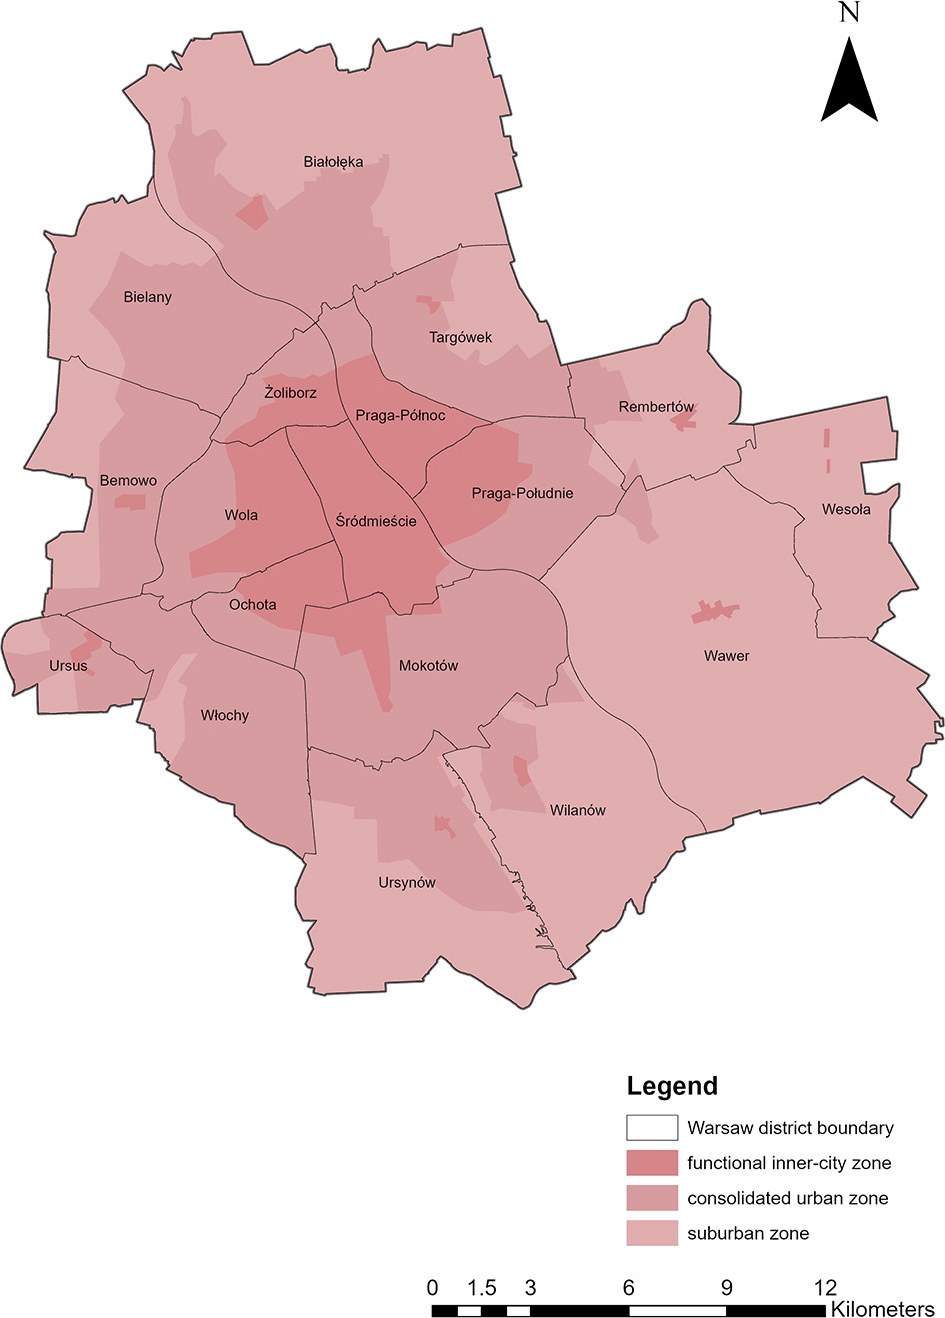
Fig. 2.
Administrative division and functional zones in Warsaw.
Table 3.
Summary of the services examined.
| Service | Optimum range [m] | Acceptable range [m] | Source of data on location of service points |
|---|---|---|---|
| Pre-schools | 300 | 600 | BDOT |
| Primary schools | 600 | 1200 | BDOT |
| Stations and stops of rail transport | 600 | 1200 | BDOT (rail and metro), OSM (trams) |
| Bus stops | 300 | 600 | OSM |
| Bicycle stations | 300 | 600 | OSM |
| Medical clinics | 600 | 1200 | BDOT |
| Community centres | 600 | 1200 | BDOT |
| Entrances to parks | 600 | 1200 | BDOT |
| Gyms | 600 | 1200 | OSM |
| Commercial facilities | 300 | 600 | OSM |
Table 4.
Scales for pairwise comparison (Saaty 1980).
| Variables | Preferences expressed in linguistic variables |
|---|---|
| 1 | Equal importance |
| 3 | Moderate importance |
| 5 | Strong importance |
| 7 | Very strong importance |
| 9 | Extreme importance |
| 2, 4, 6, 8 | Intermediate values between adjacent scale values |
Table 5.
Weights of the criteria obtained with the AHP method.
| Criteria | Preschools | Primary schools | Rail transport | Bus stops | Bicycle stations | Medical clinics | Communi ty centres | Entrances to parks | Gyms | Commerci al facilities |
|---|---|---|---|---|---|---|---|---|---|---|
| Pre-schools | 1.00 | 0.33 | 0.20 | 0.20 | 4.00 | 1.00 | 3.00 | 0.25 | 6.00 | 1.00 |
| Primary schools | 3.00 | 1.00 | 0.20 | 0.25 | 5.00 | 3.00 | 6.00 | 2.00 | 7.00 | 3.00 |
| Rail transport | 5.00 | 5.00 | 1.00 | 2.00 | 5.00 | 4.00 | 7.00 | 4.00 | 8.00 | 3.00 |
| Bus stops | 0.50 | 4.00 | 0.50 | 1.00 | 4.00 | 4.00 | 6.00 | 3.00 | 8.00 | 2.00 |
| Bicycle stations | 0.25 | 0.20 | 0.20 | 0.25 | 1.00 | 0.33 | 3.00 | 0.25 | 4.00 | 0.20 |
| Medical clinics | 1.00 | 0.33 | 0.25 | 0.25 | 3.00 | 1.00 | 5.00 | 3.00 | 5.00 | 0.33 |
| Community centres | 0.33 | 0.17 | 0.14 | 0.17 | 0.33 | 0.20 | 1.00 | 0.25 | 4.00 | 0.20 |
| Entrances to parks | 4.00 | 0.50 | 0.25 | 0.33 | 4.00 | 0.33 | 4.00 | 1.00 | 5.00 | 0.33 |
| Gyms | 0.17 | 0.14 | 0.13 | 0.13 | 0.25 | 0.20 | 0.25 | 0.20 | 1.00 | 0.17 |
| Commercial facilities | 1.00 | 0.33 | 0.33 | 0.50 | 5.00 | 3.00 | 5.00 | 3.00 | 6.00 | 1.00 |
| Σ | 16.25 | 12.01 | 3.20 | 5.08 | 31.58 | 17.07 | 40.25 | 16.95 | 54.00 | 11.23 |
| Criteria | Preschools | Primary schools | Rail transport | Bus stops | Bicycle stations | Medical clinics | Communi ty centres | Entrances to parks | Gyms | Commerci al facilities | WEIGHT |
|---|---|---|---|---|---|---|---|---|---|---|---|
| Pre-schools | 0.06 | 0.03 | 0.06 | 0.04 | 0.13 | 0.06 | 0.07 | 0.01 | 0.11 | 0.09 | 0.07 |
| Primary schools | 0.18 | 0.08 | 0.06 | 0.05 | 0.16 | 0.18 | 0.15 | 0.12 | 0.13 | 0.27 | 0.14 |
| Rail transport | 0.31 | 0.42 | 0.31 | 0.39 | 0.16 | 0.23 | 0.17 | 0.24 | 0.15 | 0.27 | 0.26 |
| Bus stops | 0.03 | 0.33 | 0.16 | 0.20 | 0.13 | 0.23 | 0.15 | 0.18 | 0.15 | 0.18 | 0.17 |
| Bicycle stations | 0.02 | 0.02 | 0.06 | 0.05 | 0.03 | 0.02 | 0.07 | 0.01 | 0.07 | 0.02 | 0.04 |
| Medical clinics | 0.06 | 0.03 | 0.08 | 0.05 | 0.09 | 0.06 | 0.12 | 0.18 | 0.09 | 0.03 | 0.08 |
| Community centres | 0.02 | 0.01 | 0.04 | 0.03 | 0.01 | 0.01 | 0.02 | 0.01 | 0.07 | 0.02 | 0.03 |
| Entrances to parks | 0.25 | 0.04 | 0.08 | 0.07 | 0.13 | 0.02 | 0.10 | 0.06 | 0.09 | 0.03 | 0.09 |
| Gyms | 0.01 | 0.01 | 0.04 | 0.02 | 0.01 | 0.01 | 0.01 | 0.01 | 0.02 | 0.01 | 0.02 |
| Commercial facilities | 0.06 | 0.03 | 0.10 | 0.10 | 0.16 | 0.18 | 0.12 | 0.18 | 0.11 | 0.09 | 0.11 |
| Σ | 1.00 | 1.00 | 1.00 | 1.00 | 1.00 | 1.00 | 1.00 | 1.00 | 1.00 | 1.00 | 1.00 |
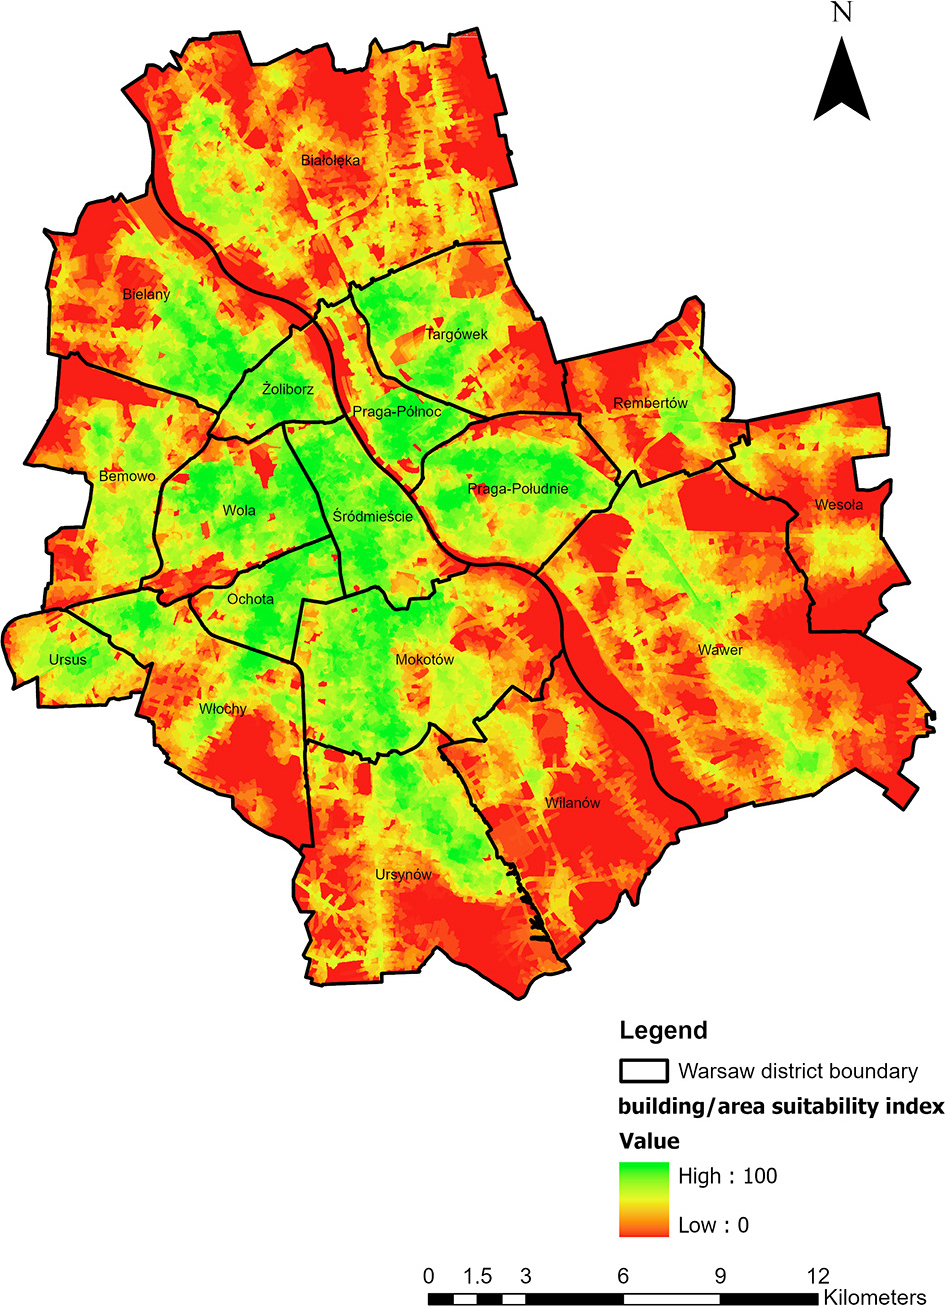
Fig. 3.
Distribution of the building/area suitability index in Warsaw.
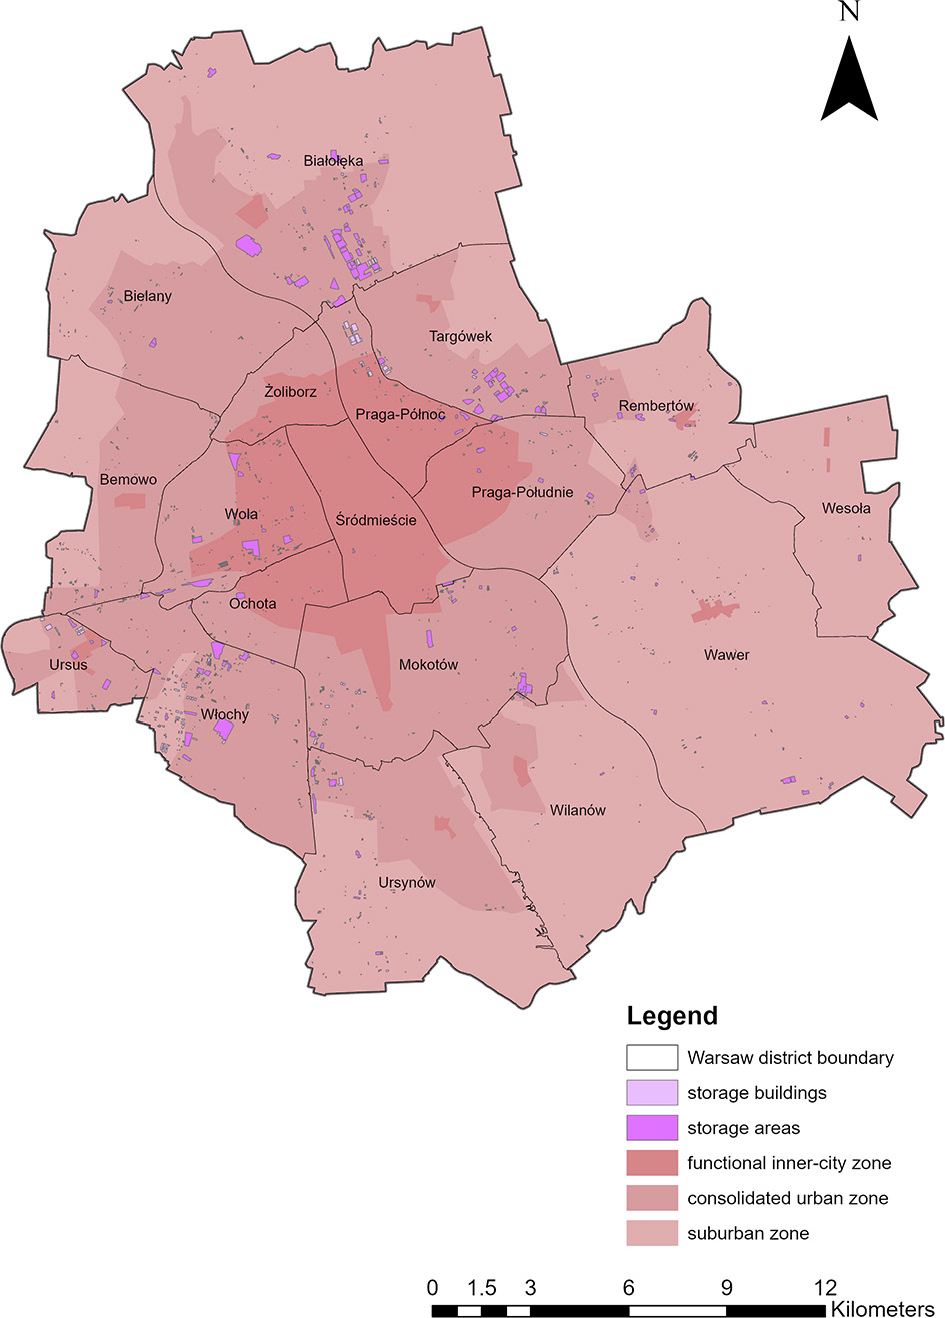
Fig. 4.
Distribution of buildings and storage areas in Warsaw.
Table 6.
Indicators for warehouse buildings in functional zones.
| Functional area | Number of buildings | Average building score | BSI |
|---|---|---|---|
| Functional inner city | 405 | 58.54 | 1053.11 |
| Consolidated urban | 991 | 39.85 | 3291.42 |
| Suburban | 546 | 32.10 | 868.43 |
Table 7.
Indicators for storage areas in functional zones.
| Functional area | Number of areas | Average score of areas | ASI |
|---|---|---|---|
| Functional inner city | 19 | 66.53 | 3424.15 |
| Consolidated urban | 106 | 36.04 | 12635.12 |
| Suburban | 36 | 33.47 | 2038.52 |
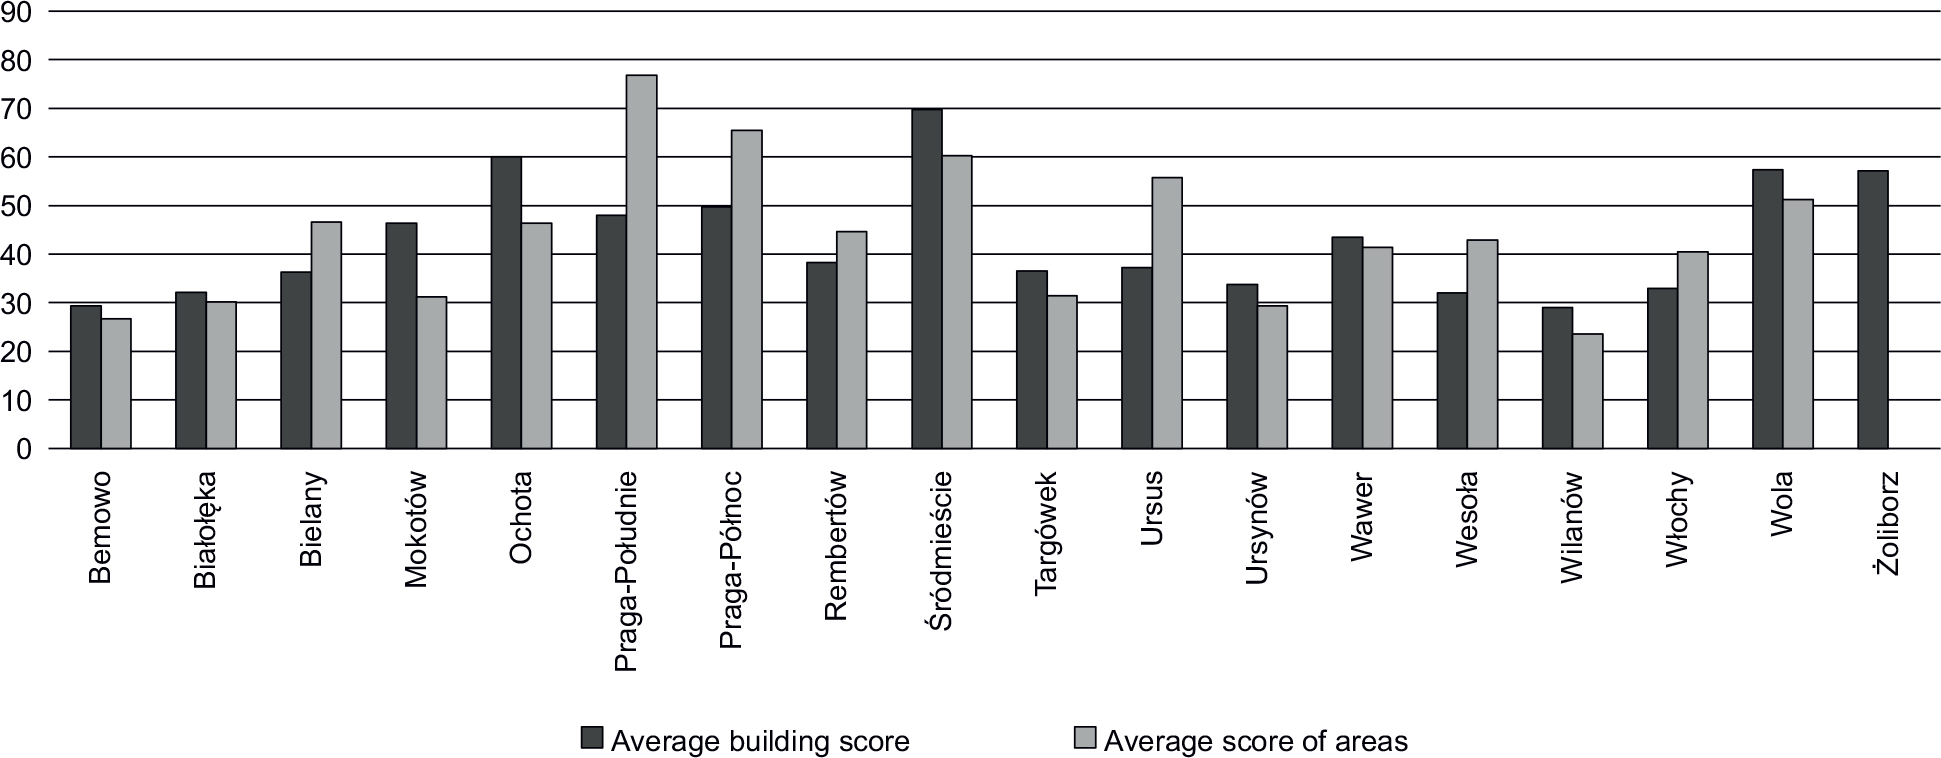
Fig. 5.
Indicators for warehouse buildings in districts.
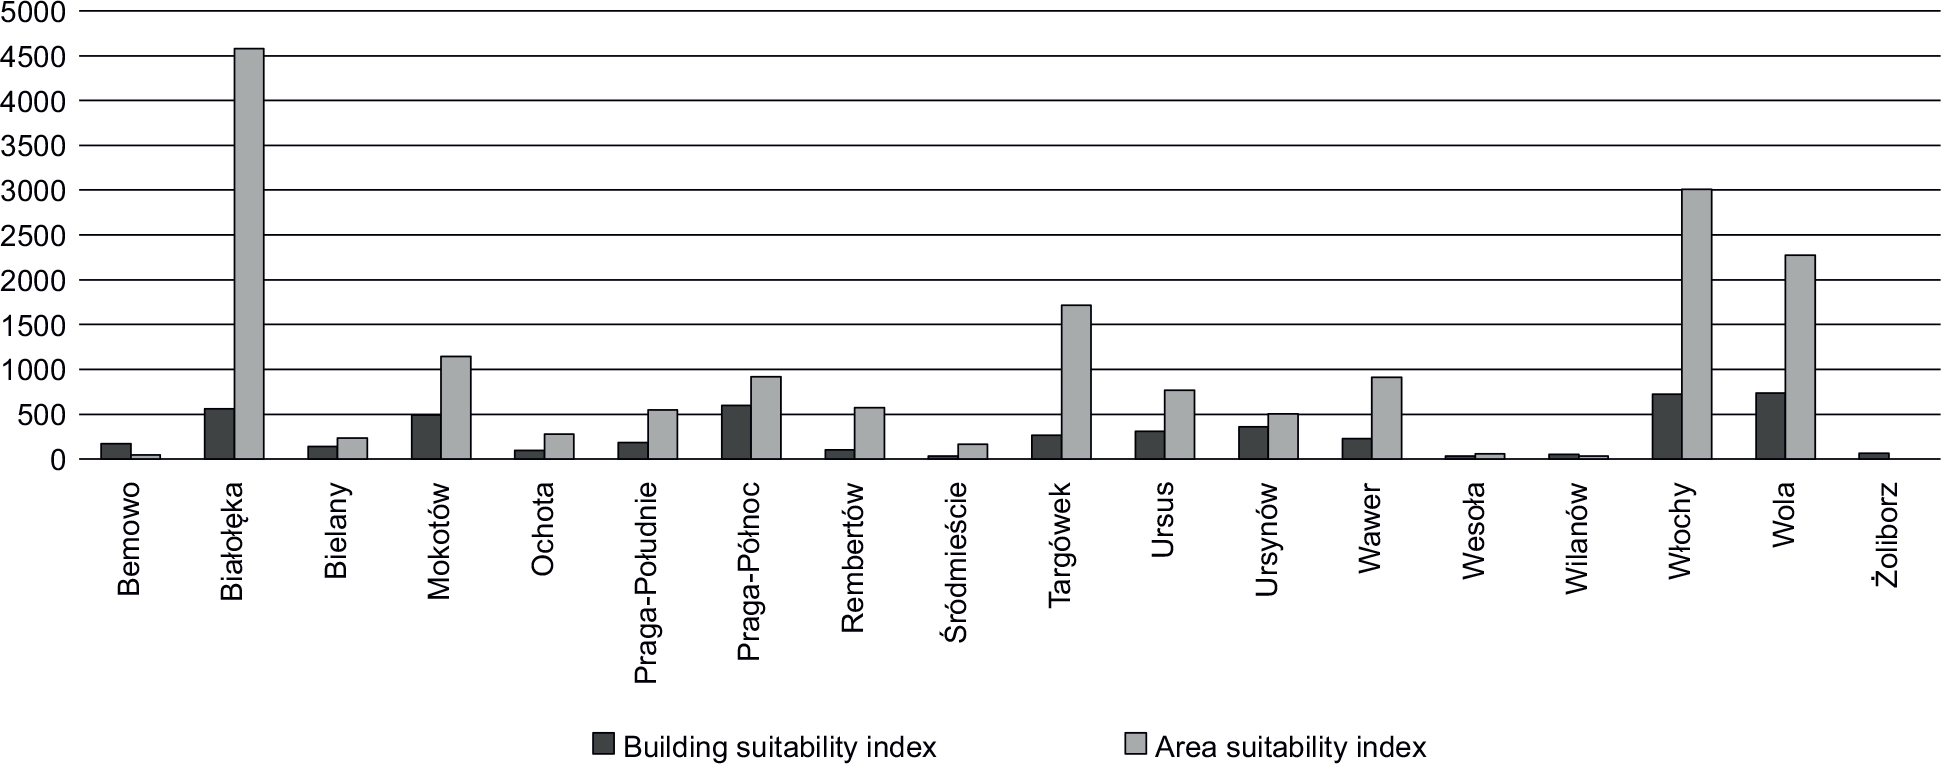
Fig. 6.
Indicators for storage areas in districts.
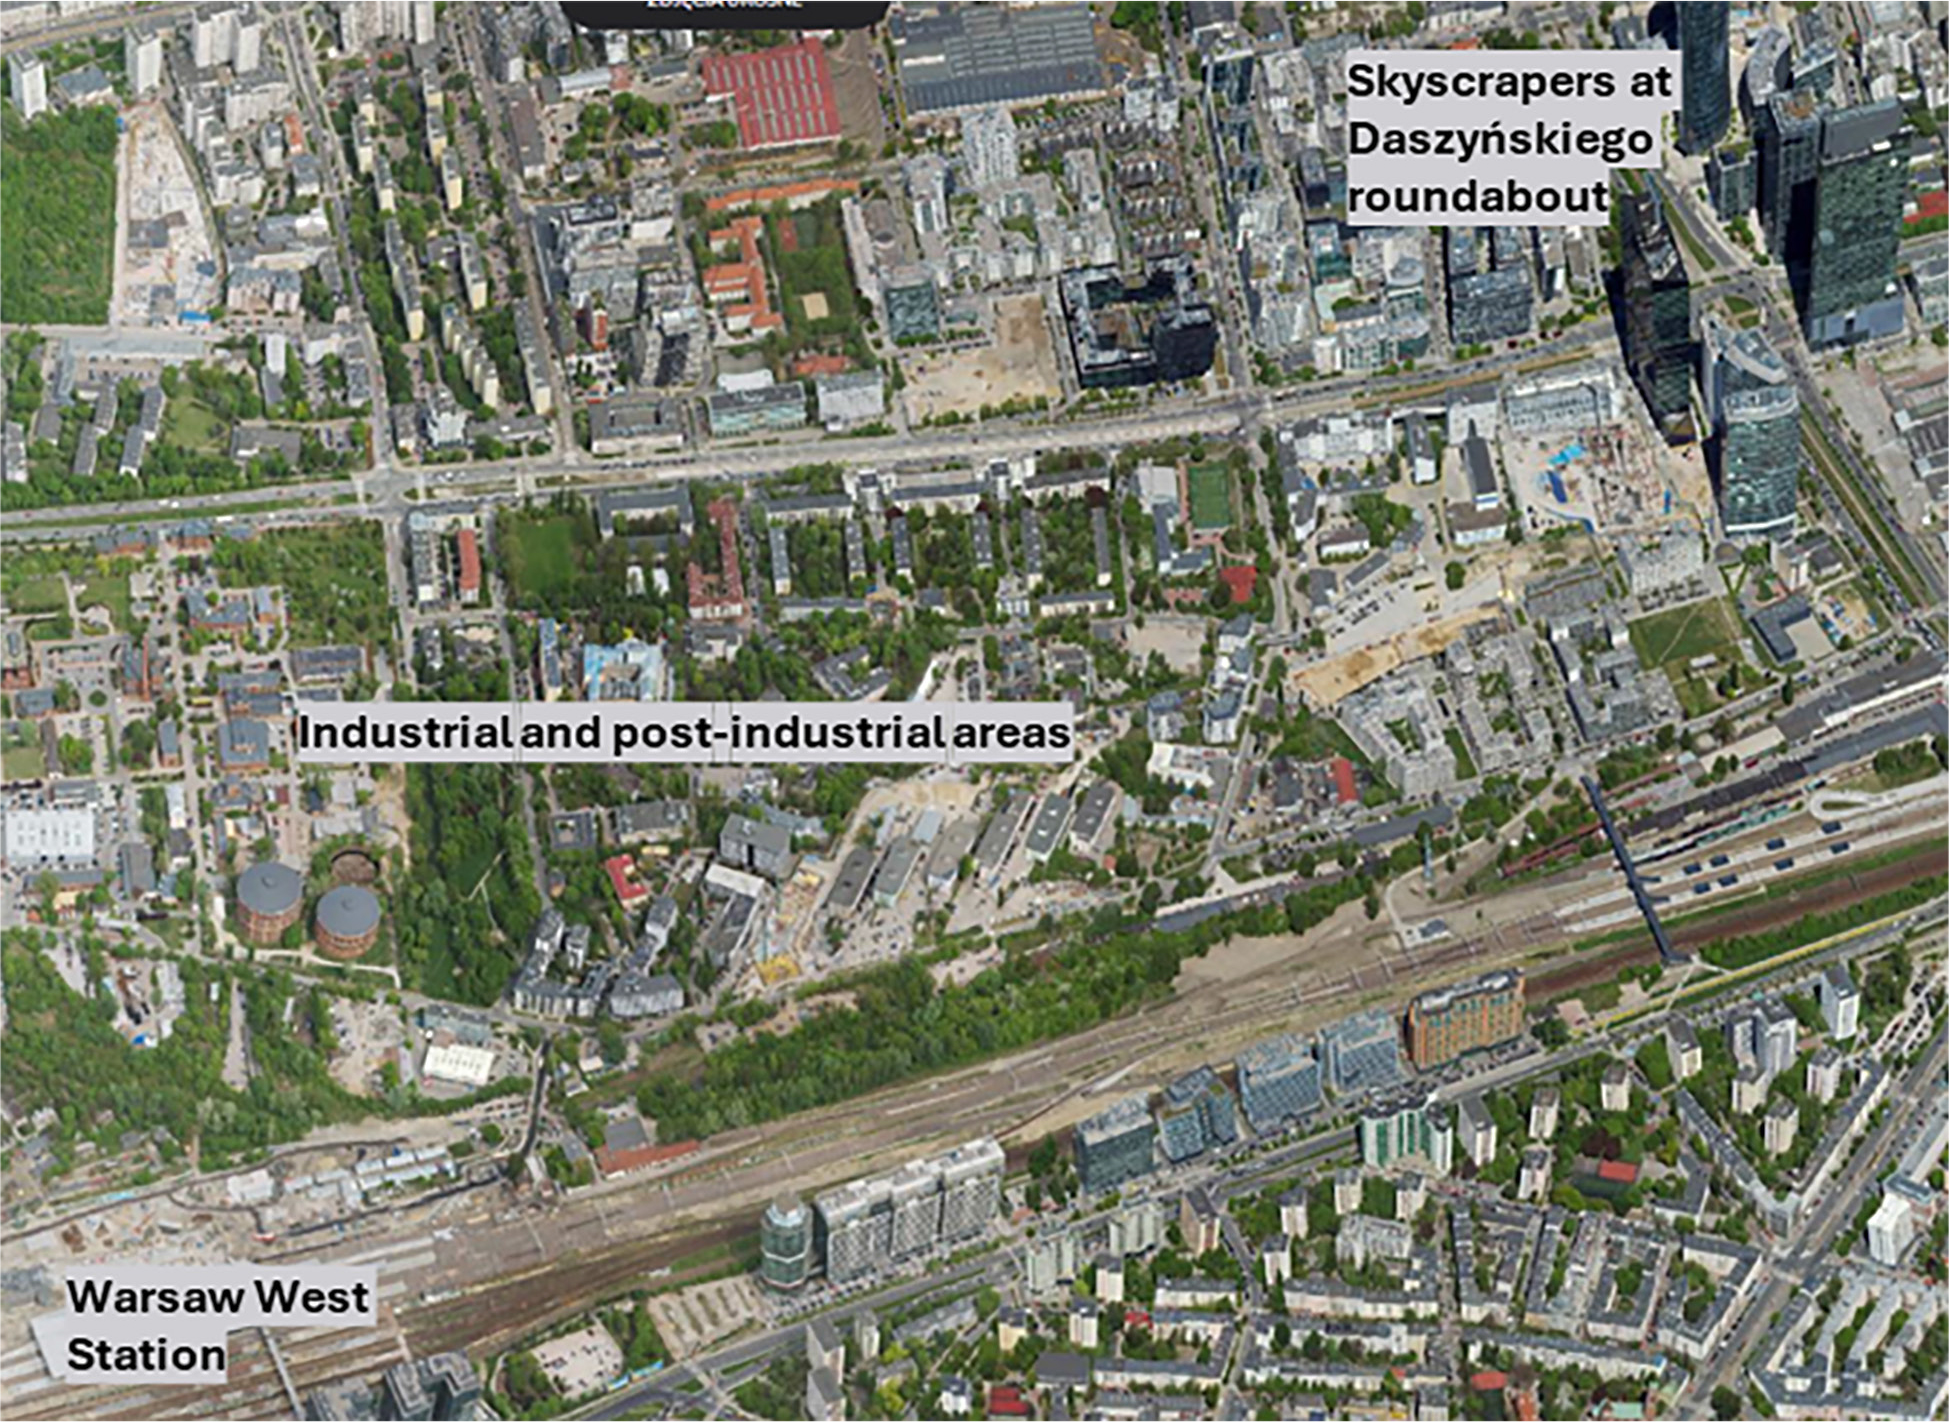
Fig. 7.
Industrial and post-industrial areas in Wola from https://ukosne.um.warszawa.pl/.
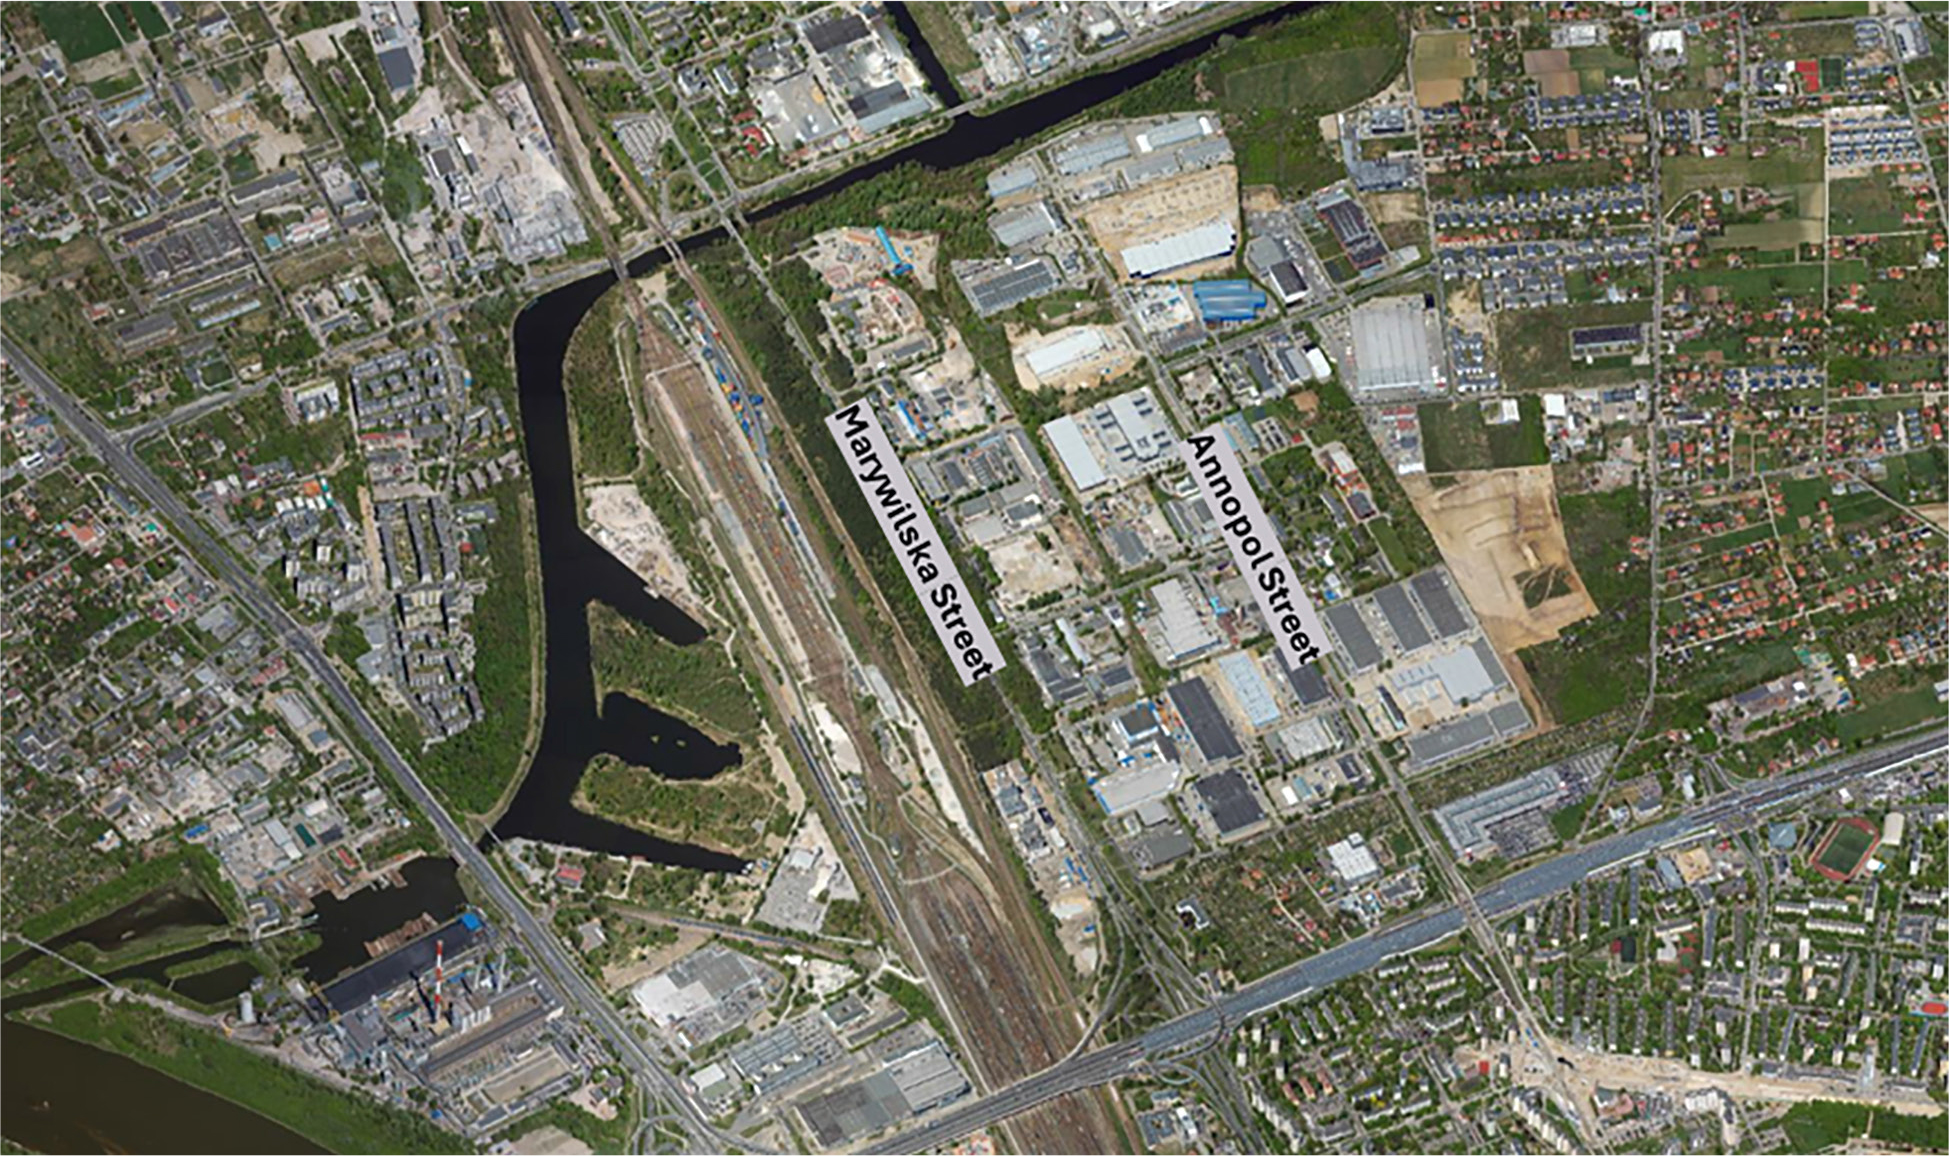
Fig. 8.
Industrial areas in the vicinity of Marywilska and Annopol streets from https://ukosne.um.warszawa.pl/.