Extremes or magnitudes, or quantitatively speaking, extreme values, are terms that can be said to be common today. They are found in public space, finance, social phenomena, environmental events, and even in people’s everyday lives. Extremes are also a common term for meteorological and climatological events. In the Google search engine (accessed on 22 May 2025), after entering natural extremes, over 1 billion results appear, and in the case of natural hazards, over 210 million results. These numbers prove that these terms are ubiquitous and widely used. But at the same time, knowledge about extremes, especially meteorological ones, is not common. Most often, only specialists who deal with Earth sciences on a probabilistic or research basis have reliable knowledge about them.
It is an incontrovertible fact that weather-related processes are the main drivers of natural extreme events in Poland and Central Europe. Their number already exceeds several dozen distinct types. Memorable examples include the torrential rains of July 1997 and, on a smaller spatial scale, September 2024 in Poland, which triggered catastrophic floods affecting large parts of the country. In turn, these floods induced local extreme geomorphological processes. Many other recent events – usually regional or even point-scale – could be cited. although their root cause is most often meteorological, the full understanding of such events is inherently interdisciplinary. Consequently, classifying extreme phenomena in terms of their causes, magnitude, and evolution is far from straightforward (Figs 1, 2).
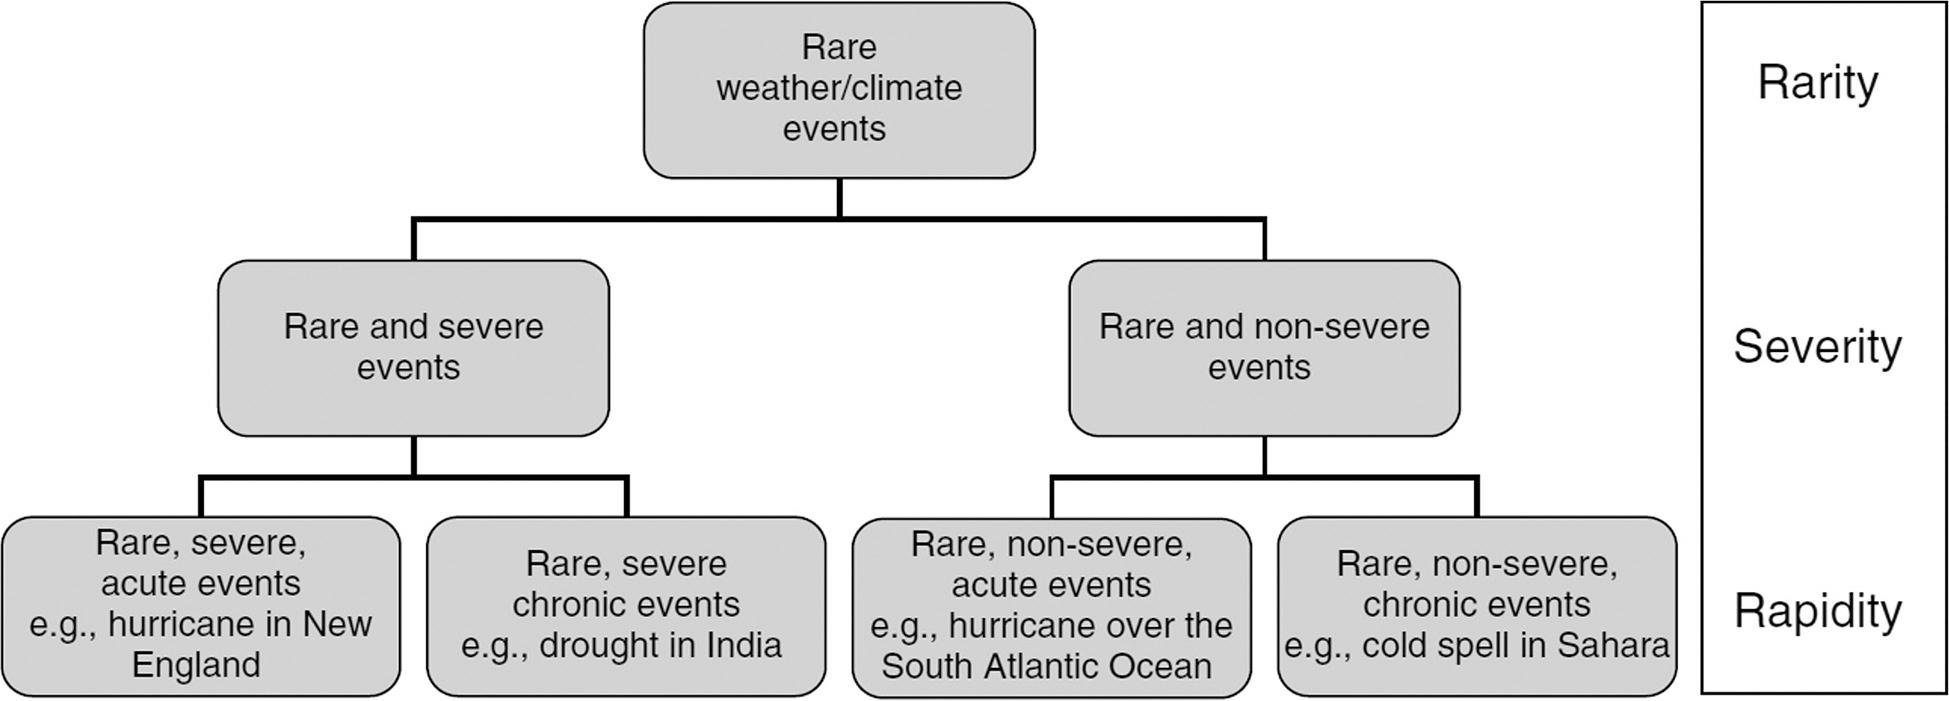
Simple taxonomy of extreme weather and climate events according to Stephenson (2008).
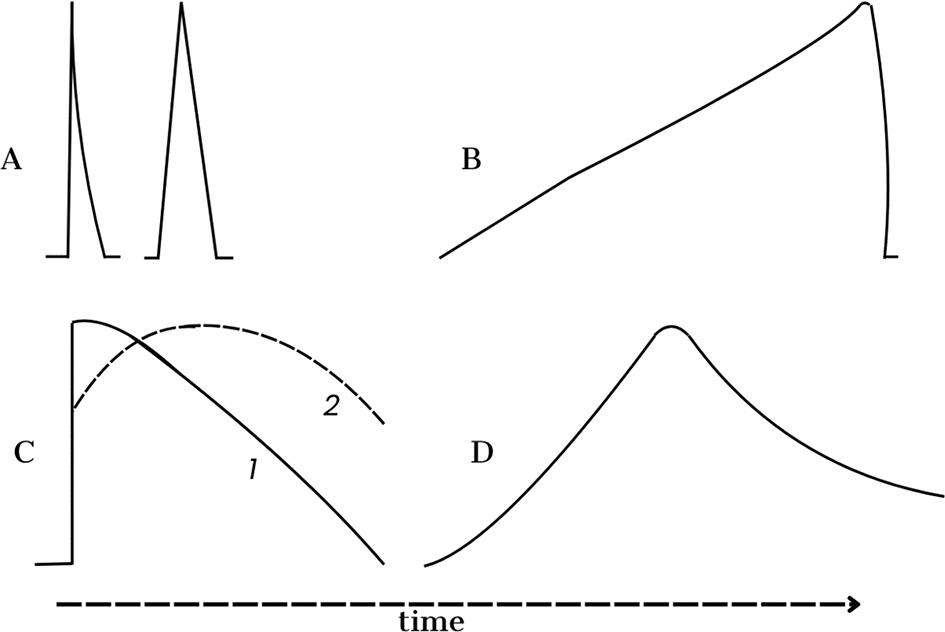
Intensity and duration of various extreme events according to Starkel (1999). A – short, sudden episodes; B – events that slowly build up and proceed quickly; C – events that appear suddenly and then spread further, 1 and 2 – differentiated reaction trajectories; D – events that slowly build up and disappear just as slowly.
Weather and climate have always shaped both the natural environment and human activity. While most meteorological phenomena follow the familiar annual cycle, the atmosphere occasionally produces values that deviate markedly from long-term norms. These are collectively termed extreme events. A universally accepted definition is elusive; in practice, extremes are often taken to be values whose probability of occurrence is 10% – or even 1% – corresponding to return periods of once every 10 years or 100 years, respectively. Many meteorological extremes, such as tornadoes, hailstorms or floods, may generate natural disasters (Starkel 1999). Because their socio-economic impacts are frequently severe, the United Nations and the World Meteorological Organization declared 1991–2000 the International Decade for Natural Disaster Reduction (IDNDR). Research on extremes, therefore, has clear economic relevance (Changnon et al. 2000, Beniston 2007).
The initial version of the present typology was developed under the project PBZ-KBN-086/P04/2003. It has since been applied, for example, by Jania and Zwoliński (2011) for geomorphological extremes in Poland and by Zwoliński (2011) in a broader review of natural hazards and their linkages. Numerous catastrophic events in recent years – both in Poland and globally – and the rapid growth of monitoring and information exchange have enriched our knowledge and prompted new criteria for identifying extremes. The aim of this article is therefore to present an updated classification that reflects the current state of research and detection capabilities. Only phenomena studied within Earth and environmental sciences are considered; biologically driven processes are excluded.
There are various extreme divisions and classifications in the world, along with databases that include them. Sometimes they concern different types of phenomena, which often also have a spatial and temporal scope. Of course, the division of phenomena found in these databases is sometimes subjective, and the criteria are not entirely quantitatively uniform. They only provide characteristics that distinguish these phenomena and the lack of exceptional features of their separation. Determining the affiliation to individual types may be an issue added to their classification. A striking example of this event is the occurrence of natural and technological events (hazards). There may be a case that a small meteorological impulse (non-extreme), e.g. weak gusts, can destroy some building structures that are in poor technical condition. The decision on what type of extreme event can be considered subjective. From the examples of databases, it is worth mentioning the publicly available EM-DAT(Delforge et al. 2025, EM-DAT 2025) or Peril classification (Integrated Research on Disaster Risk 2014) databases. The European Severe Weather Database (ESWD, eswd.eu) is also known and used, but it mainly contains data on extreme meteorological phenomena.
The contemporary literature on extreme events is vast. Below there are just a few examples of works on extremes, their understanding, terminology and criteria for their classification. After discussing the nature of extreme environmental events, we relate key definitions to international studies (Horton et al. 2001, IPCC 2001, 2023, Frich et al. 2002, Milly et al. 2002, Murnane, Diaz 2008). We draw on I. Starkel’s (2003) proposal to distinguish extremes by spatial extent and duration (Fig. 3) and note the clustering of extreme events in certain periods (Starkel 1999, 2002, 2006). The links between climate change and extremes are summarised by Fares (2021). Forecasting extreme climate events with models is particularly important (Beniston et al. 2007). Kundzewicz (2016) and Kouchak et al. (2020) show that the frequency and intensity of extremes are expected to rise in a warmer world, underlining the need for uniform classification and continuous monitoring. The ecological significance of meteorological extremes is equally great (Ummenhofer, Meehl 2017).
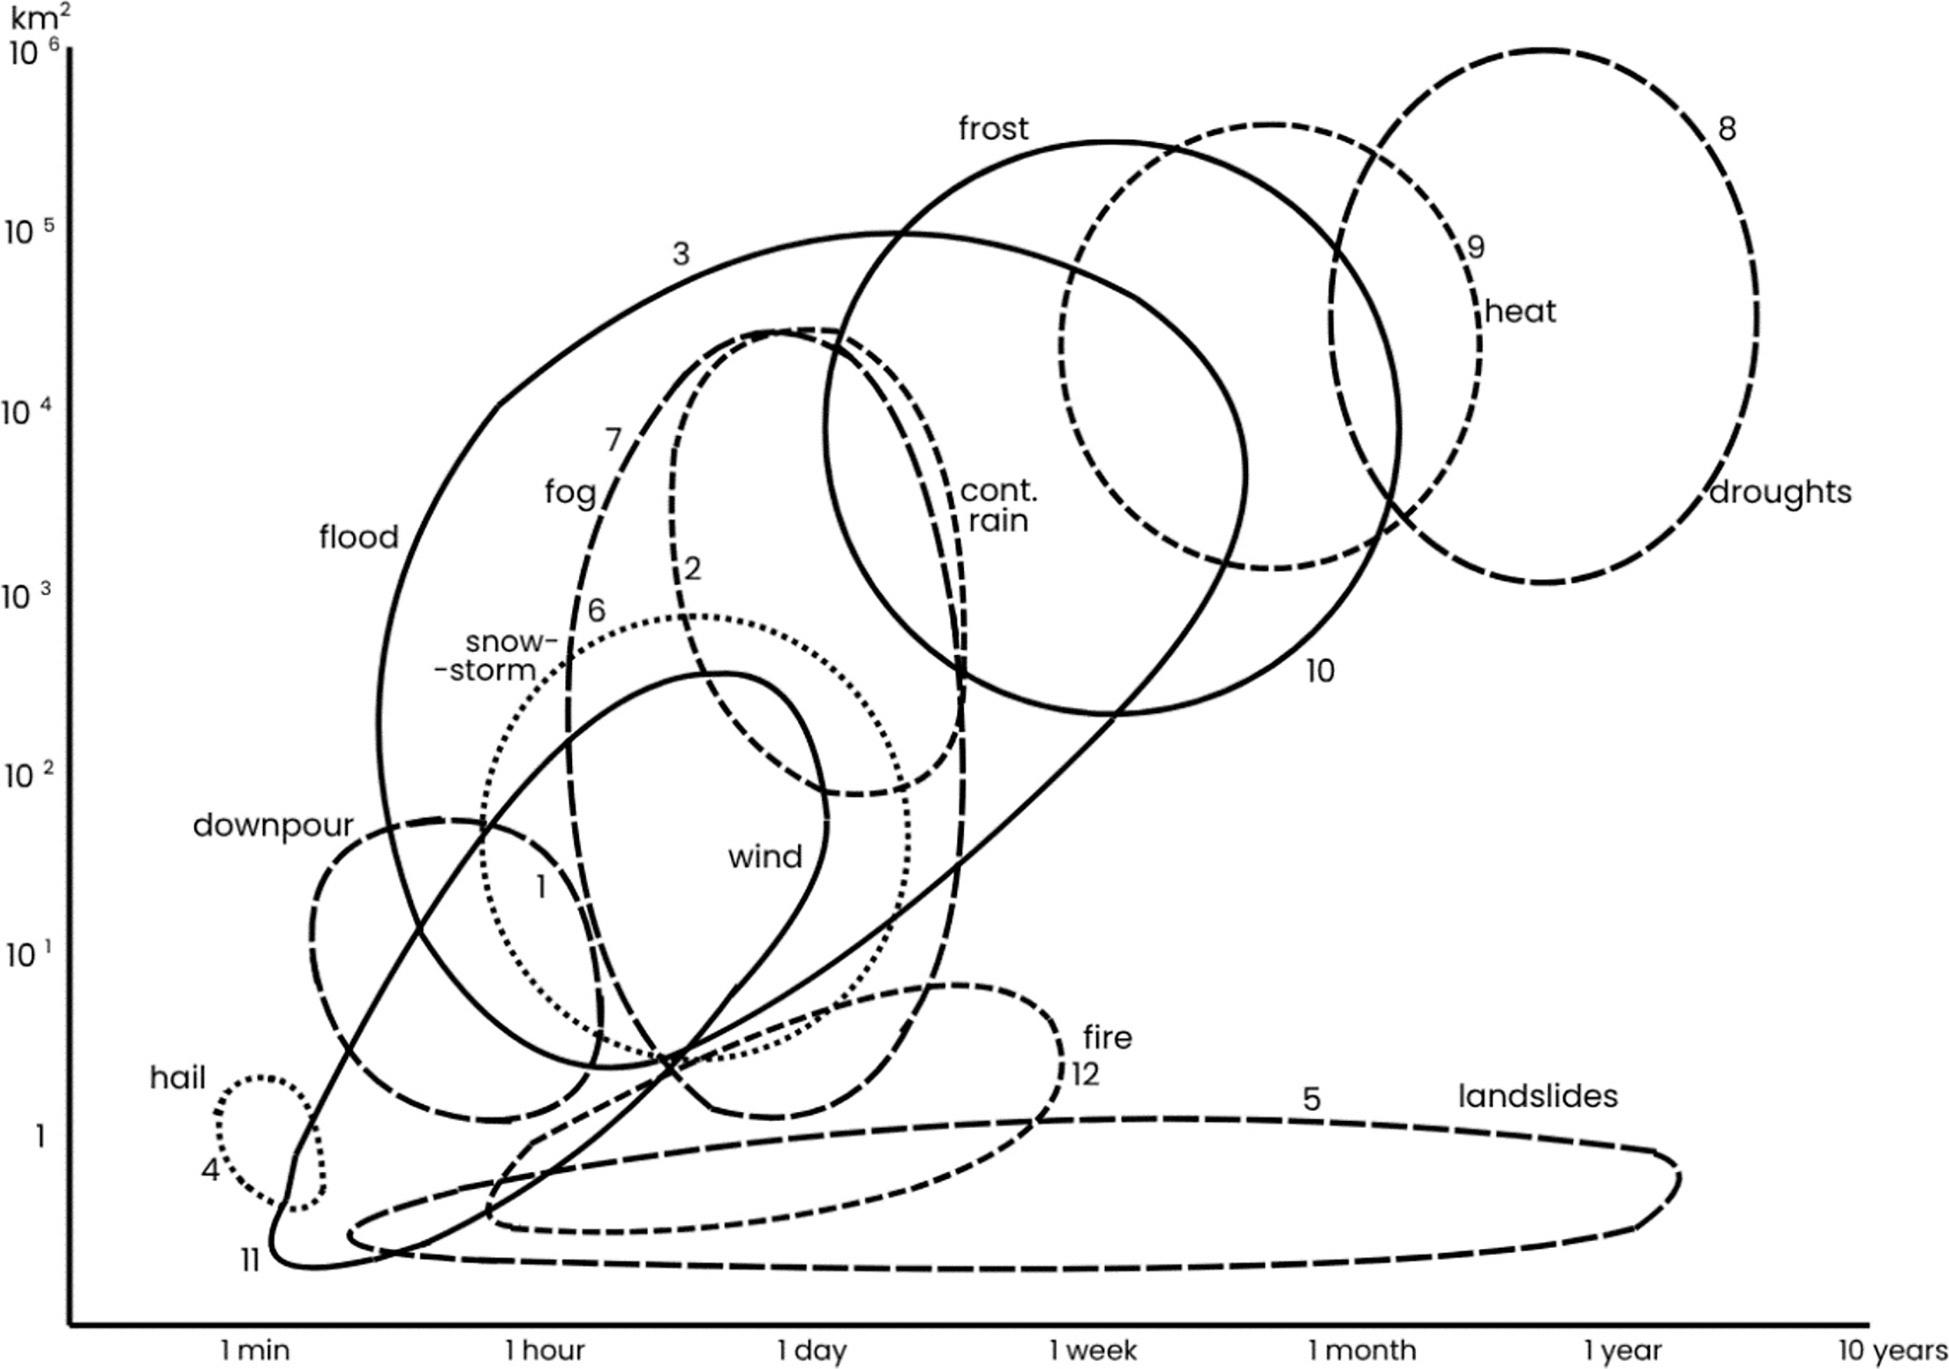
Spatial and temporal scales for different extreme events according to Starkel (2003).
Globally, many approaches exist for defining meteorological extremes (Folland et al. 1999, Heino et al. 1999, Karl, Easterling 1999, Nicholls, Murray 1999, Frei et al. 2002, Kyselý 2002, Christensen, Christensen 2003, Tomczyk, Bednorz 2016, Brönnimann et al. 2018, Hoy et al. 2020, Wibig 2021, Tomczyk, Katragkou 2025). Where possible, thresholds are stated explicitly – for example, water-vapour pressure ≥18.8 hPa as an index of sultriness, or wind speed ≥29 m · s−1 to classify hurricane-force winds. Broader, system-oriented definitions have also been proposed, e.g. An extreme event is a dynamic occurrence within a limited timeframe that impedes the normal functioning of a system or systems (Broska et al. 2020). In many practical applications, however, probabilistic characteristics remain the most informative, especially in hydrology. Following Polish and European practice (Gumbel 1958, Bogdanowicz, Stachý 1997, 1998, Jones et al. 1999, Niedźwiedź 1999, 2003, Przybylak et al. 2007, Klein Tank et al. 2009, Camuffo et al. 2020), we define an event as extreme when the probability of exceeding a given value is ≤10% (return period ≥10 years), and as exceptional when that probability is ≤1% (return period ≥100 years). Absolute maxima and minima from the longest available records (ideally ≥100 years) are also essential for planning purposes.
In summary, there is general consensus in the geoscience literature on the terms below:
- –
Absolute extreme (maximum/minimum): The highest or lowest value ever recorded for a given variable.
- –
Extreme event: A phenomenon or value close to the absolute extreme whose exceedance probability is ≤10% (return period ≥10 years). Stricter thresholds of 5%, 1% or 0.1% may be applied as required.
- –
Exceptional extreme: A phenomenon or value whose exceedance probability is ≤1% (return period ≥100 years).
- –
Natural disaster: A randomly occurring natural (or anthropogenically triggered) catastrophe causing great damage, sometimes with multiple fatalities.
However, the literature review indicates that the explanations of some terms presented above are not fully unambiguous and universally accepted. There is also no full agreement in the understanding and use of some terms such as natural extreme event, natural hazard, natural disaster and/or extreme phenomenon. In this work, the term extreme event is most often used, which is broad, although here it refers only to natural events. Sometimes, the term extreme phenomenon is also used interchangeably as a synonym. At the same time, many works present other definitions and concepts of the very distinction of natural extreme phenomena. This is hardly surprising, as it depends on the approach to understanding these events. The problem of dividing extreme phenomena has existed for a long time and there is no single universal method of dividing them. When distinguishing them, various aspects are taken into account such as the purpose of separating, statistical features, absolute values, the size of time and space scales, environmental measures or economic measures. Data sources, their quality and homogeneity, and temporal and spatial resolution are also important for analyses. It seems that sufficient, although general, recommendations for distinguishing extremes are contained in IPCC reports, especially TAR and AR6 (IPCC 2001, 2023). Although these well-known reports refer to weather and climate phenomena, they can be used in a broader sense. It is worth quoting them here: Extreme weather describes unusual weather events that are at the extremes of the historical distribution for a given area and extreme event is An event that is rare at a particular place and time of year (IPCC 2023).
The abundance of extreme phenomena necessitates their organisation into categories, types and subtypes. Five principal categories form the backbone of the scheme: Meteorological (sometimes called Climatological) (M), Hydrological (H), Geomorphological (G), Oceanographical (O), and Other (X). Within each category, types and subtypes are coded alphanumerically (e.g., M-1.3, Table 1). The lists below include the most widely used statistical descriptors or probabilistic thresholds. Detailed criteria should be calibrated to local conditions.
General concept of extreme event classification.
| Main categories | Meteorological | Hydrological | Geomorphological | Oceanographical | Other |
|---|---|---|---|---|---|
| [M] | [H] | [G] | [O] | [X] | |
| Types and subtypes | M-1 | H-1 | G-1 | O-1 | X-1 |
| M-2 | H-2 | G-2 | O-2 | X-2 | |
| M-3 | H-3 | G-3 | O-3 | X-3 | |
| … | … | … | … | … | |
| M-n | H-n | G-n | O-n | X-n | |
| Events | Combined/Synergistic | ||||
The chapter presents all identified phenomena that occur in the study area. As already stated, this division can also be applied, sometimes with modifications, to other regions of Europe or even the world. Meteorological phenomena are marked with symbols from M-1 to M-8, hydrological – from H-1 to H-6, geomorphological – from G-1 to G-8 – oceanographical from O-1 to O-6 and the rest are designated as X (X1–X7). Within the individual extreme phenomena, the most frequently used statistical characteristics or criteria are proposed to determine the range of values for the occurrence of a given element or to provide probabilistic estimates of exceeding the given limit values. Detailed criteria refer to the specific area of their occurrence.
Extreme meteorological phenomena are all phenomena that are the result of processes occurring in the atmosphere, which in its lower part is often subject to the impact of the Earth’s surface. They have a different nature and course. Their detection in recent years has been much more accurate than in the second half of the 20th century. This has become possible thanks to the increasingly common use of automatic meteorological stations and modern remote sensing systems (satellites, radars, and lightning detectors). The use of the above-mentioned measurement and observation systems allows for the distinction of new, quantitative and precise characteristics that could not be used before. However, when analysing data from these systems, their homogeneity should be considered, especially if they are used to study multi-year sequences. This also applies to caution when analysing individual values, including station (point) measurements. As is known, new meteorological instruments are often based on technical solutions that may generate values that are not fully consistent with previously used instruments (e.g. currently practically unlimited sampling frequency of air temperature, humidity, wind, use of heated rain gauges, etc.). The proposed division of extreme meteorological phenomena is adapted to Polish conditions, but many of its indicators refer to the European list used, among others, by the European Climate Assessment and recommended by CCl/CLIVAR experts from the World Meteorological Organisation.
- M-1.1.
Maximum hourly rainfall.
- M-1.2.
Maximum daily rainfall, especially with a probability of p <10% (when characterising this rainfall, the number of days with rainfall ≥10.0 mm, ≥30.0 mm, ≥50.0 mm and ≥100.0 mm should be taken into account).
- M-1.3.
Long-term, widespread rainfall ≥200.0 mm/3 days.
- M-1.4.
Maximum monthly rainfall total with a probability of p <10% (especially rainfall exceeding 200 mm).
- M-1.5.
Heavy rain or cloudburst (according to the Chomicz scale), maximum rainfall intensity in mm/min and duration.
- M-1.5.1.
Maximum precipitation total in 10 min.
- M-1.5.1.
- M-1.6.
Drought (no precipitation for at least 15 days). It is also recommended to include monthly precipitation totals of <10 mm.
- M-1.7.
Other extreme precipitation events.
- M-2.1.
Very strong wind (10-min average speed ≥15 m · s−1). Number of days with very strong wind with a probability of 10% (for lowland areas, strong winds with a 10-min average speed of ≥10 m · s−1 can be considered).
- M-2.2.
Maximum wind gust QNT within 21– 28 m · s−1 – gale (or storm 9–10 B at sea). Number of days with wind gusts QNT >20 m · s−1.
- M-2.3.
Violent gale or hurricane of a different genesis than tornadoes (e.g. winds on the squall line, during storms with clear ‘arcus’ clouds, storms on the coast) causing economic damage (gusts QNT >28 m · s−1 or strong storm >10°B).
- M-2.4.
Local winds (e.g. foehn, bora).
- M-2.5.
Whirlwind (tornado).
- M-2.6.
Long-term calms (or weak winds <2 m · s−1), lasting >10 days.
- M-2.7.
Other extreme wind characteristics.
- M-3.1.
Thunderstorms cause fires as a result of lightning discharges, which can cause fatal accidents or paralysis of people. Estimation of the number of days with a thunderstorm with a probability of 10%.
- M-3.2.
Hail causing economic damages.
- M-4.1.
Maximum snow cover thickness. The most important indicators include maximum snow cover thickness with a probability of 10% and the number of days with snow cover with a probability of 10%.
- M-4.2.
A daily increase in snow cover of 10 cm. The number of days with a daily increase in snow cover of >10 cm with a probability of 10% can be designated as an indicator.
- M-4.3.
Disappearance of snow cover (melt): reduction in thickness by >10 cm · day−1.
- M-4.4.
Snow drift or blizzard causing serious difficulties in communication.
- M-4.5.
Snow avalanche in the mountains, posing a threat to life.
- M-4.6.
Other extreme characteristics of snow cover.
- M-5.1.
Rapid changes in atmospheric pressure (≥+10.0 hPa/3 h; ≤-10.0 hPa/3 h; also changes in the daily mean by ±24 hPa/24 h).
- M-5.2.
Deep cyclone with P0 ≤980 hPa (P0denotes atm. pressure at sea level).
- M-5.2.1.
Tropical cyclone
- M-5.2.1.
- M-5.3.
Strong high with P0 ≥1050 hPa (P0denotes atm. pressure at sea level).
- M-5.4.
Extreme values of the western circulation index over Poland.
- M-5.5.
Extreme values of the southern circulation index over Poland.
- M-5.6.
Other extreme characteristics of atmospheric pressure and circulation.
- M-6.1.
Extremely hot day (Tmax ≥35.0°C). The maximum number of extremely hot days and with a probability of 10%.
- M-6.2.
Extremely frosty day (Tmin ≤-30.0°C). The maximum number of extremely frosty days and with a probability of 10%.
- M-6.3.
Tropical night (Tmin ≥20.0°C). Maximum number of tropical nights and with a probability of 10%.
- M-6.4.
Absolute maximum temperature (possibly also values with a probability of 10%).
- M-6.5.
Absolute minimum temperature (possibly also values with a probability of 10%).
- M-6.6.
Shortest and longest frost-free period (years of occurrence). Length of the frost-free period with a 10% probability. Also exceptional, extreme dates of first and last frosts.
- M-6.7.
Heavy frost in May (Tmin ≤-2.0°C). Number of days with heavy frost in May, maximum and with a 10% probability.
- M-6.8.
Frost in the summer months (June–August).
- M-6.9.
Sudden changes in air temperature (daily average) from day to day, exceeding ±10 K. Paying special attention to days with temperatures passing through 0°C.
- M-6.10.
Other thermal extremes.
- M-7.1
Extreme bioclimatic conditions that pose a threat to human health. Selected bioclimatic indicators with a probability of 10% (number of muggy days – water vapour pressure ≥18.8 hPa, number of days with exceedance of specific values of perceived temperature [determination of limit values], number of days of occurrence of bioclimatic discomfort – conditions of excessive cooling or overheating of the body).
- M-7.2.
Icing or rime with an intensity causing economic damage.
- M-7.3.
Fog, in which visibility is <50 m, causes serious communication difficulties.
- M-7.4.
Smog situations – exceedance of daily standards of permissible concentration of atmospheric pollution.
Catastrophic hydrological events are the result of extreme atmospheric or geological situations related to processes occurring in the Earth’s crust. Other causes of these events result from the economic impact on the environment, which is particularly evident in the failure of production, storage and transport equipment. Very often they are caused by a single event (less often a combination of events) causing the start of a chain of changes leading to extreme situations in the geographical environment. There are many studies that undertake the task of classifying catastrophic events or extraordinary environmental hazards (including Starkel 1999, 2002, 2003, Maciejewski 2000, 2002). Ultimately, extreme situations are assessed, both in hydrology and in the economy, in terms of the quantity (excess or lack) and quality of water (corresponding or not to the adopted quality standards, or possibly in the categories: natural, polluted, contaminated).
- –
boundary flow = ALF (average low flow).
The main characteristics of low flows were distinguished based on the boundary flow and other parameters such as:
- –
absolute minimum flow,
- –
flow with a probability of 1%,
- –
flow with a probability of 10%,
- –
average low flow,
- –
minimum low flow,
- –
duration,
- –
volume of low flow (volume of water deficit),
- –
frequency of occurrence,
- –
minimum water level,
- –
duration of flow with values lower than biological (intact) flow.
- –
- H-1.1.
Hydrological droughts.
- H-1.2.
Low-flows.
- H-1.3.
Disappearance of rivers, springs and water reservoirs.
- –
limiting flow = AHF (average high flow).
The main characteristics of floods were distinguished based on the limiting flow and other parameters such as:
- –
absolute maximum flow,
- –
flow with a probability of 1%,
- –
flow with a probability of 10%,
- –
average flood flow,
- –
maximum flood flow,
- –
volume of flood,
- –
duration of flood,
- –
maximum flood level,
- –
duration of water levels exceeding the alarm level,
- –
maximum credible flood,
- –
inundation area.
- –
- H-2.1.
Summer floods are caused by long-lasting heavy rains.
- H-2.2.
Summer floods are caused by heavy downpours (cloudbursts).
- H-2.3.
Floods from melting snow.
- H-2.4.
Ice-jam floods.
- H-2.5.
Storm floods.
- H-2.6.
Floods due to dam failure are caused by natural forces.
- –
occurrence of above-average duration. Main characteristics:
- –
Duration of ice cover with probability p <10%,
- –
Ice cover thickness: maximum and with probability p <10%,
- –
Duration (longest and shortest duration) of ice phenomena,
- –
Dates of appearance and disappearance of individual forms of ice,
- –
Intensity of occurrence of individual forms of ice.
- –
- H-3.1.
Duration of ice cover with probability p <10%.
- H-3.2.
Thickness of ice cover with probability p <10%.
- H-3.3.
Ice dams on the river.
- H-3.4.
Extreme icing of rivers and lakes.
- H-5.1.
Significant decrease in groundwater levels, with probability p <10%.
- H-5.2.
High groundwater conditions with probability p <10%. Local flooding.
The analysis of the occurrence of extreme geomorphological events usually closely relates to meteorological and hydrological events. Among them, the most important extreme geomorphological phenomena and events occurring in Poland have been distinguished, which are usually recorded outside the standard measurement network.
- G-1.
Intensive soil erosion during torrential rains (washing/sheet and rill erosion, gully erosion, suffusion/soil piping, shallow mass movements) or flooding. When examining these phenomena, it is necessary to refer to precipitation characteristics (precipitation limits: average intensity >0.5 mm · min−1, daily precipitation limits: >30 mm, >100 mm).
- G-2.
Intensive soil erosion during thaws (washing/sheet and rill erosion, shallow mass movements). Paying attention to the limit values of meteorological phenomena, during which the following phenomena may occur: frozen ground, rapid snow melting and rainfall.
- G-3.
Landslide processes – various types, from rock falls, landslides, debris flows to solifluction, deep rockfalls or rock avalanches. Limit values: rock falls, landslides – high rainfall total; debris flow – high rainfall intensity (+total); deep landslides – long-term rainfall duration (high monthly total, low intensity).
- G-4.
Intensive river erosion/fluvial erosion (lateral, downstream/vertical, bed spill/avulsion). Limit values of hydrological phenomena: at flow close to full-channel/bankfull discharge.
- G-5.
Intensive accumulation in the bed (slush)/fluvial deposition in channel/bars, as above.
- G-6.
Intensive accumulation on the floodplain/fluvial deposition on the floodplain (full-channel flow exceeded).
- G-7.
Intense deflation and aeolian accumulation/wind deposition (in areas without vegetation). The duration of winds with speeds >17 m · s−1 and higher (e.g. gusts >20 m · s−1) is important. Also other geomorphological effects of strong winds, such as tree uprooting.
- G-8.
Intense abrasion of seashores and other water bodies.
- G-9.
Other geomorphological events.
These phenomena are the result of processes within the seas and interactions with the atmosphere and land. In relation to this classification of extreme events, they include the sea-land contact zone and the coastal area.
- O-1.
Extreme storm surges of sea level (≥70 cm from zero normal water gauges).
- O-2.
Extremely low sea levels (≤-70 cm from zero normal water gauges).
- O-3.
Extremely high water temperature with strong development of cyanobacteria and algae near the shore.
- O-4.
Upwelling of cold deep water near the shore – contrastingly low sea water temperature in relation to air temperature (≤10°C), causing discomfort and even a health hazard for those entering the water from a hot beach.
- O-5.
Tsunami phenomena.
- O-6.
Other extreme oceanographical events (e.g. icing of ships and port structures [cranes] due to freezing of water spray during storms at low air temperatures).
This category includes other extreme phenomena that have not been classified in the previously mentioned categories. Their direct cause is not meteorological or hydrological phenomena.
- X-1.
Mining damage (sinkholes).
- X-2.
Earthquakes.
- X-3.
Volcanic eruptions.
- X-4.
Large forest, peat bog and other fires.
- X-5.
Excessive development of plant pests.
- X-6.
Locust raids.
- X-7.
Other catastrophic events (e.g. meteorite impacts).
The proposed scheme permits the identification of compound or synergistic events, coded by linking categories (e.g. M1/H1/G1). Meteorological extremes frequently trigger hydrological and subsequently geomorphological responses (Zwoliński 2011, Niedźwiedź, Starkel 2021). Compound-hazard mapping was also developed within the project titled IT system for country protection against extreme hazard (ISOK, isok.gov.pl), co-financed by the EU within the Innovative Economy Operational Programme (2010–2018). As part of this project, many maps were created on a Polish scale, presenting the areas of occurrence of hazards and risks of several categories, which were fully synergistic, e.g. Figure 4. A significant number of them concerned meteorological phenomena, which were presented in the historical (climatological) and operational (forecasting) dimension (Ustrnul et al. 2015). Many of the solutions used there are reflected in the so-called dynamic maps presented on the Institute of Meteorology and Water Management-National Research Institute (IMWM-PIB, imgw.pl) website.
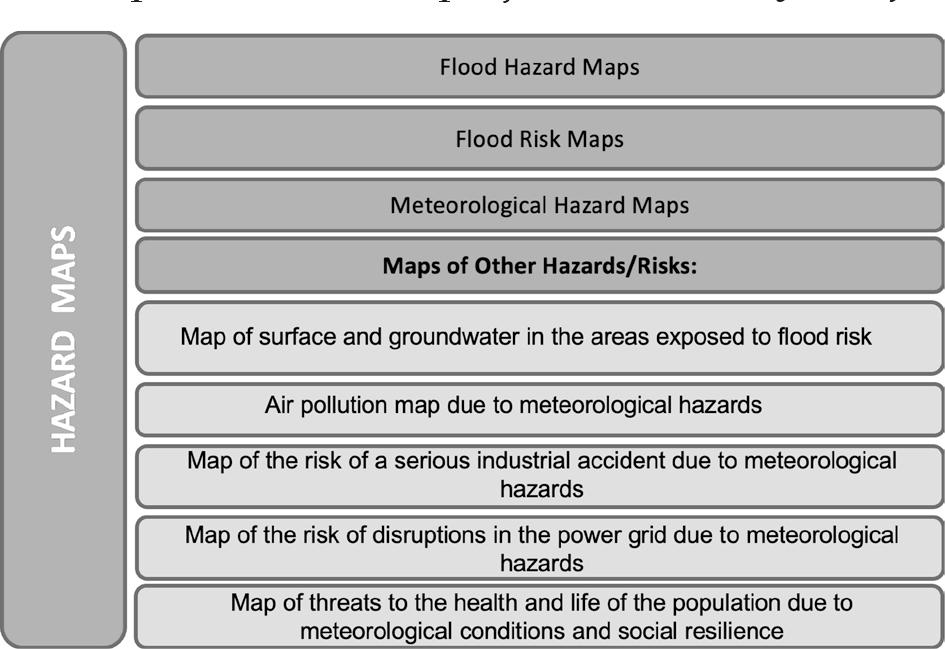
Types of hazard maps presented in the ISOK project.
The proposed classification – initially created by a multi-institutional team during the 2004– 2009 national project – has been updated to incorporate recent extreme events and advances in monitoring. Although the classification was developed for the environmental conditions of Central Europe, it may have a broader geographical dimension and cover other geographical regions. Probabilistic thresholds or widely accepted empirical limits were adopted, especially for meteorological triggers. Organising extremes into five main categories (M, H, G, O, X) plus coded types and subtypes should facilitate consistent reporting and comparison. The quasi-decimal structure is open-ended, allowing future expansion without altering its core. Ongoing automation of observing networks and the growing use of remote sensing will almost certainly necessitate further refinements.