
Fig. 1.
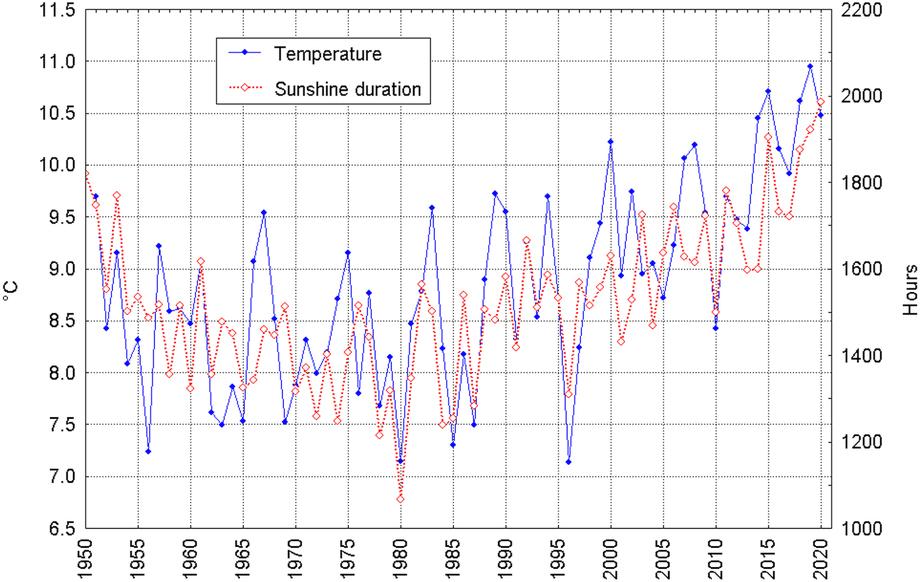
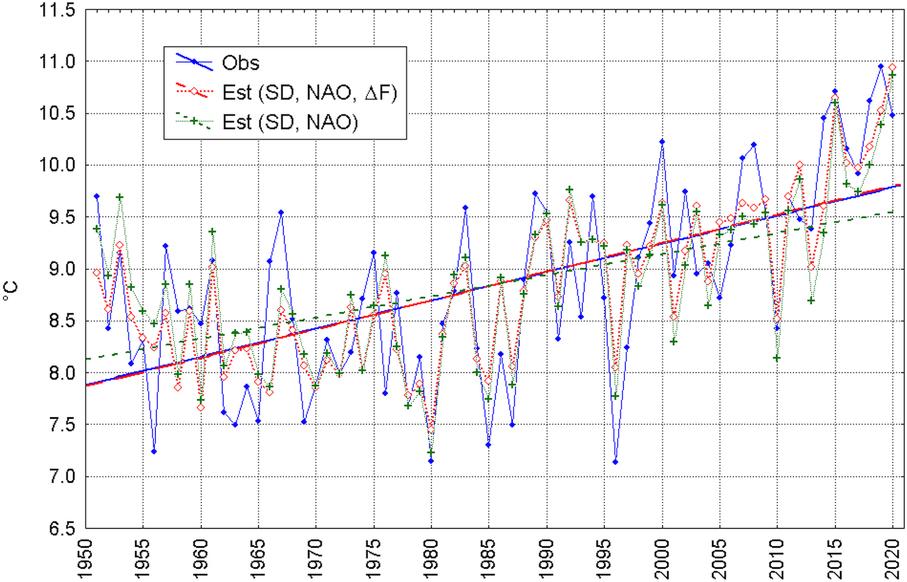
Fig. 2.
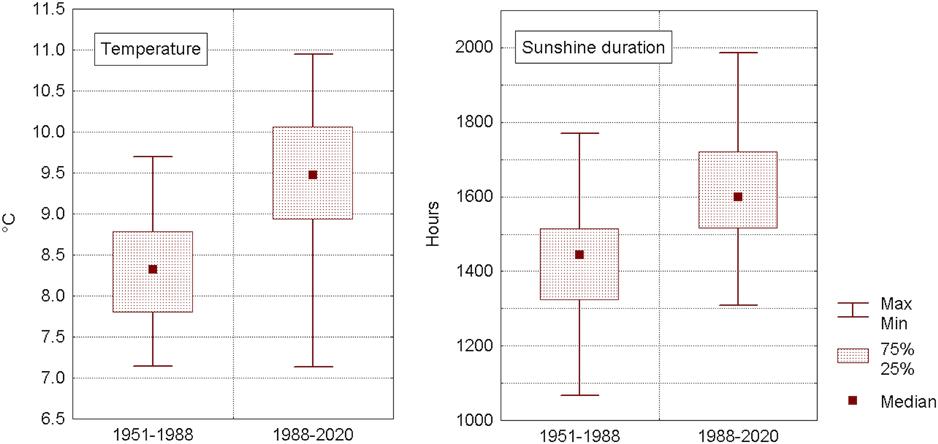
Fig. 3.
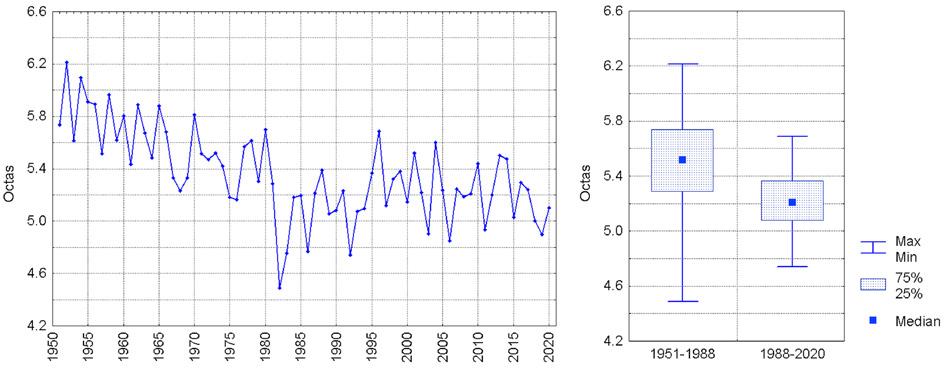
Fig. 4.
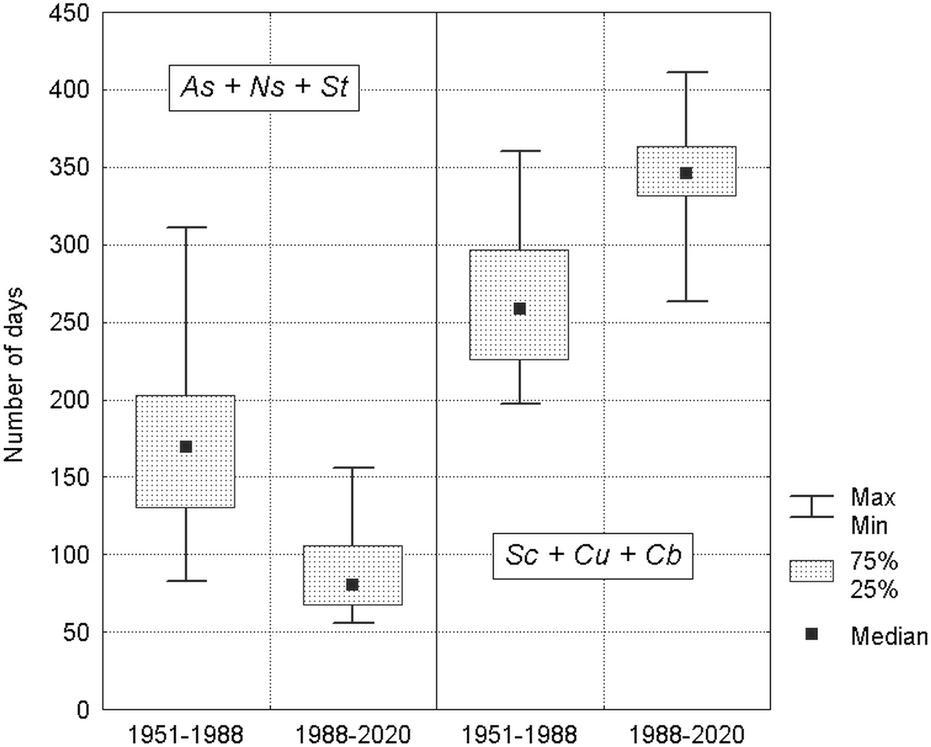
Fig. 5.
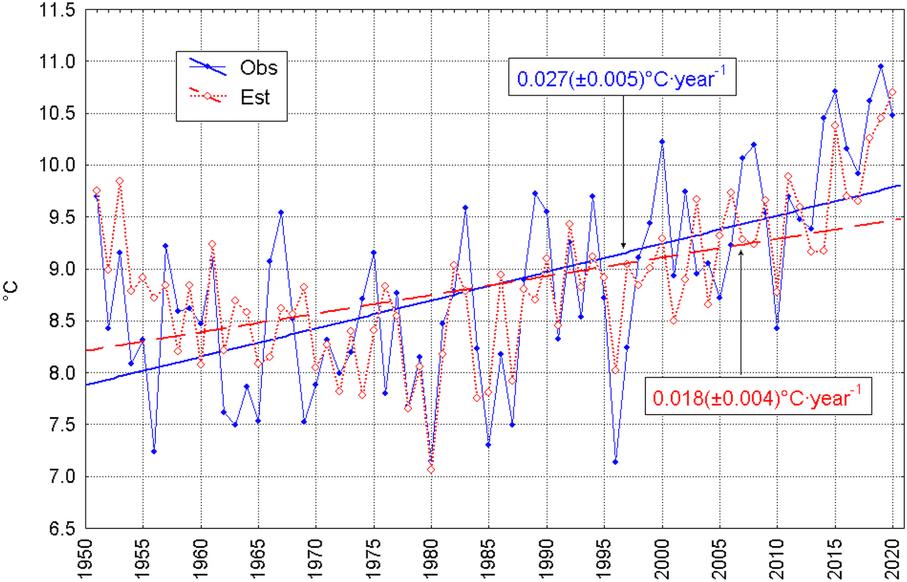
Fig. 6.
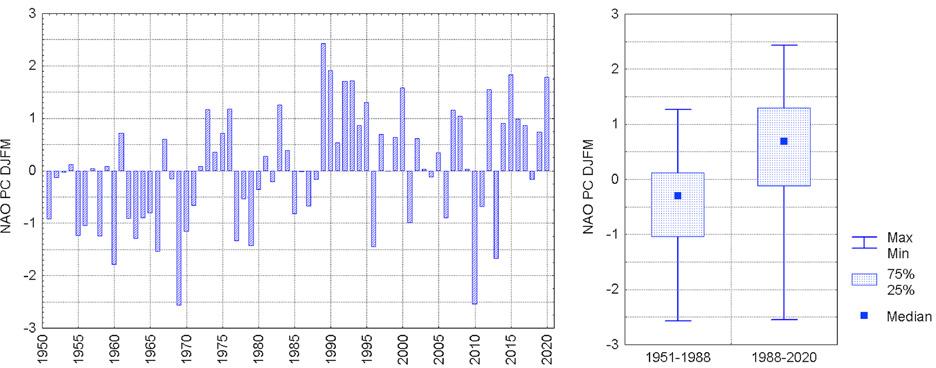
Fig. 7.
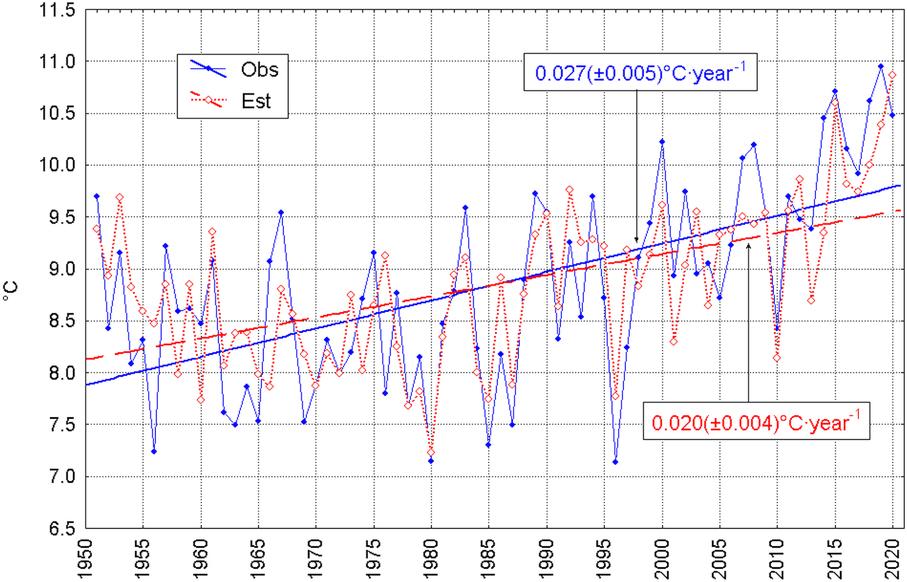
Fig. 8.
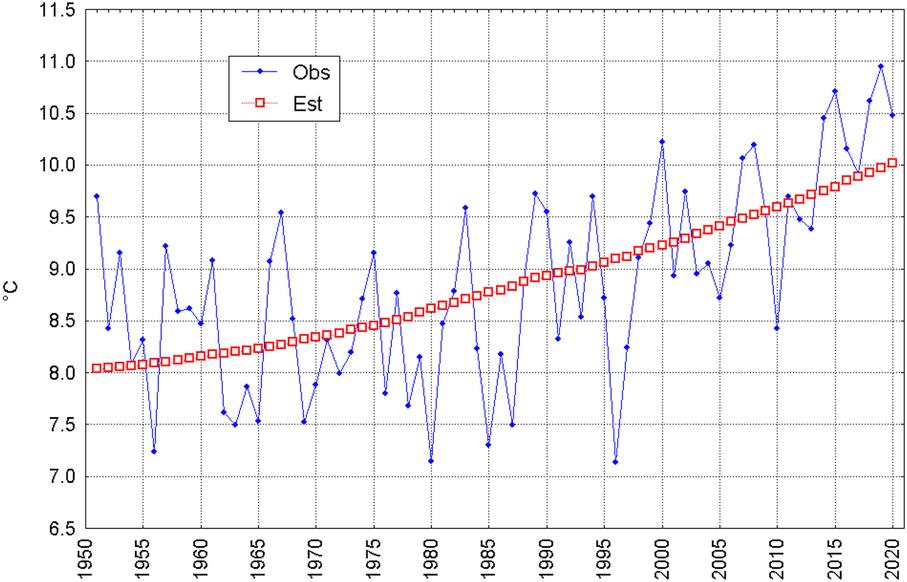
Fig. 9.
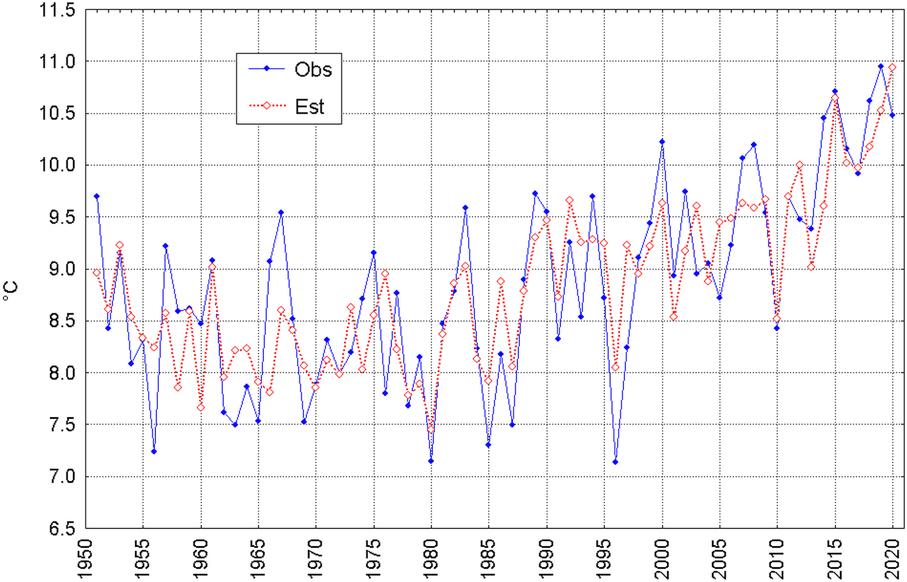
Fig. 10.
Correlation coefficients (r) and their statistical significance (p) between monthly and annual air temperature and the annual sunshine duration (SD) in Kraków, the North Atlantic Oscillation PC DJFM Hurrell index (NAO), and radiative forcing (△F) during the years 1951–2020 (bold values are significant in level p < 0_05)_
| Month | SD | NAO | ΔF | |||
|---|---|---|---|---|---|---|
| R | p | r | p | r | p | |
| I | 0.35 | 0.003 | 0.51 | 0.000 | 0.24 | 0.045 |
| II | 0.22 | 0.074 | 0.40 | 0.001 | 0.28 | 0.020 |
| III | 0.26 | 0.027 | 0.54 | 0.000 | 0.33 | 0.006 |
| IV | 0.51 | 0.000 | 0.24 | 0.043 | 0.43 | 0.000 |
| V | 0.29 | 0.014 | 0.07 | 0.593 | 0.36 | 0.002 |
| VI | 0.63 | 0.000 | 0.13 | 0.292 | 0.45 | 0.000 |
| VII | 0.59 | 0.000 | 0.19 | 0.112 | 0.45 | 0.000 |
| VIII | 0.68 | 0.000 | 0.28 | 0.019 | 0.55 | 0.000 |
| IX | 0.49 | 0.000 | 0.18 | 0.130 | 0.21 | 0.074 |
| X | 0.16 | 0.187 | 0.08 | 0.526 | 0.16 | 0.175 |
| XI | 0.29 | 0.014 | –0.16 | 0.176 | 0.20 | 0.105 |
| XII | 0.25 | 0.036 | 0.18 | 0.145 | 0.17 | 0.154 |
| year | 0.76 | 0.000 | 0.54 | 0.000 | 0.64 | 0.000 |
Correlation coefficients (r) and their statistical significance (p) between the annual frequency of cloud types and annual sunshine duration (SD), average annual air temperature (T), and cloudiness (N) in Kraków in the years 1951–2020 (bold values are significant in level p < 0_05)_
| Element | Cloud genera | Cloudless sky | ||||||||||
|---|---|---|---|---|---|---|---|---|---|---|---|---|
| Ci | Cc | Cs | Ac | As | Ns | Sc | St | Cu | Cb | |||
| SD | r | 0.61 | 0.62 | 0.10 | 0.01 | –0.45 | –0.37 | 0.25 | –0.41 | 0.59 | 0.14 | –0.03 |
| p | 0.000 | 0.000 | 0.395 | 0.942 | 0.000 | 0.002 | 0.040 | 0.000 | 0.000 | 0.264 | 0.800 | |
| T | r | 0.49 | 0.40 | 0.01 | 0.08 | –0.53 | –0.46 | 0.38 | –0.55 | 0.52 | 0.30 | –0.17 |
| p | 0.000 | 0.001 | 0.913 | 0.491 | 0.000 | 0.000 | 0.001 | 0.000 | 0.000 | 0.012 | 0.149 | |
| N | r | –0.02 | 0.16 | 0.48 | 0.01 | 0.58 | 0.60 | –0.09 | 0.64 | –0.04 | –0.48 | –0.52 |
| p | 0.851 | 0.190 | 0.000 | 0.966 | 0.000 | 0.000 | 0.456 | 0.000 | 0.735 | 0.000 | 0.000 | |