
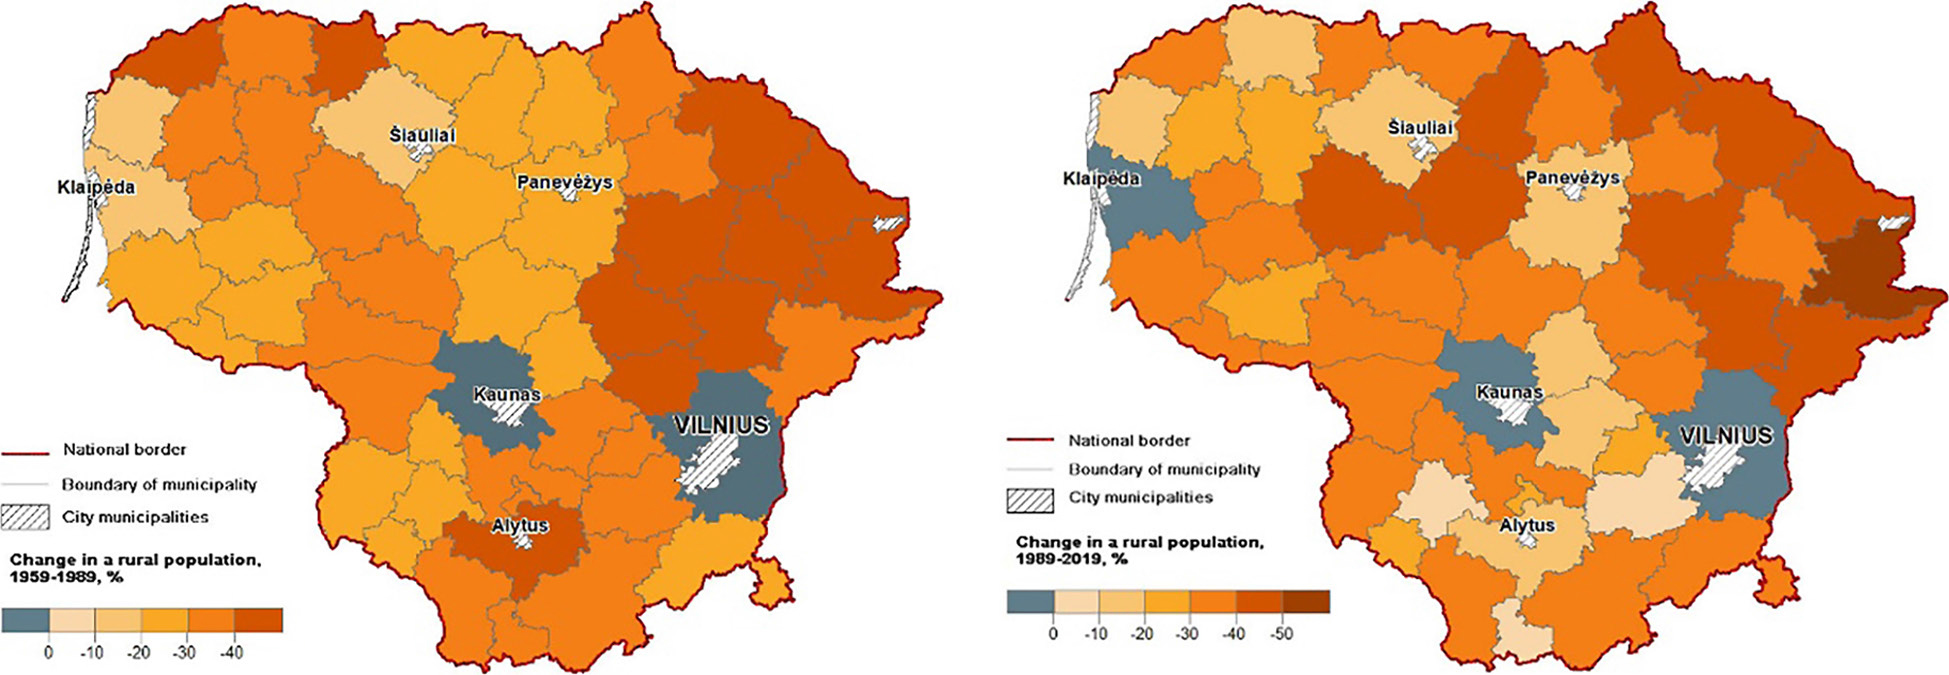
Fig. 1.
Rural population changes in Lithuania during the periods of 1959–1989 and 1989–2019 (data: Lietuvos TSR… (Lithuanian SSR…) 1974, 1989 metų surašymo… (data from the census of 1989 …) 1991, State Data Agency 2024a. Recalculated by the authors according to the current administrative boundaries; authors’ elaboration).
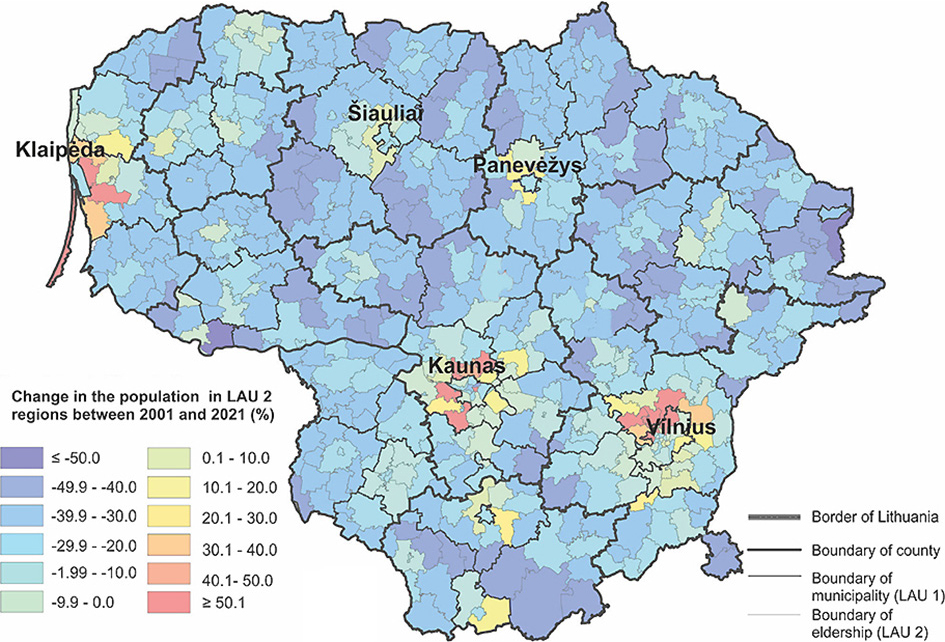
Fig. 2.
Changes in the population in LAU 2 regions between 2001 and 2021 (authors’ calculations based on data from the 2001 and 2021 population and housing census of the State Data Agency, 2024b; the map was elaborated by Baranauskienė).
Table 1.
Demographic trends in different categories of settlements during the Soviet era and after 1990.
| Settlement type | Soviet era | 1990–2021 | ||
|---|---|---|---|---|
| Prevailing trend | Remarks | Prevailing trend | Remarks | |
| General regularities in Lithuania | Total population is growing. | Migration from small rural settlements to larger rural settlements and cities is predominant. Natural population change is positive. | Total population is declining. Population is growing in capital (Vilnius) and suburbs of all cities. It is declining everywhere else. | Large-scale emigration. Labour migration from rural and smaller towns to large cities is prevalent type of internal migration. Natural population change is negative. |
| Suburbs (outside city limits) | Population is growing (despite territorial regulation of population). | Population is growing at expense of rural population settling around cities. | In suburbs of both big and small cities, population is growing. | Population is growing due to people moving out of cities. Most of them are young families. Natural population change is positive. |
| Former central kolkhoz settlements, present administrative rural (LAU-2) centres | Population is growing. | Population is growing at expense of surrounding small villages and granges. Natural population change is positive. | Population is declining rapidly. | Emigration to foreign countries and large cities is predominant. Natural population change is negative. |
| Small rural settlements and granges | Small rural settlements are declining. Granges are being rapidly destroyed. | Main reason for decline is Soviet government’s policy of destroying granges. | Population is declining. The smallest rural settlements and granges disappear. | Emigration to foreign countries and large cities is predominant. Due to age structure of population, mortality rates are several times higher than birth rates. |
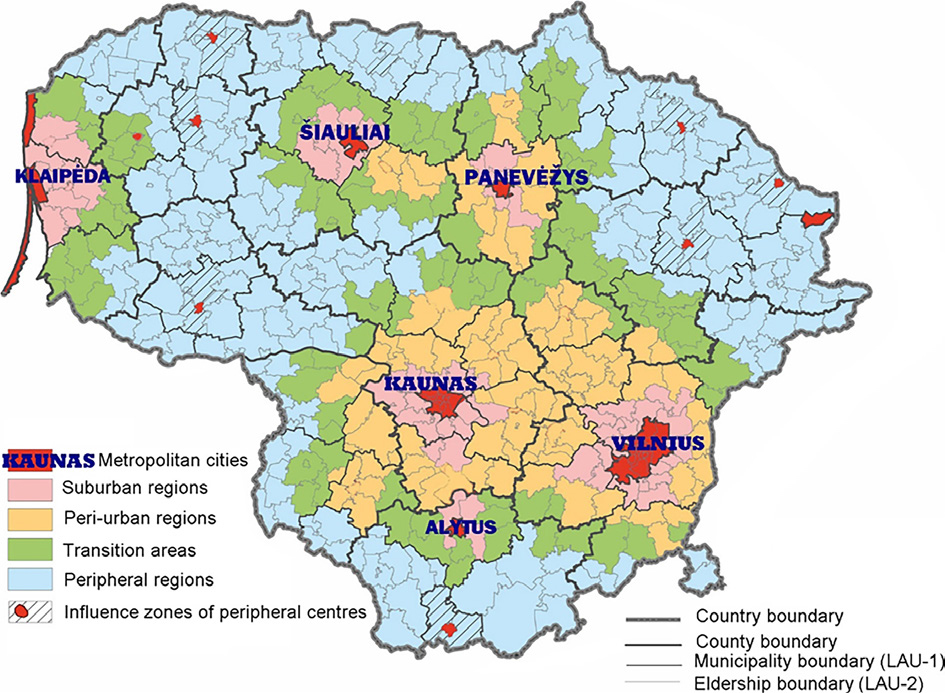
Fig. 3.
The categorisation of Lithuanian territory according to the centre–periphery hierarchy at the level of LAU-2 regions (authors’ elaboration).
Table 2.
Some geographic and demographic characteristics of different types of regions (authors’ calculations based on data from the State Data Agency, 2024b).
| Regions | Population change in 2011–2021 (%) | Population density in 2021 inhabitants/km2 | Occupied part of Lithuania’s area (%) | Population in 2021, thous./part of Lithuania’s population (%) | ||
|---|---|---|---|---|---|---|
| In general | Urban/rural | In general | Rural | |||
| Metropolitan cities | –2.6 | –2.6/– | 1471 | – | 1.3 | 1283/44.4 |
| Suburban regions | 5.86 | –0.9/8.9 | 60.3 | 47.2 | 9.0 | 345/12.3 |
| Peri-urban regions | –12.6 | –10.5/–14.7 | 30.1 | 15.1 | 18.4 | 362/12.9 |
| Transition areas | –16.1 | –11.5/–18.3 | 17.6 | 12.6 | 22.8 | 270/9.6 |
| Peripheral regions | –16.2 | –12.2/–19.6 | 18.5 | 10.9 | 48.5 | 585/20.8 |
| In Lithuania | –7.6 | –5.6/–11.7 | 43.1 | 14.1 | 100 | 2811/100 |