Fig. 1.
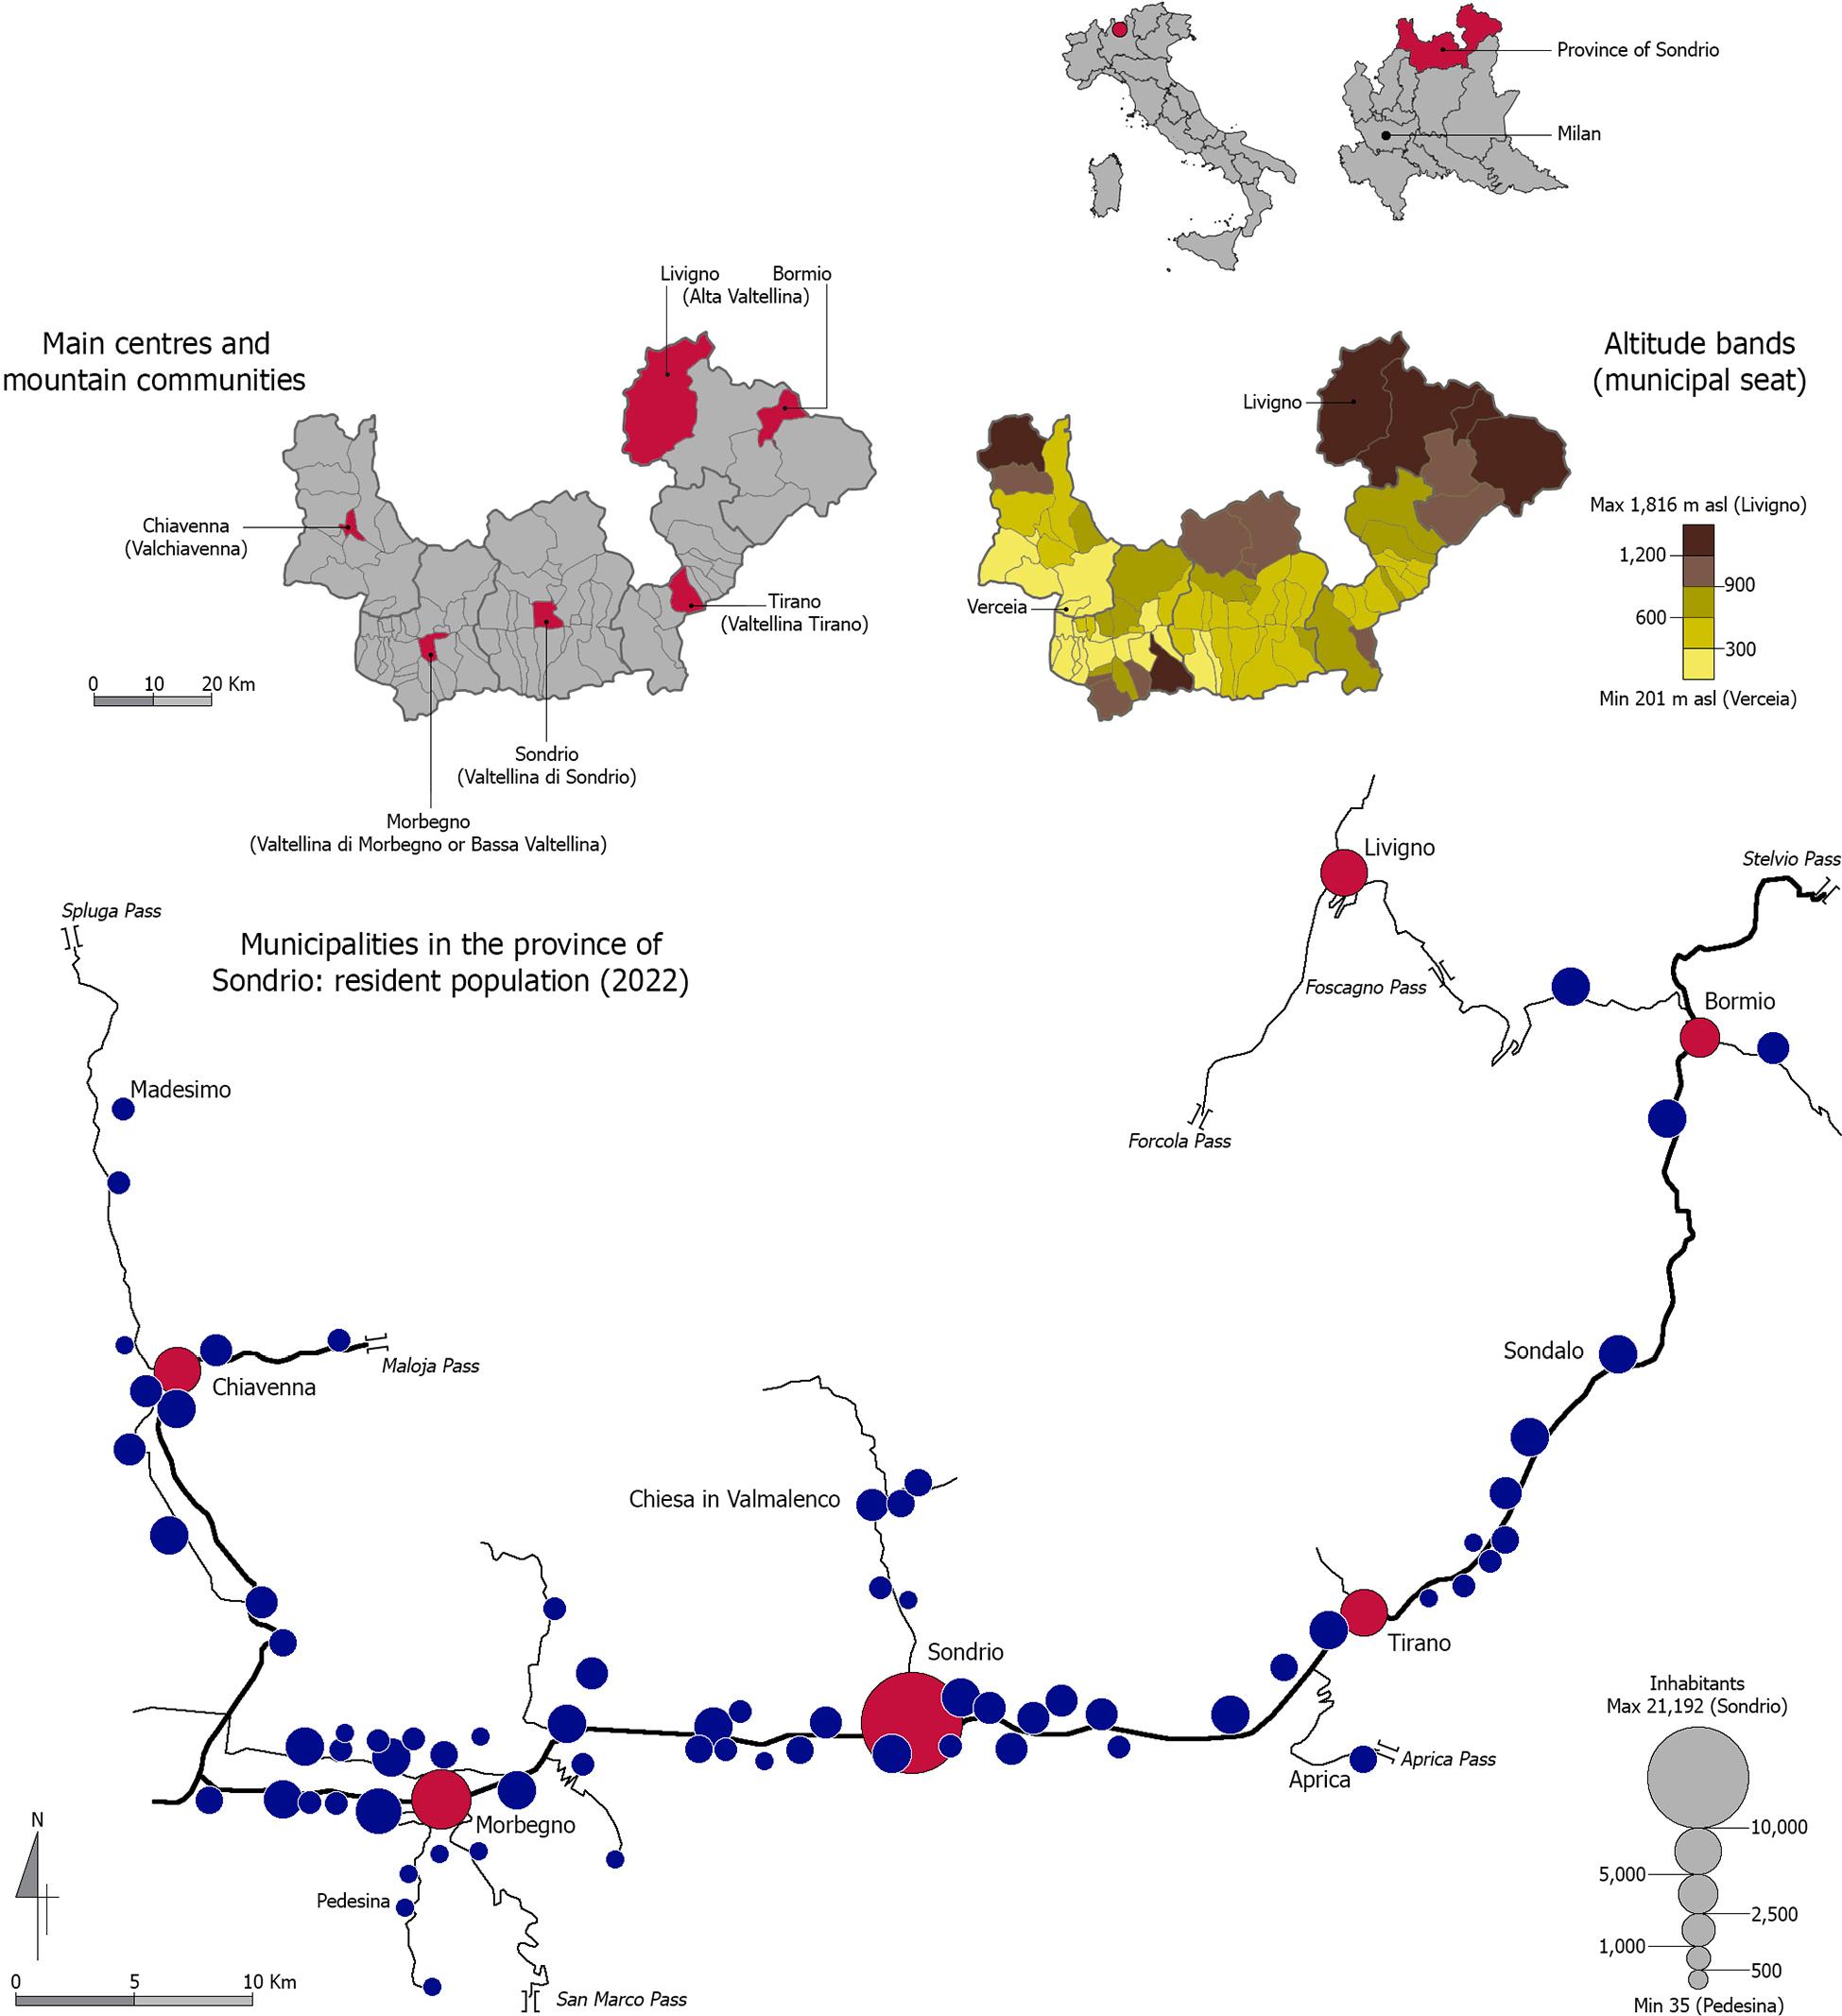
Fig. 2.
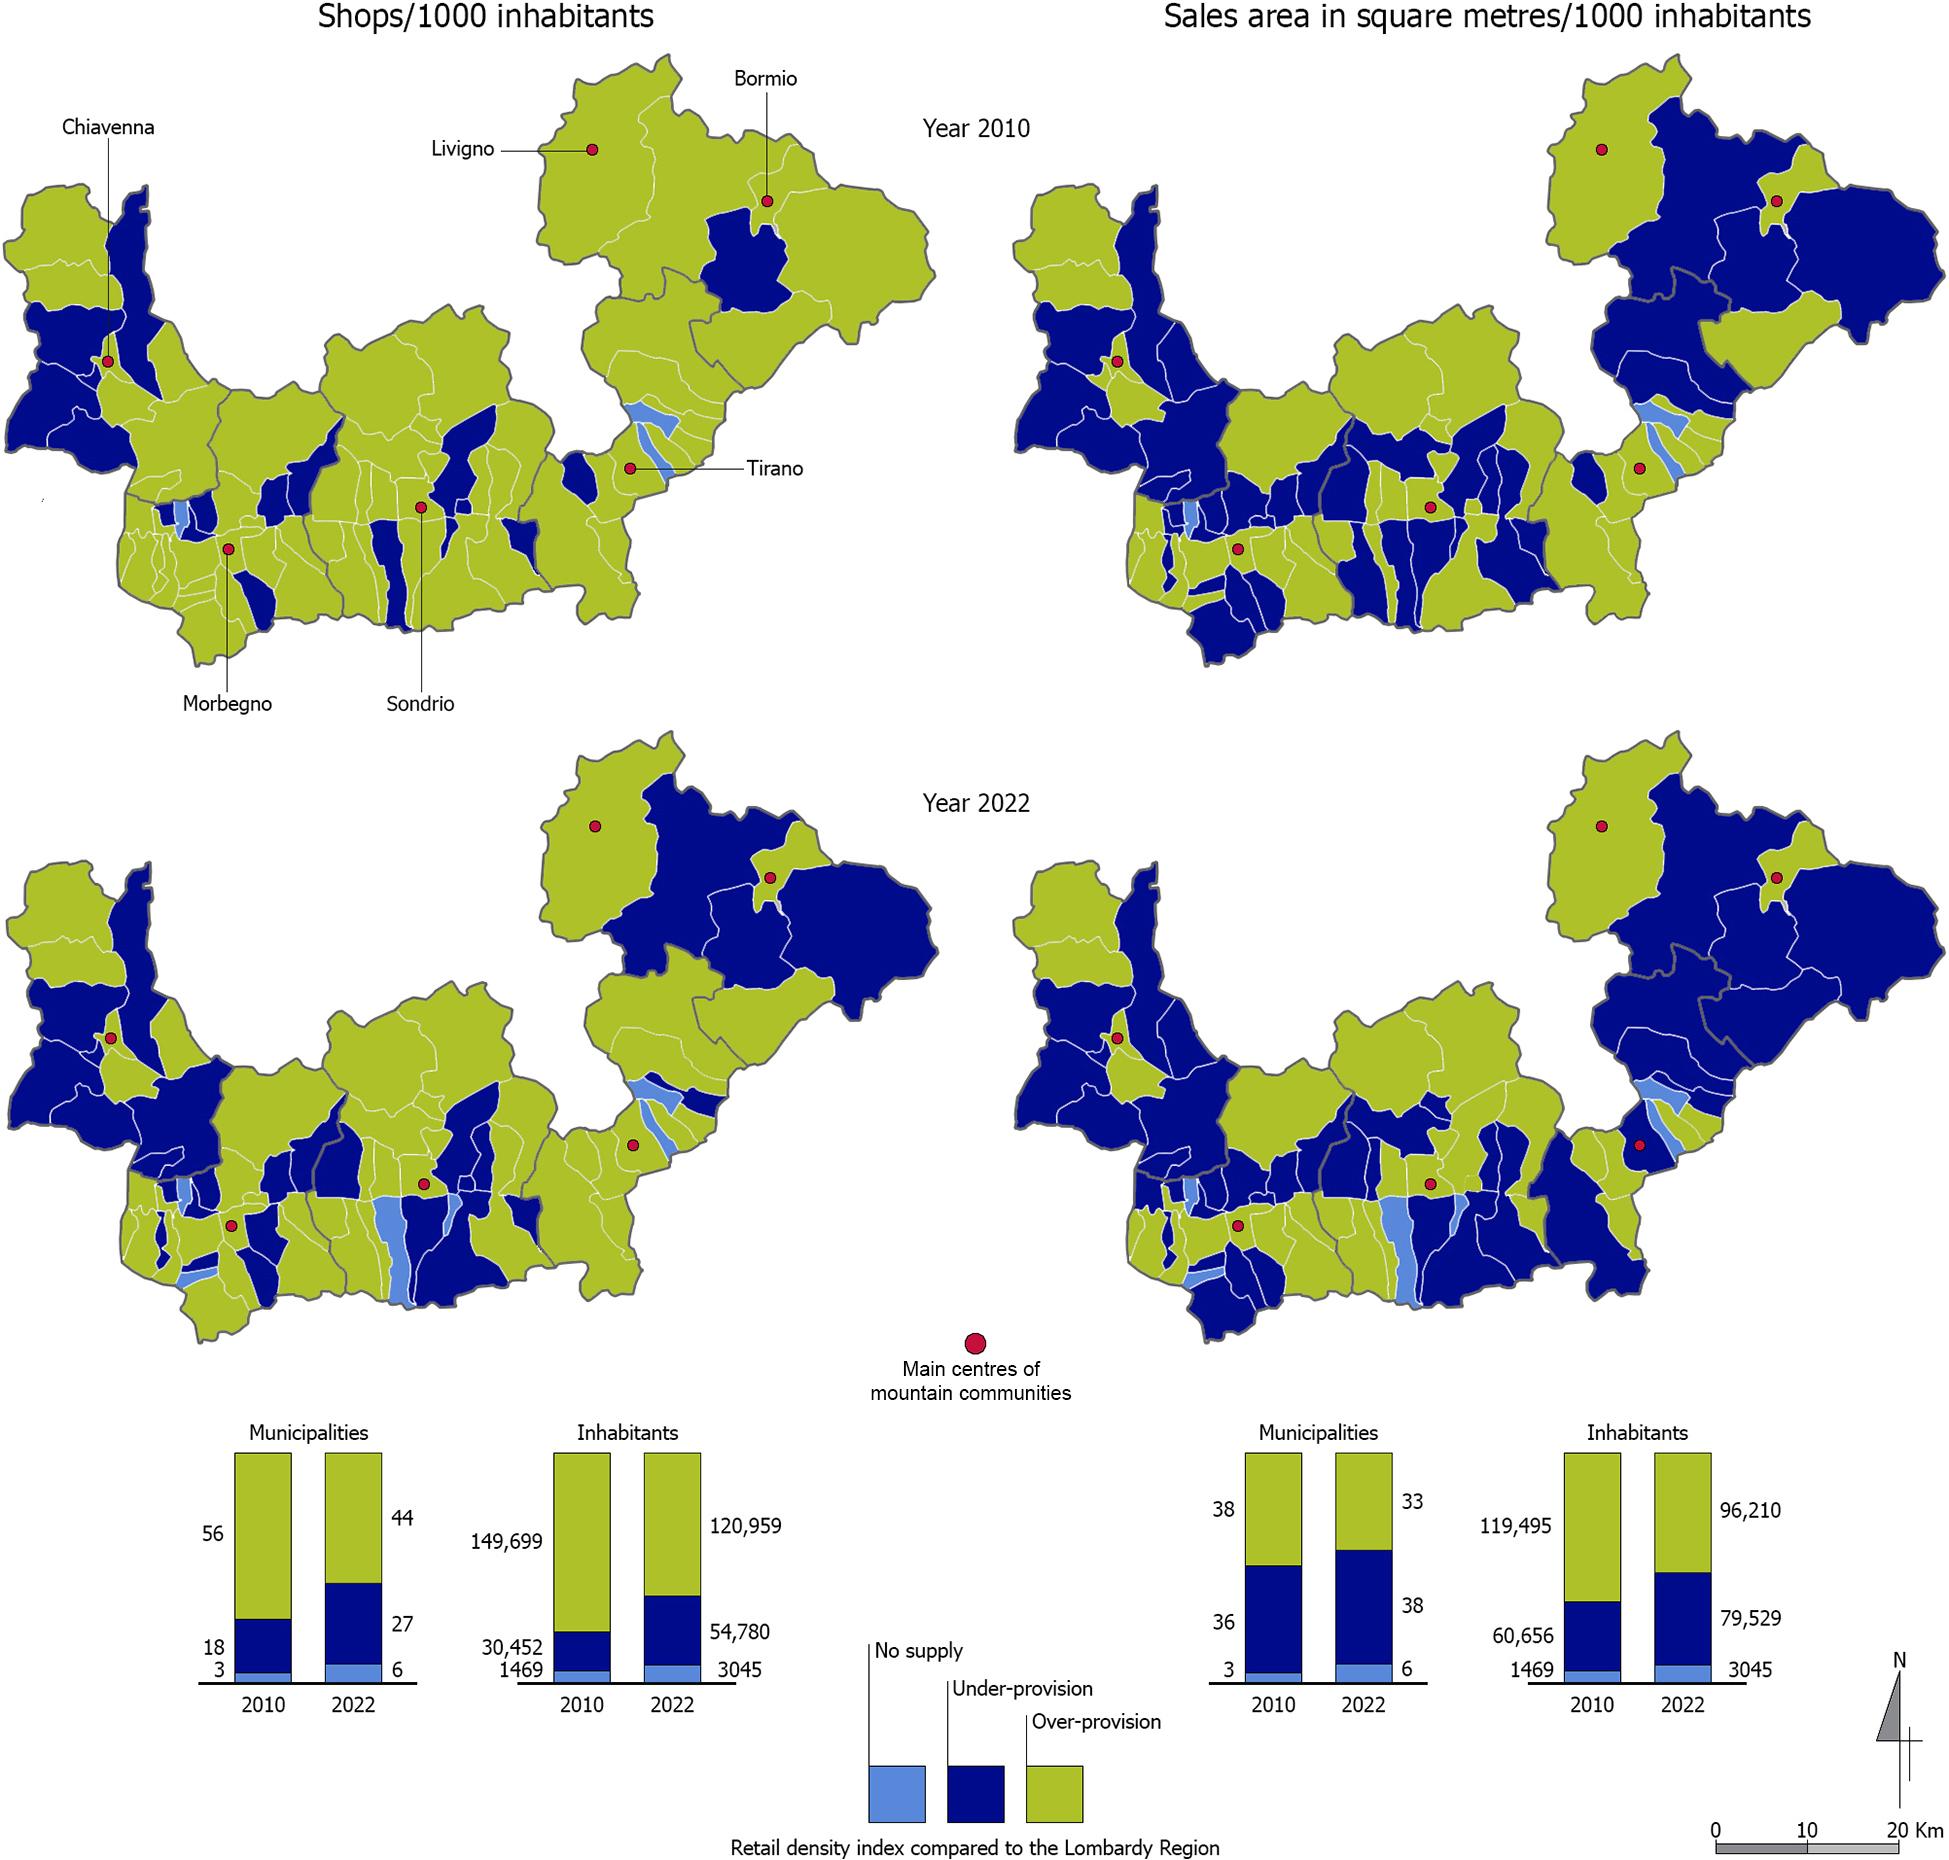
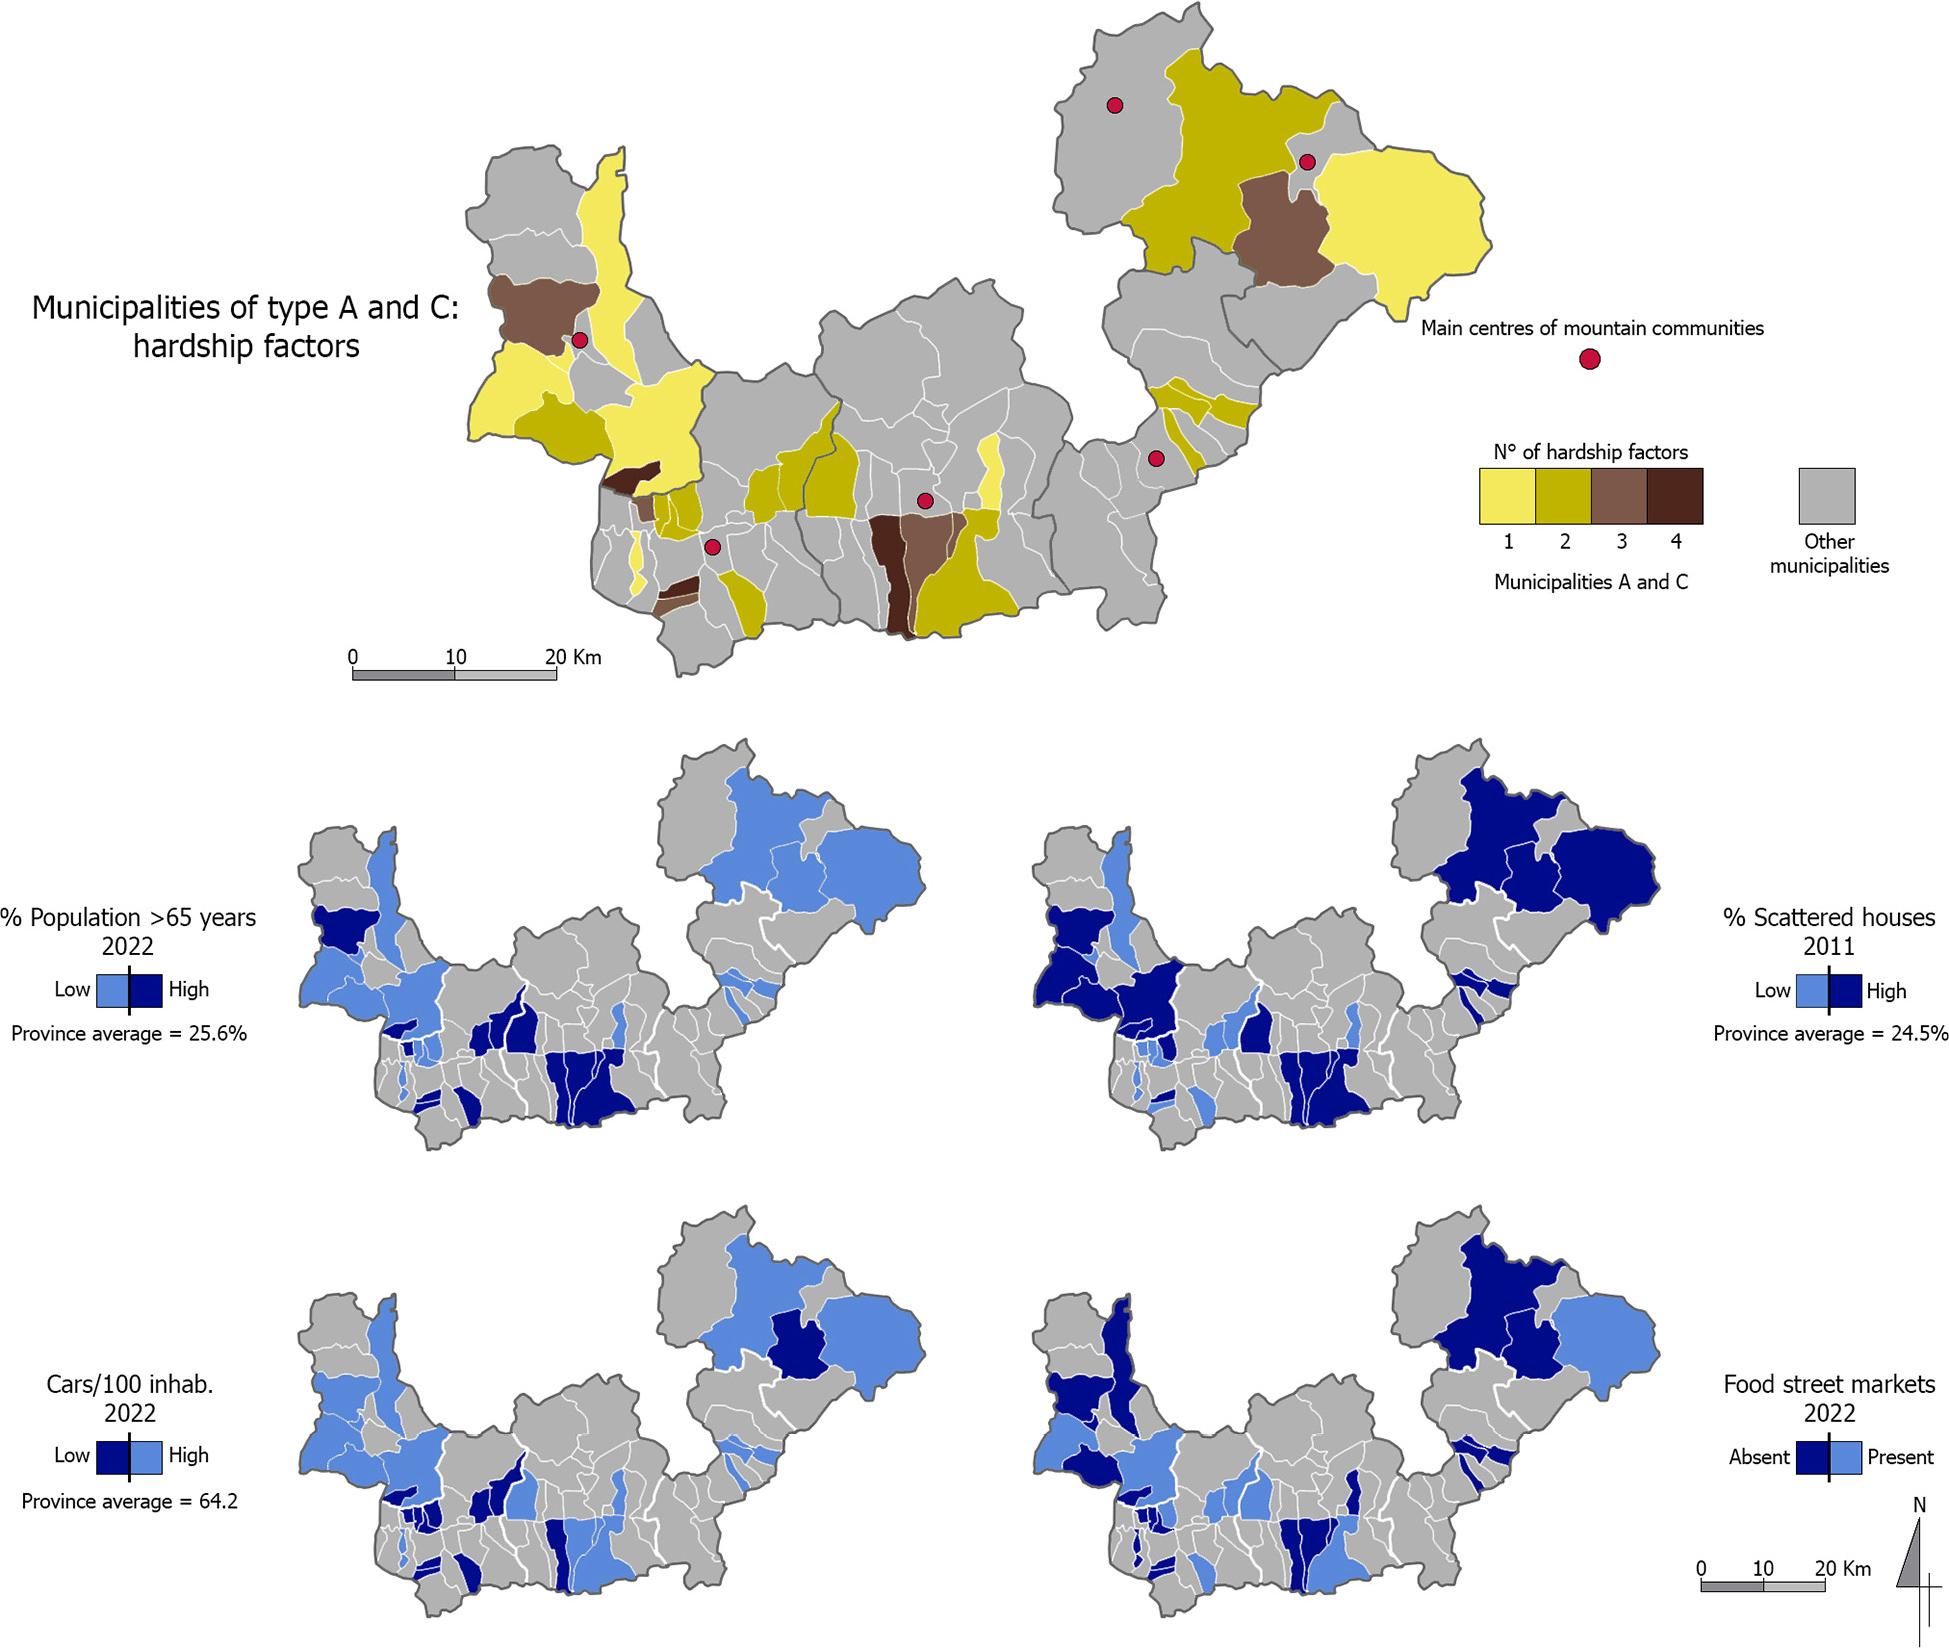
Fig. 3.
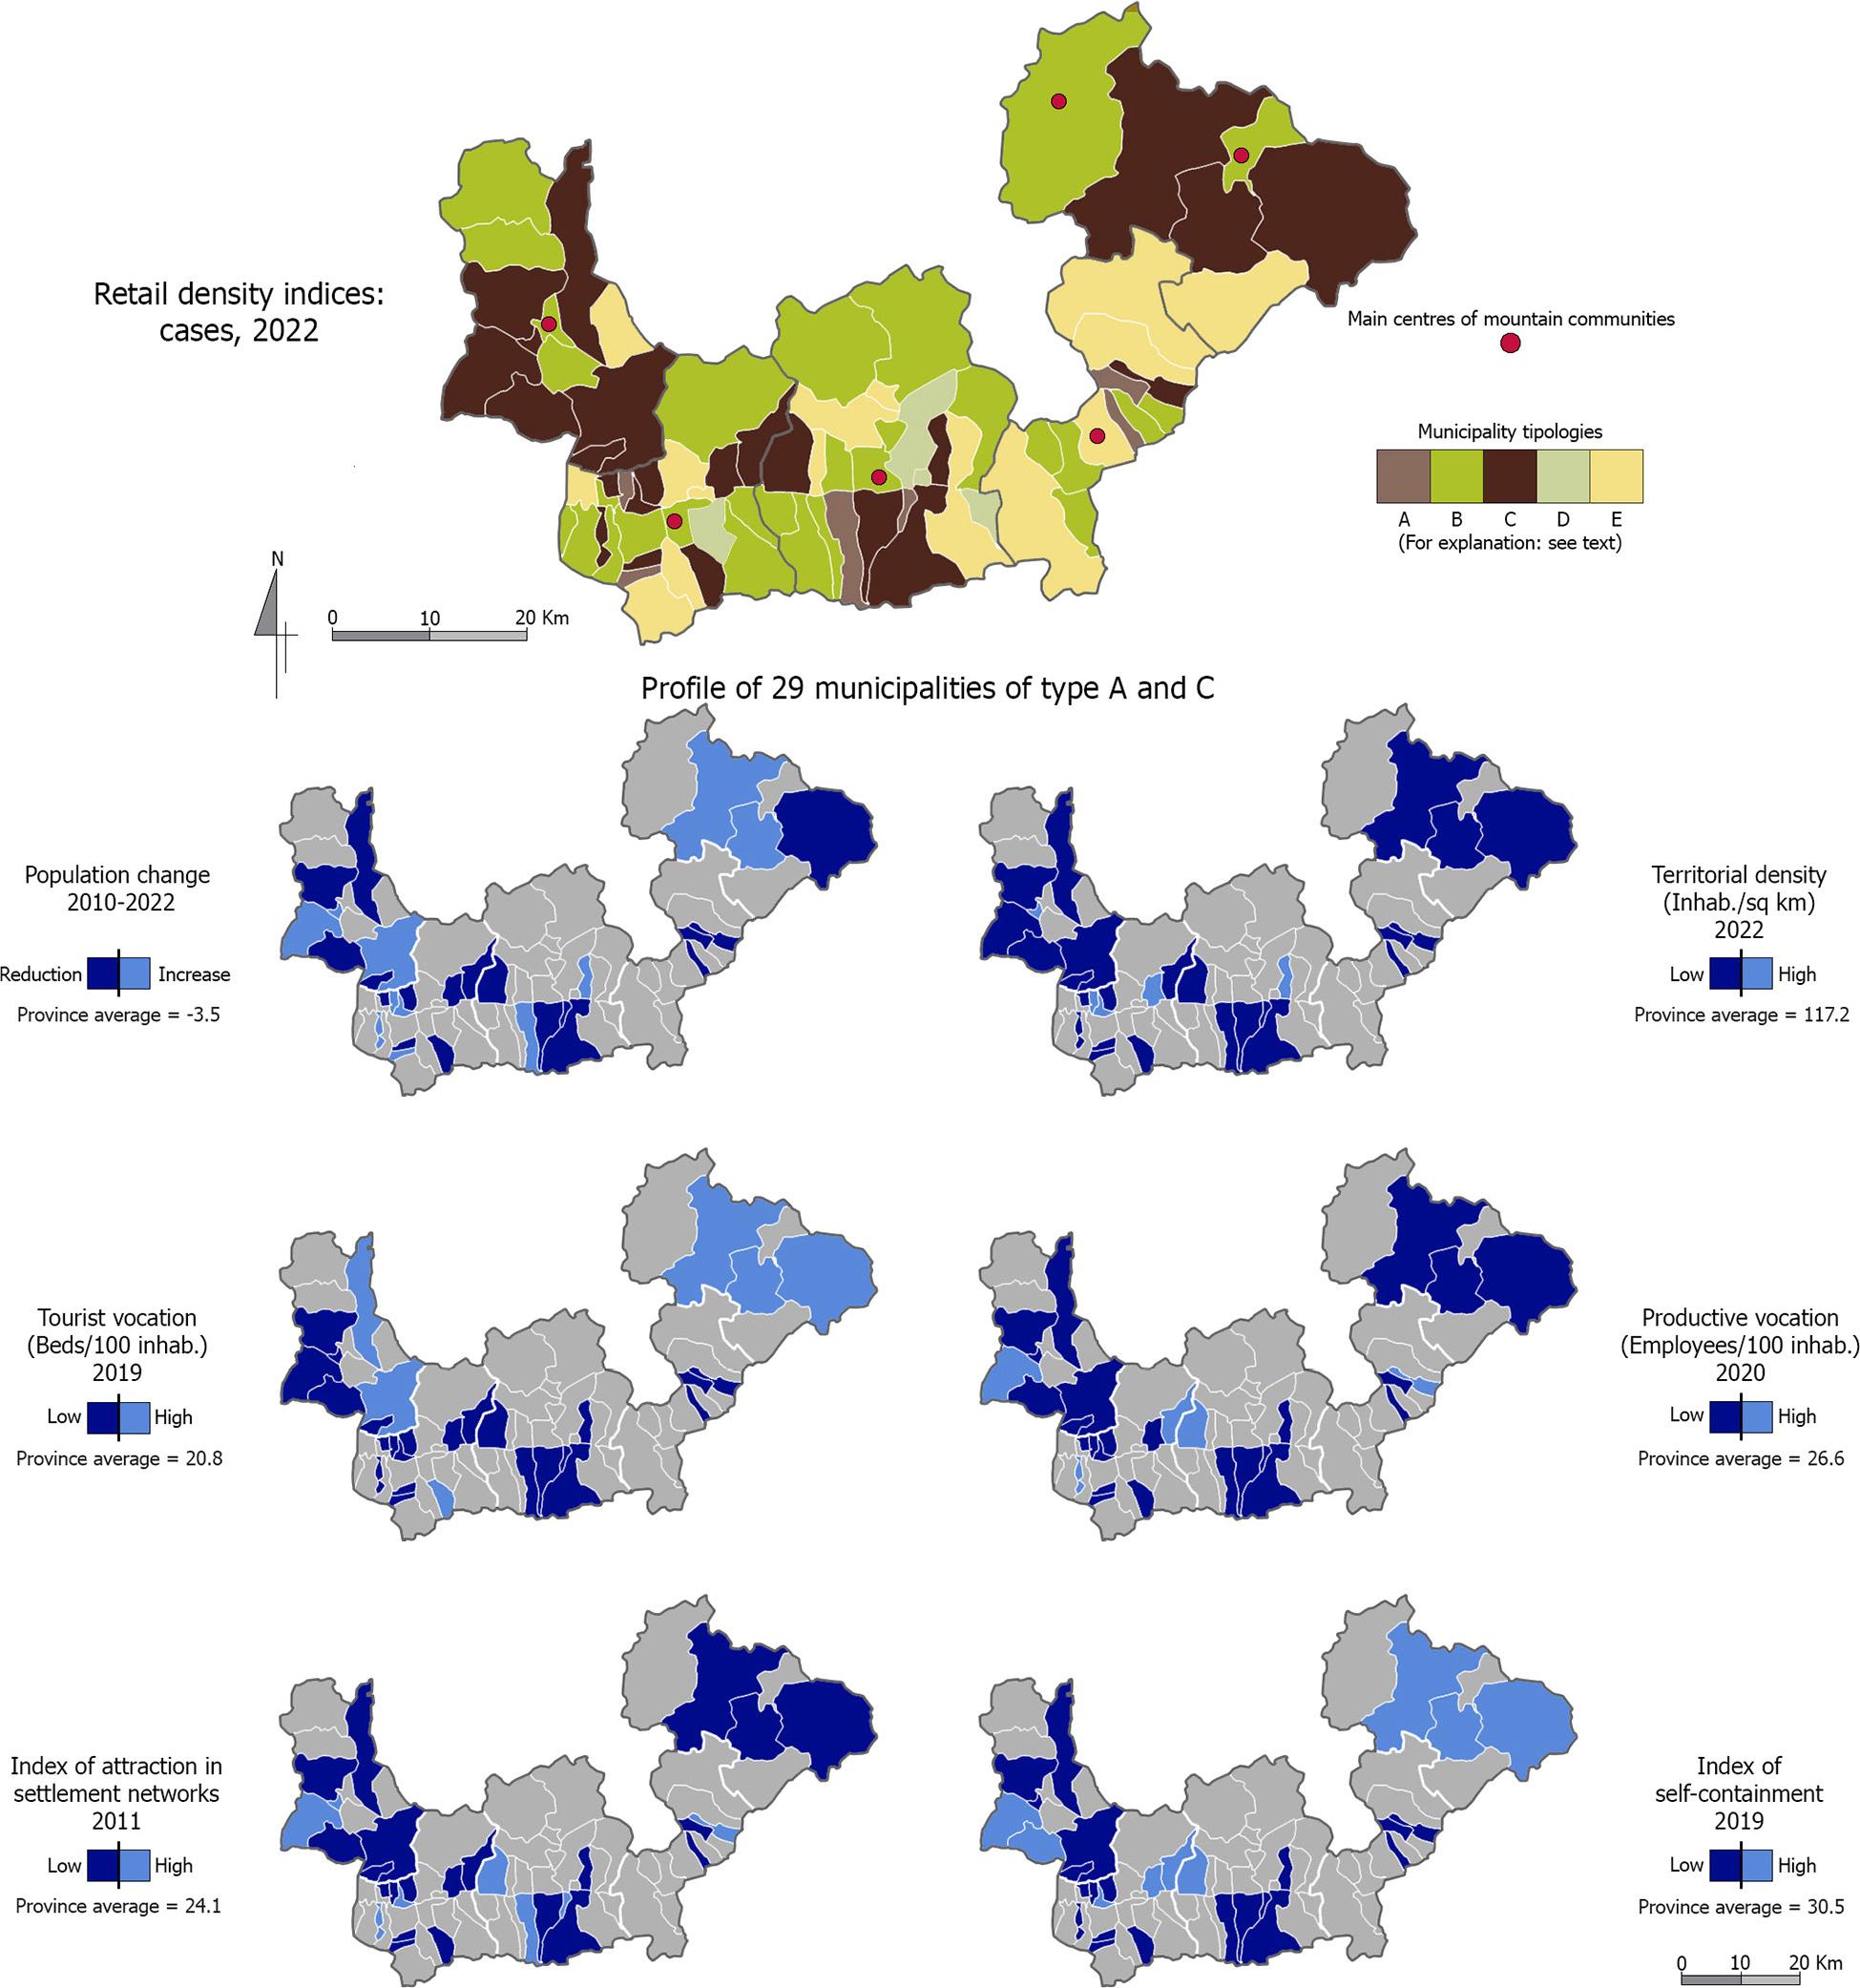
Fig. 4.
Cases of under-provision and absence of food retail in the province of Sondrio, 2022, based on Lombardy Regional Trade Observatory data and ISTAT data (population and households database)_
| Total no. of municipalities | Compared to: shops | Compared to: sales area | |||||
|---|---|---|---|---|---|---|---|
| No. of municipalities | Resident population | Resident population (%) | No. of municipalities | Resident population | Resident population (%) | ||
| Mountain communities | |||||||
| Valchiavenna | 12 | 7 | 11,862 | 48.5 | 8 | 12,829 | 52.5 |
| Valtellina di Morbegno | 25 | 11 | 15,911 | 33.8 | 15 | 16,918 | 35.9 |
| Valtellina di Sondrio | 22 | 9 | 18,121 | 33.4 | 10 | 17,725 | 32.6 |
| Valtellina di Tirano | 12 | 3 | 1705 | 6.1 | 7 | 20,946 | 74.9 |
| Alta Valtellina | 6 | 3 | 10,226 | 41.0 | 4 | 14,156 | 56.7 |
| Altitude bands | |||||||
| Up to 300 m a.s.l. | 19 | 9 | 20,876 | 41.6 | 9 | 20,005 | 39.9 |
| 301–600 m a.s.l. | 29 | 15 | 24,088 | 30.7 | 17 | 31,525 | 40.2 |
| 601–900 m a.s.l. | 13 | 4 | 2309 | 13.9 | 10 | 15,059 | 90.7 |
| 901–1200 m a.s.l. | 10 | 3 | 3920 | 25.5 | 6 | 9353 | 60.8 |
| Oltre 1200 m a.s.l. | 6 | 2 | 6632 | 36.5 | 2 | 6632 | 36.5 |
| Total | 77 | 33 | 57,825 | 32.3 | 44 | 82,574 | 46.2 |
Profile of the 29 municipalities of types A and C, average values based on ISTAT data, various databases (population and households, tourism, general population census, statistical archive of active enterprises)_
| Variables | Municipalities profile A (6) | Municipalities profile C (23) | Total municipalities province of Sondrio (77) |
|---|---|---|---|
| Change in resident population, 2010–2022 (%) | −1.8 | −2.6 | −3.5 |
| Inhabitants / sq km, 2022 | 57.6 | 94.8 | 117.2 |
| Beds in hotel and non-hotel facilities / 100 inhabitants, 2019 | 6.2 | 13.6 | 20.8 |
| Employees / 100 inhabitants, 2020 | 9.6 | 22.5 | 26.6 |
| Index of attraction in settlement networks, 2011 | 18.7 | 19.6 | 24.1 |
| Index of self-containment, 2019 | 12.1 | 24.2 | 30.5 |
Structure of retail in the province of Sondrio, 2010 and 2022, based on Lombardy Regional Trade Observatory data and ISTAT data (population and households database)_
| Variables / Years | Neighbourhood shops | Medium-sized sales facilities | Large sales facilities | Total | Neighbourhood shops in total (%) |
|---|---|---|---|---|---|
| No. of shops | |||||
| 2010 | 3123 | 292 | 8 | 3423 | 91.2 |
| 2022 | 2850 | 303 | 9 | 3162 | 90.1 |
| Balance | −273 | 11 | 1 | −261 | −1.1 |
| Food sqm | |||||
| 2010 | 49,622 | 27,987 | 13,022 | 90,631 | 54.8 |
| 2022 | 46,717 | 31,207 | 13,091 | 91,015 | 51.3 |
| Balance | −2905 | 3220 | 69 | 384 | −3.5 |
| Non-food sqm | |||||
| 2010 | 137,980 | 93,277 | 32,382 | 263,639 | 52.3 |
| 2022 | 127,429 | 106,494 | 41,373 | 275,296 | 46.3 |
| Balance | −10,551 | 13,217 | 8991 | 11,657 | −6.0 |
| Total sqm | |||||
| 2010 | 187,602 | 121,264 | 45,404 | 354,270 | 53.0 |
| 2022 | 174,146 | 137,701 | 54,464 | 366,311 | 47.5 |
| Balance | −13,456 | 16,437 | 9060 | 12,041 | −5.5 |
Resident population dynamics in the province of Sondrio, 2010-2022, based on ISTAT data (population and househoulds database)_
| No. of municipalities | Resident population | No. of growing municipalities 2010–2022 | ||||
|---|---|---|---|---|---|---|
| No. 2022 | Total (%) | Balance 2010–2022 | Δ% 2010–2022 | |||
| Mountain communities | ||||||
| Valchiavenna | 12 | 24,440 | 13.7 | −169 | −0.7 | 4 |
| Valtellina di Morbegno | 25 | 47,112 | 26.4 | 840 | 1.8 | 12 |
| Valtellina di Sondrio | 22 | 54,323 | 30.4 | −2780 | −4.9 | 3 |
| Valtellina di Tirano | 12 | 27,952 | 15.6 | −1226 | −4.2 | 2 |
| Alta Valtellina | 6 | 24,957 | 13.9 | 499 | 2.0 | 3 |
| Altitude bands | ||||||
| Up to 300 m a.s.l. | 19 | 50,137 | 28.0 | 1248 | 2.6 | 11 |
| 301–600 m a.s.l. | 29 | 78,512 | 43.9 | −2408 | −3.0 | 7 |
| 601–900 m a.s.l. | 13 | 16,594 | 9.3 | −1156 | −6.5 | 2 |
| 901–1200 m a.s.l. | 10 | 15,382 | 8.6 | −1244 | −7.5 | 2 |
| Over 1200 m a.s.l. | 6 | 18,159 | 10.2 | 724 | 4.2 | 2 |
| Total | 77 | 178,784 | 100.0 | −2836 | −1.6 | 24 |
Local units and employees in the province of Sondrio by altitude bands, 2011 and 2020, based on ISTAT data (statistical archive of active enterprises)_
| Altitude bands | Total economic activities (%) | Retail trade sector (%) | ||
|---|---|---|---|---|
| 2011 | 2020 | 2011 | 2020 | |
| Local units | ||||
| Up to 300 m a.s.l. | 25.8 | 25.9 | 23.9 | 25.0 |
| 301–600 m a.s.l. | 44.3 | 43.2 | 42.8 | 41.0 |
| 601–900 m a.s.l. | 6.8 | 6.5 | 6.7 | 6.3 |
| 901–1200 m a.s.l. | 8.7 | 8.2 | 7.5 | 7.7 |
| Over 1200 m a.s.l. | 14.3 | 16.2 | 19.1 | 20.0 |
| Employees | ||||
| Up to 300 m a.s.l. | 28.8 | 30.4 | 26.0 | 29.7 |
| 301–600 m a.s.l. | 40.6 | 42.2 | 39.7 | 39.6 |
| 601–900 m a.s.l. | 5.9 | 5.7 | 5.0 | 4.4 |
| 901–1200 m a.s.l. | 8.0 | 7.0 | 6.7 | 6.2 |
| Over 1200 m a.s.l. | 16.7 | 14.7 | 22.6 | 20.4 |
| Total | 100.0 | 100.0 | 100.0 | 100.0 |