
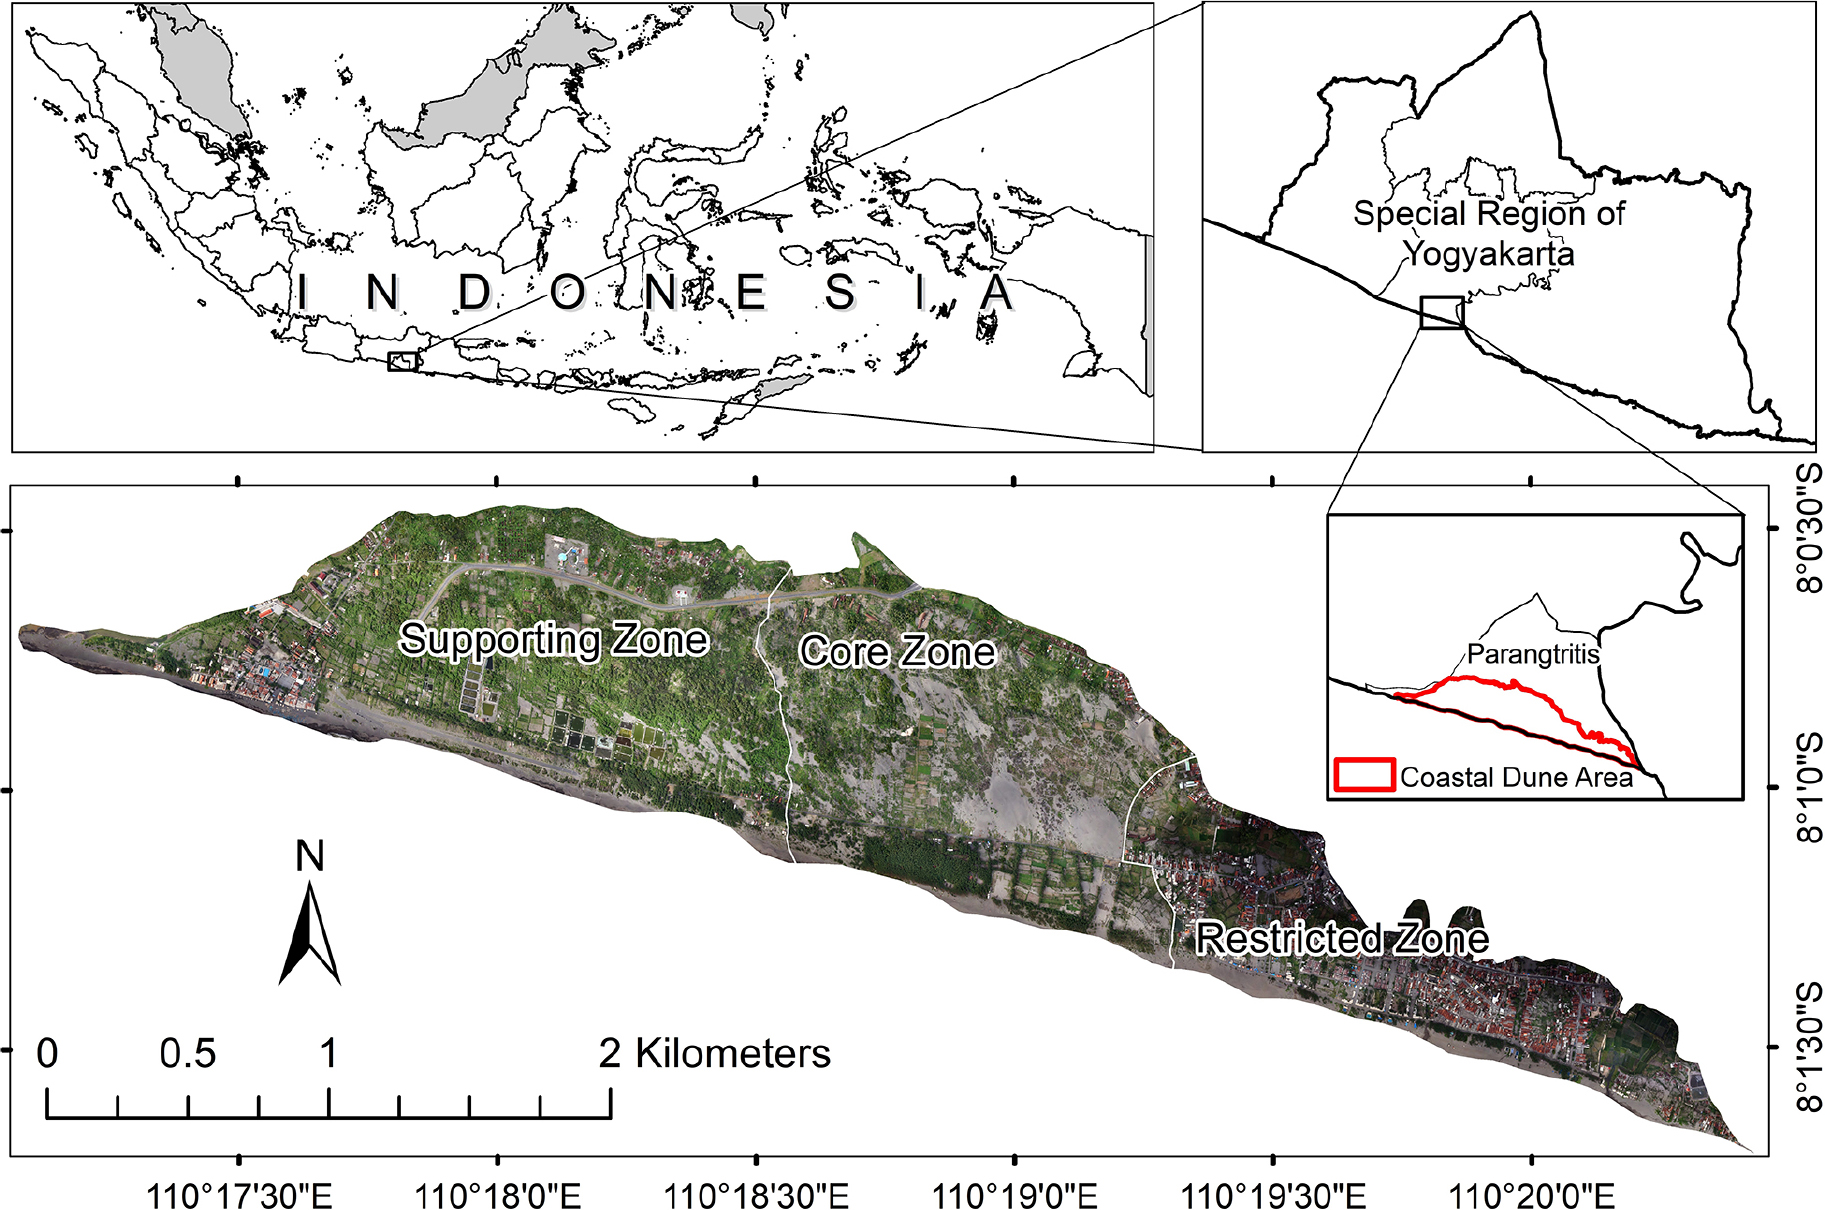
Fig 1.
Location of Parangtritis coastal dune (source: National Geospatial Agency 2020, processed).
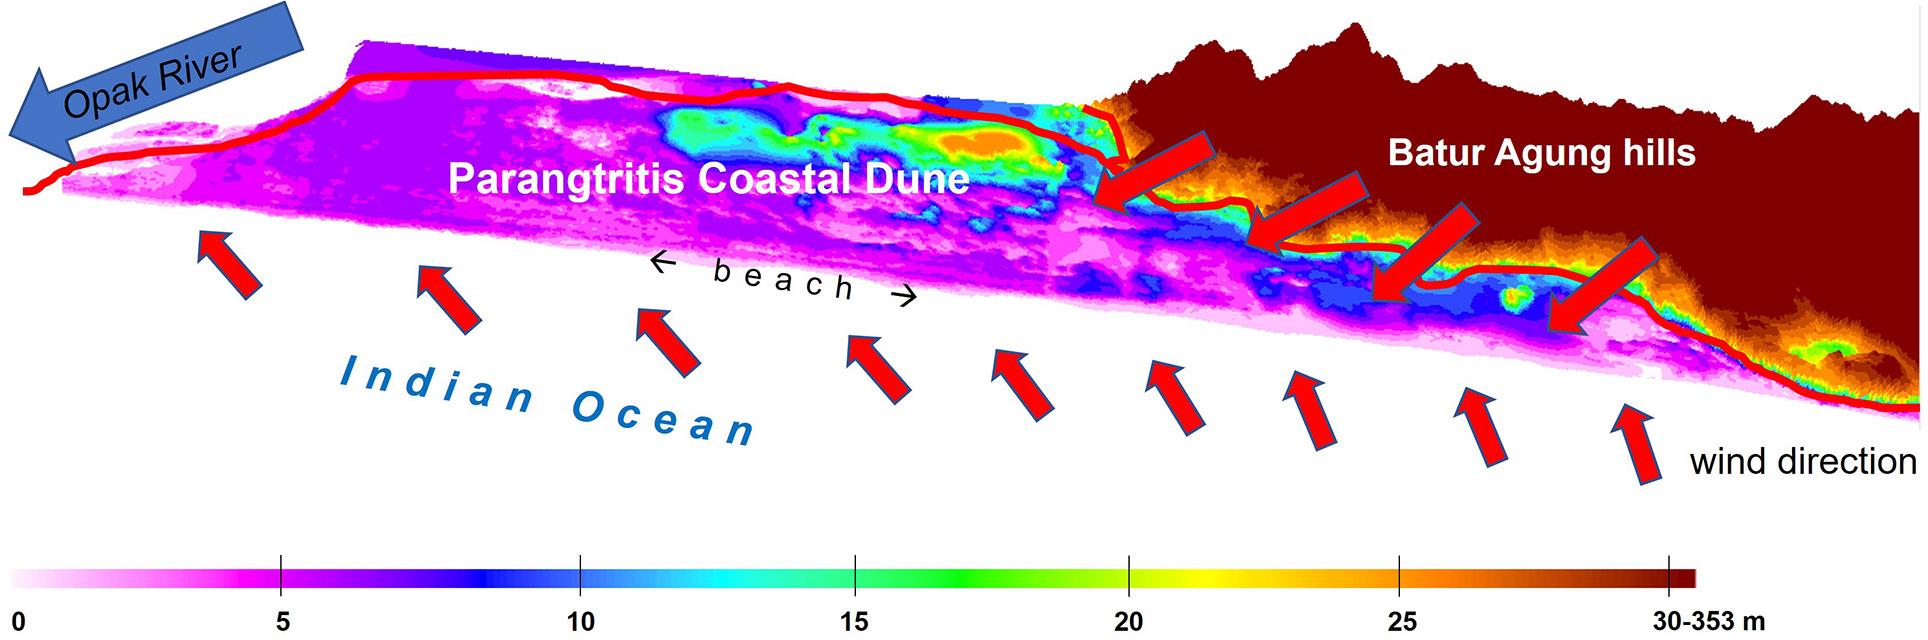
Fig 2.
Illustration of the Parangtritis coastal dune formation.
Table 1.
Formulas to calculate the landscape disturbance.
| Index | Equation | Assessment Unit |
|---|---|---|
| Landscape disturbance (Xie et al. 2013; X. Zhang et al. 2013; Liu et al. 2020) | Si = aCi + bNi + cDi a + b + c = 1 a = 0,5; b = 0,3; c = 0,2 | landscape class or sub-class |
| Landscape fragmentation (X. Zhang et al. 2013; Liu et al. 2020) | landscape class or sub-class | |
| Landscape isolation, segmentation, or splitting (Xie et al. 2013; X. Zhang et al. 2013; Liu et al. 2020) | landscape class or sub-class | |
| Landscape dominance (Jin et al. 2019) | landscape class or sub-class |
1 Note: ni = the number of patches of landscape i; Ai = the total area of landscape i; A = the total area of all landscape types; Qi = the number of sampling units (including grid) of patch i divided by the total number of sampling units for all landscape types; Mi = the number of patches of landscape i divided by the total number of patches of all landscape types; Li = the area of landscape i divided by the total area of all landscape types.
Table 2.
Landscape fragility index (Fi) of various landscape classes based on their genesis (natural processes or human interventions).
| Landscape class | Natural | Agrogenic | Tree agrogenic | Industrogenic | Info-telecommunication | Tourismsports | Traffic | Urbanogenic | Water management |
|---|---|---|---|---|---|---|---|---|---|
| Index | 1.000 | 0.686 | 0.145 | 0.472 | 0.068 | 0.319 | 0.098 | 0.048 | 0.215 |
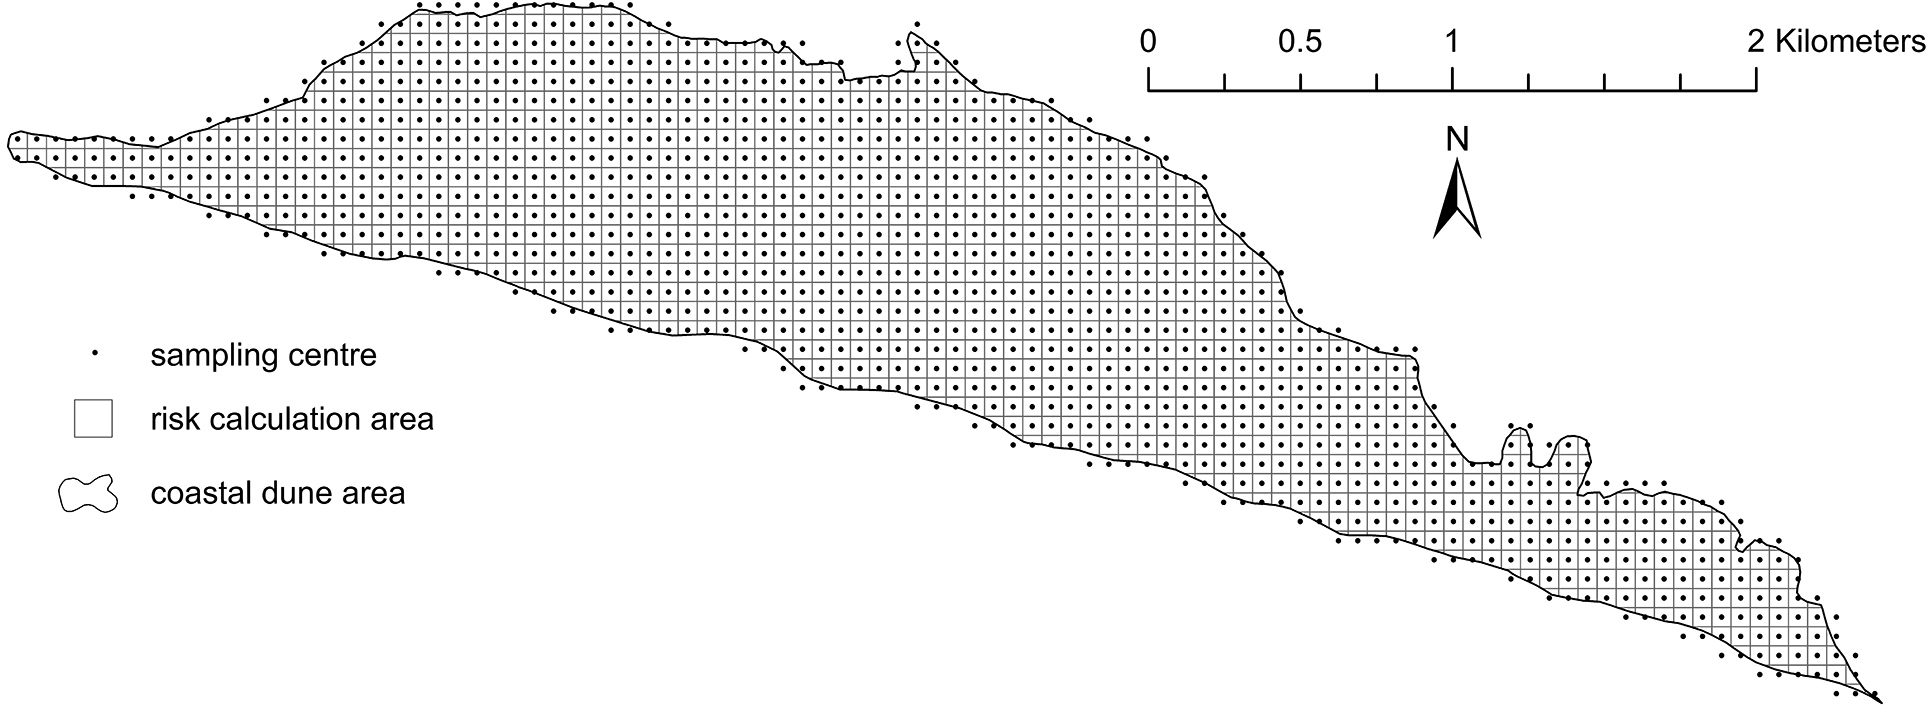
Fig 3.
Division of the Parangtritis coastal dune (risk calculation area) into grids of equal size and the centroid or sampling centre.
Table 3.
Landscape ecological risk index calculation.
| Index | Equation | Assessment Unit |
|---|---|---|
| Ecological risk | grid (if one grid contains > 1 classes or sub-classes, their indices are summed, adjusting the area proportion) | |
| Landscape loss degree | Ri = Fi × Si | landscape class or sub-class |
Table 4.
Calculation of global and local spatial autocorrelation.
| Global spatial autocorrelation | Local spatial autocorrelation | |
|---|---|---|
| ||
1 Note: I = Moran’s I; xi = the observed value of certain attribute in spatial unit i; xj = the observed value of certain attribute in spatial unit j; x = the mean value of regional variables; S2 = mean squared deviation; wij = spatial weight value (expressed by n dimensional matrix, W [n × n]); Var(I) = the variance of Moran’s I; E(I) = the expected value of Moran’s I; zi = standardisation of the observation value in research unit i; zj = standardisation of the observation value in research unit j; zscore = the significance level of Moran’s I.
Interpretation of clusters derived from using LISA: high-high = the increasing value in a region will be followed by increasing values in adjacent regions; high-low = the increasing value in a region will be followed by decreasing values in adjacent regions; low-high = the decreasing value in a region will be followed by increasing values in adjacent regions; low-low = the decreasing value in a region will be followed by decreasing values in adjacent regions.
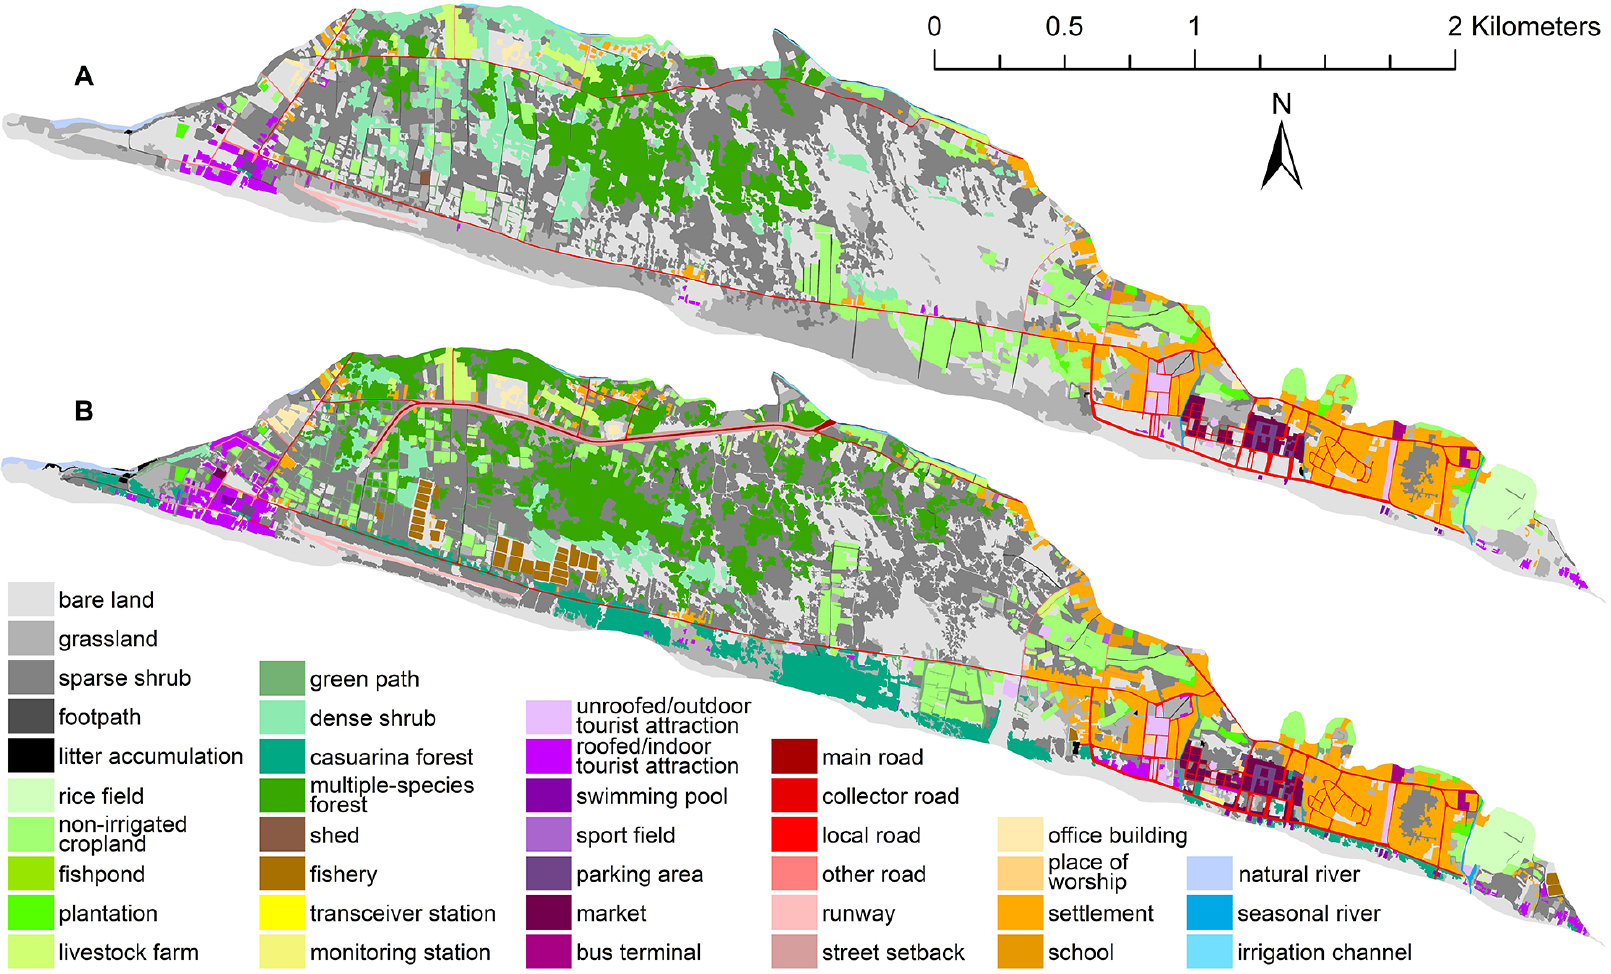
Fig 4.
Spatial distribution of land use and land cover types in 2011 (A) and 2020 (B).
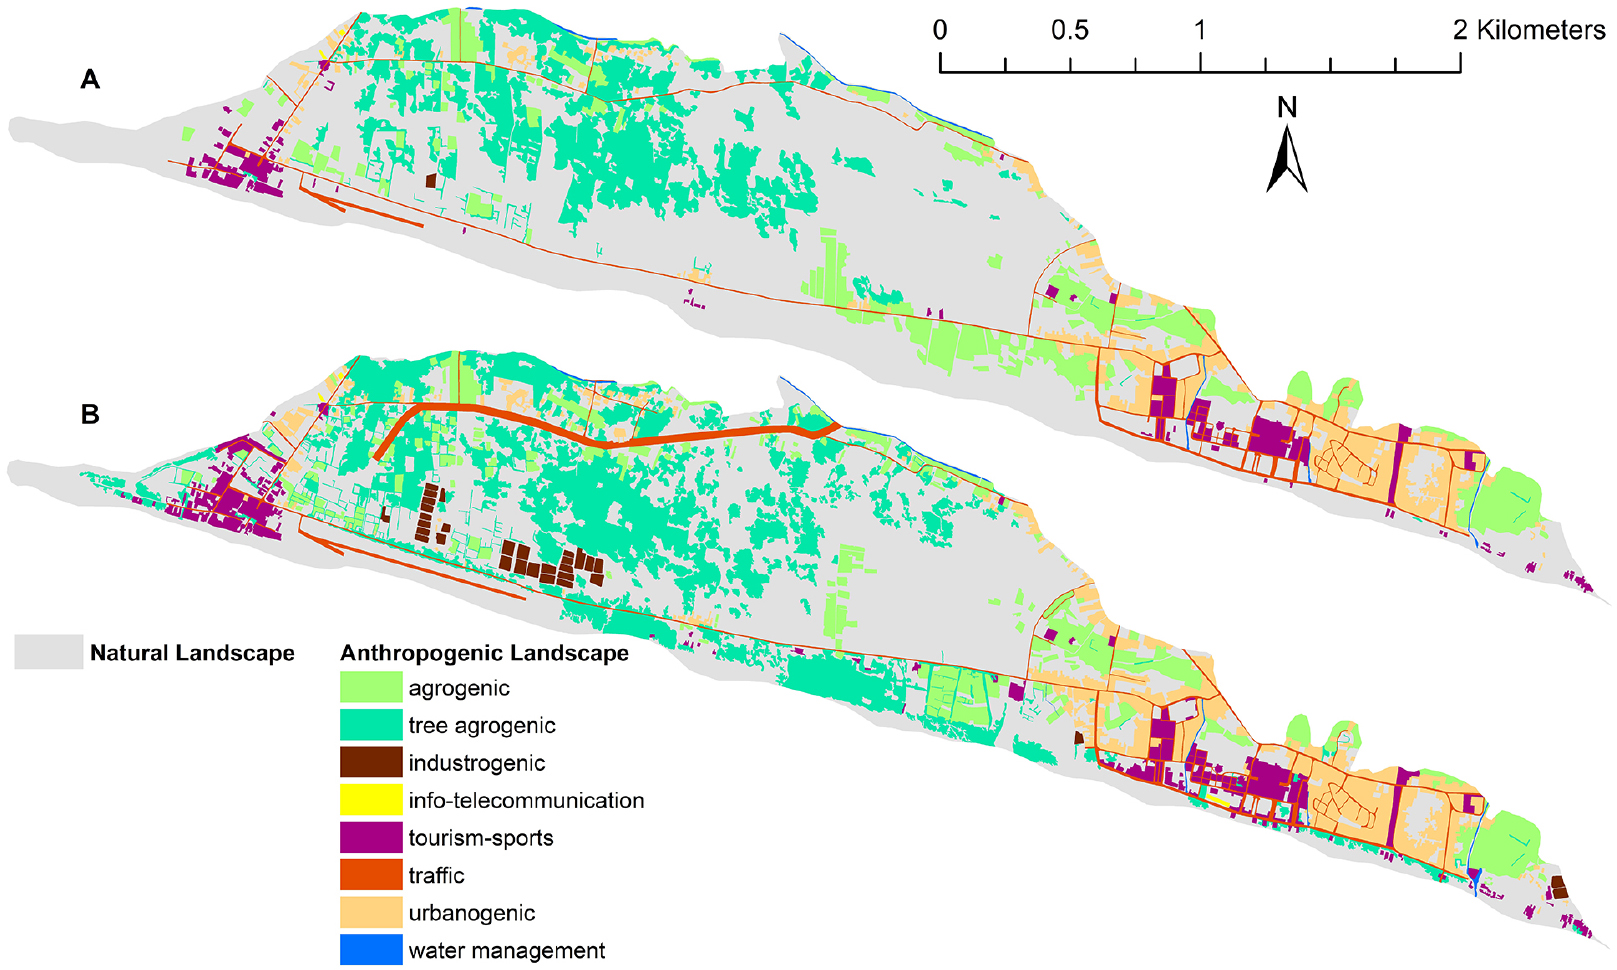
Fig 5.
Spatial distribution of human interventions in 2011 (A) and 2020 (B).
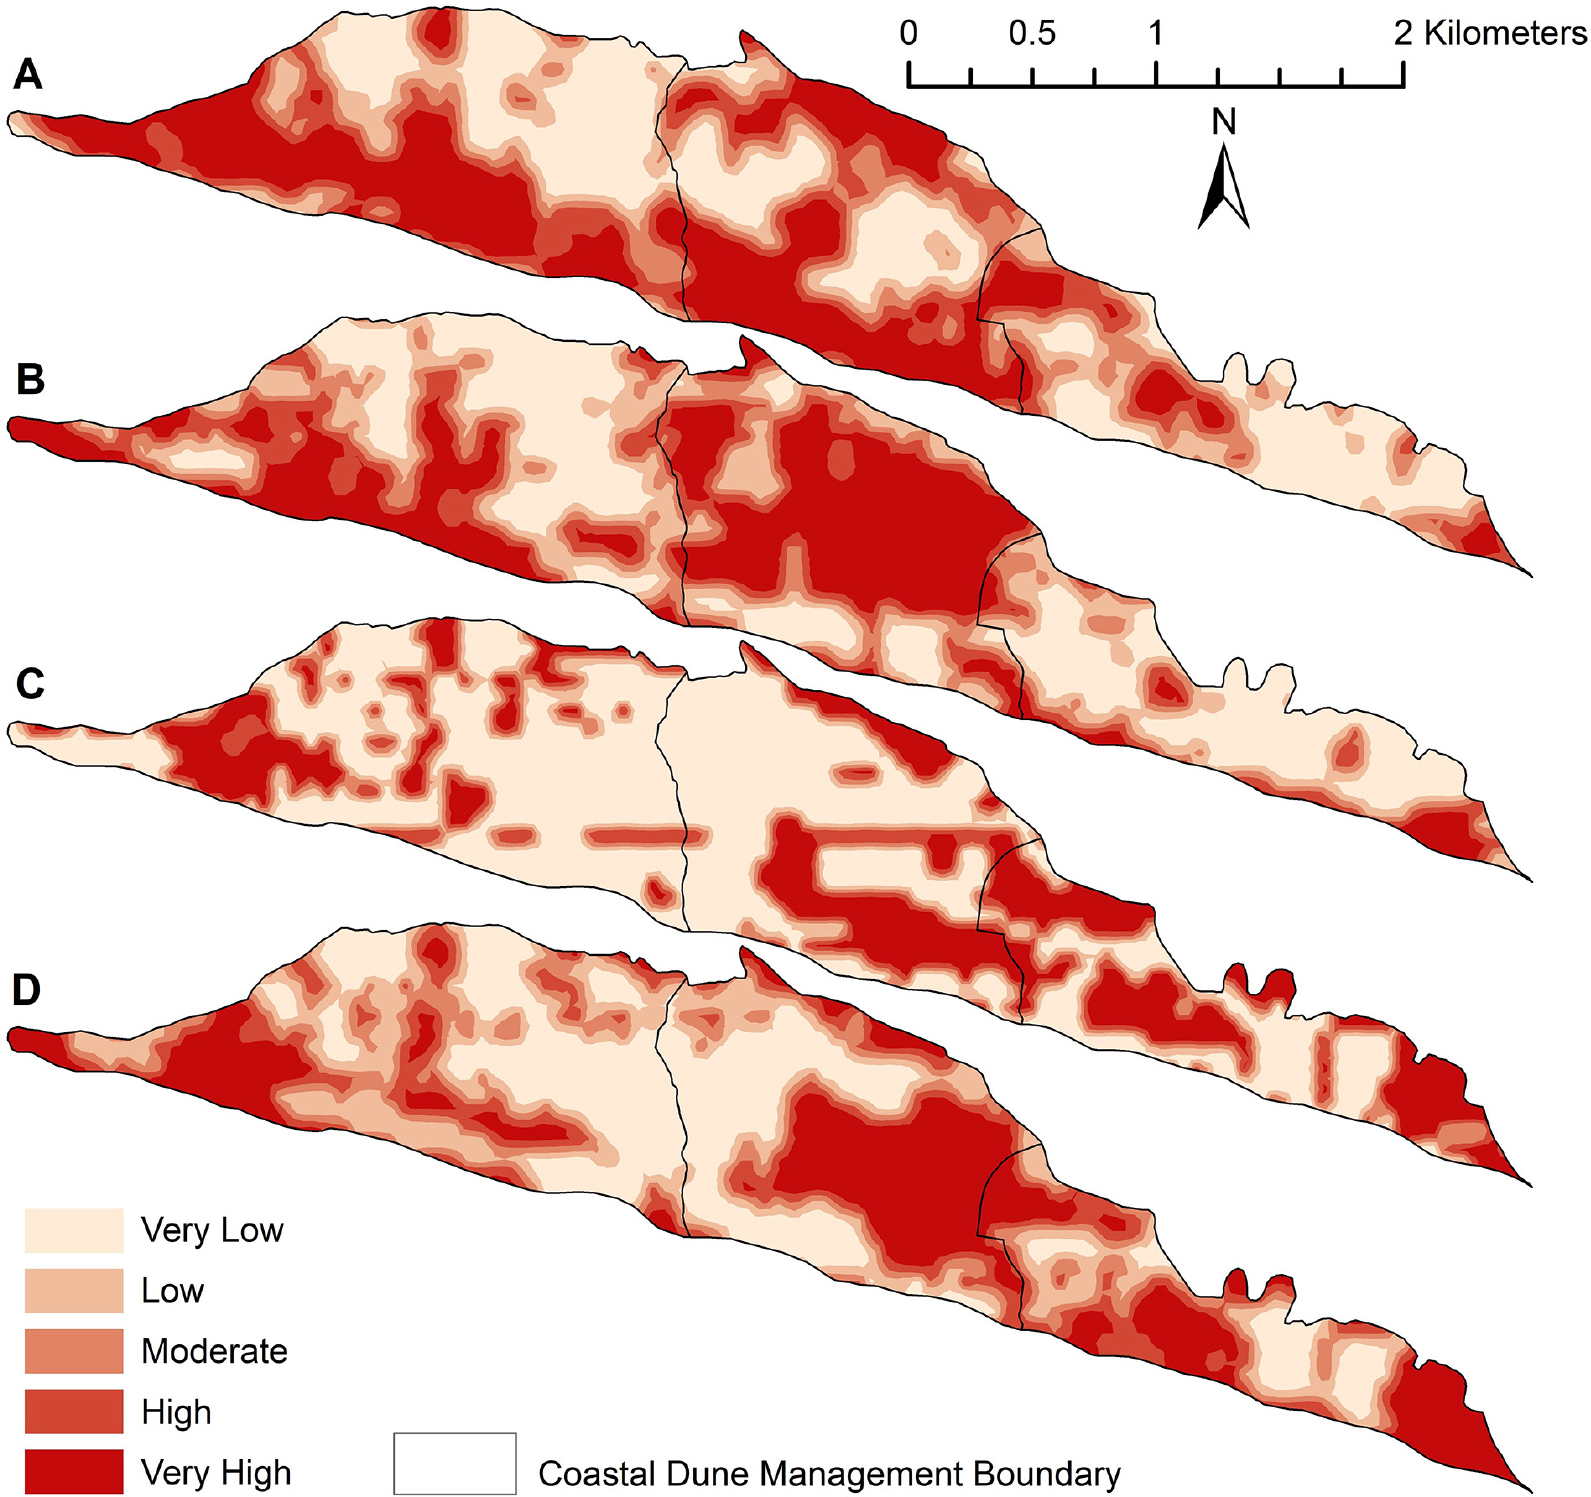
Fig 6.
Spatial distribution of the landscape ecological risk (LER) levels for every landscape ecological unit (LEU) generated with four scenarios: 2011 sub-class (A), 2020 sub-class (B), 2011 class (C) and 2020 class (D).
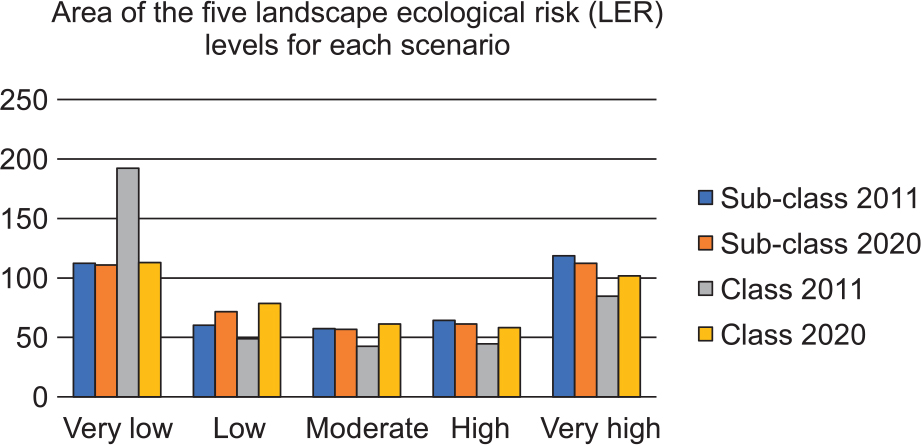
Fig 7.
Area of the five landscape ecological risk (LER) levels for each scenario.
Table 5.
Global spatial autocorrelation of landscape ecological risk (LER) in the Parangtritis coastal dune.
| Scenario | Moran’s I | Zscore |
|---|---|---|
| Sub-class 2011 | 0.4112 | 18.0872 |
| Sub-class 2020 | 0.6342 | 27.0196 |
| Class 2011 | 0.5775 | 24.6668 |
| Class 2020 | 0.6177 | 26.3570 |
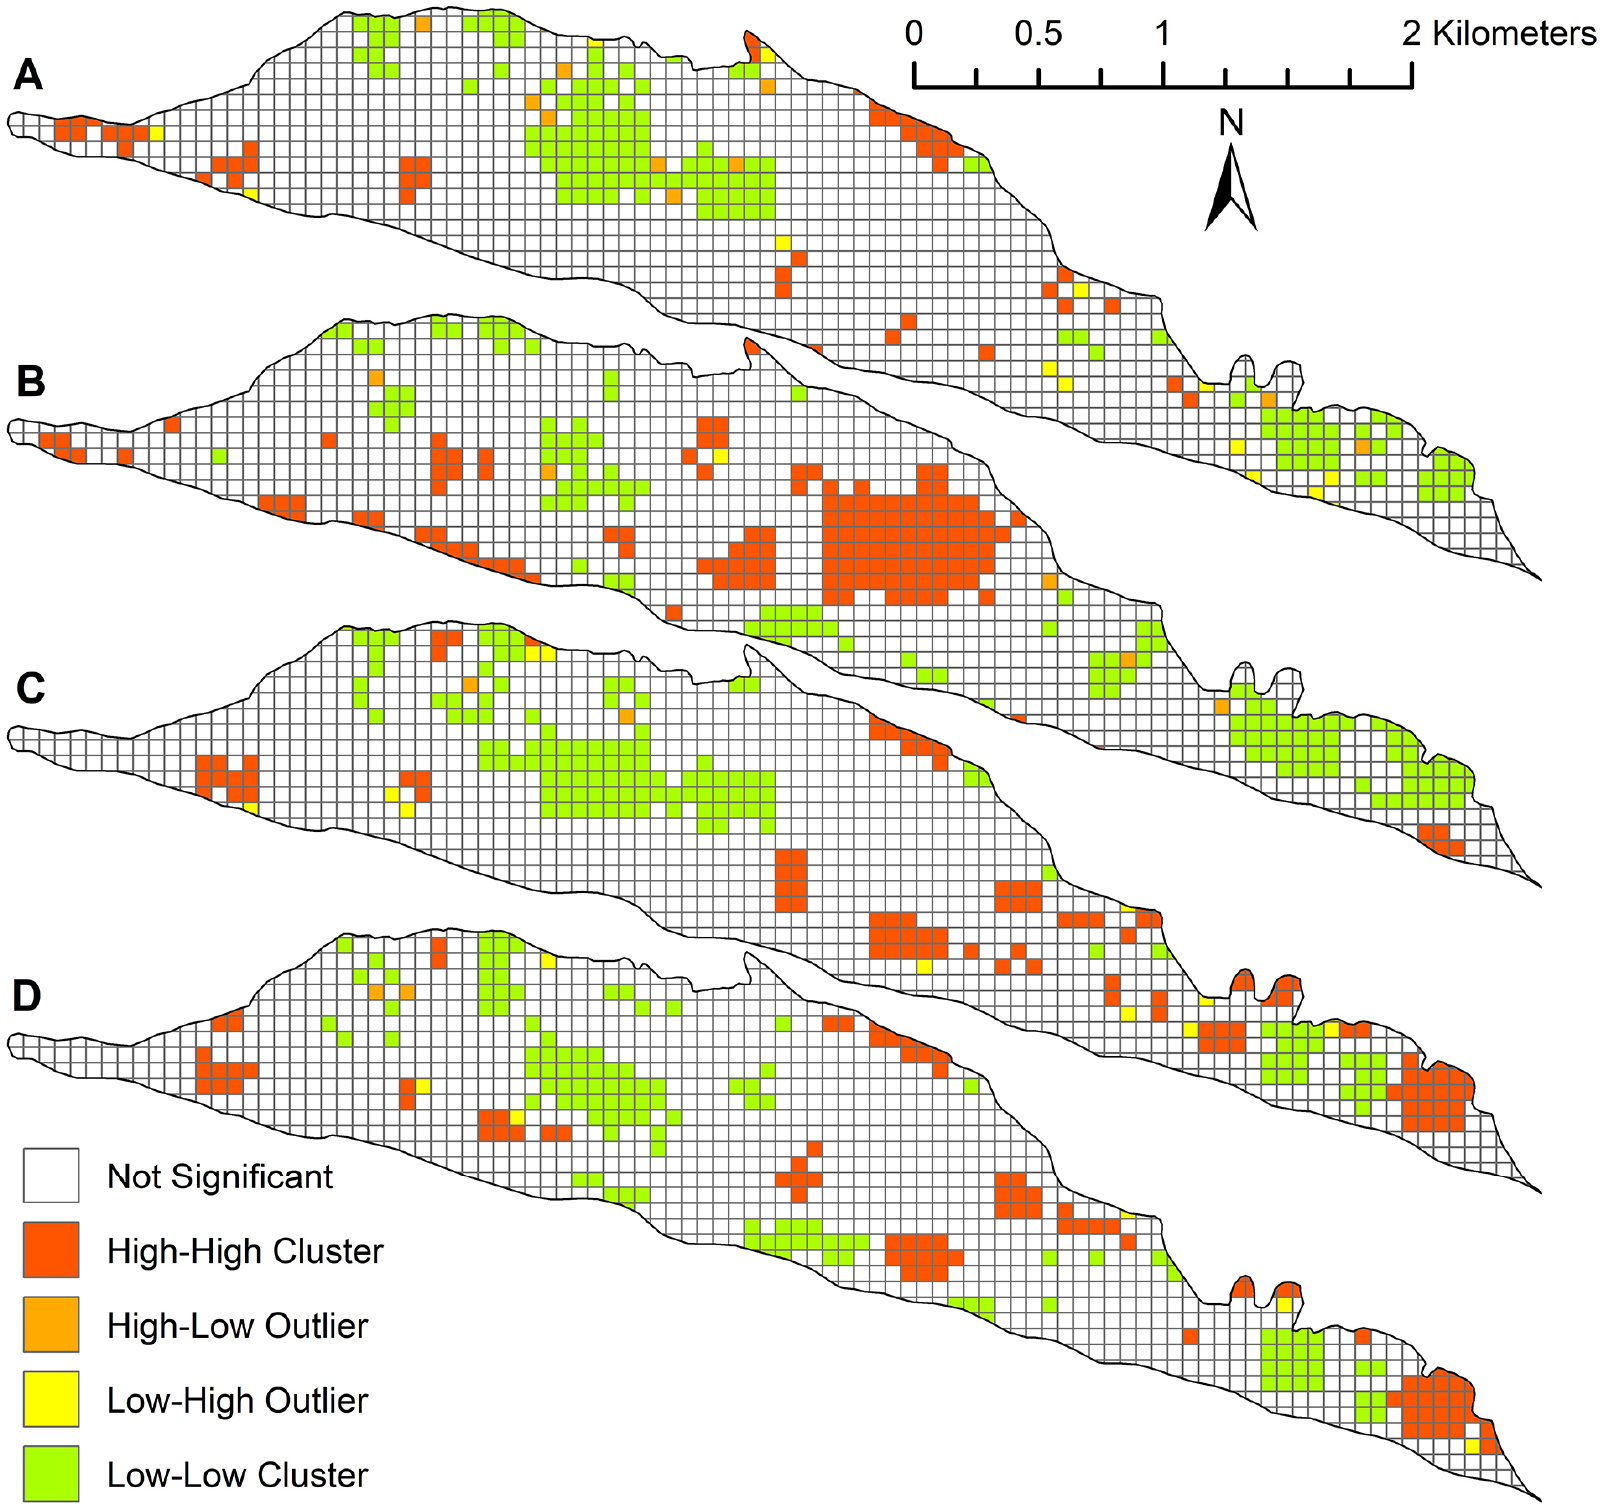
Fig 8.
Local indicator of spatial association (LISA) cluster map showing the local spatial autocorrelation of landscape ecological risk (LER) in the Parangtritis coastal dune.