
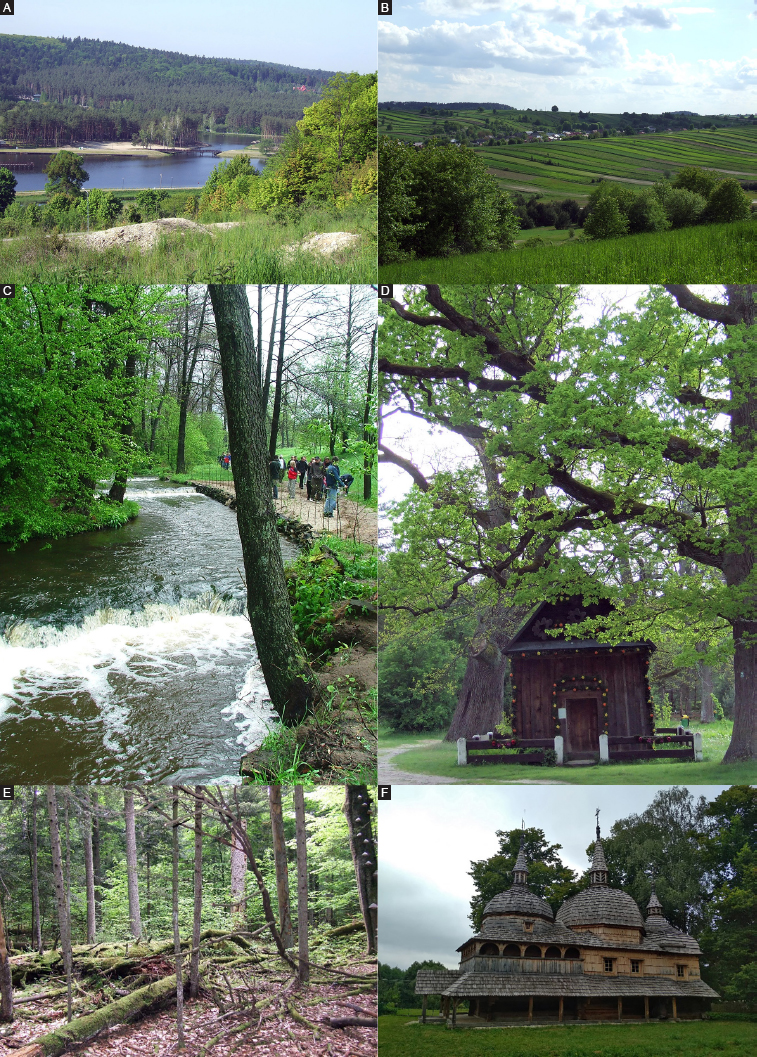
Fig. 1.
Examples of tourism resources in Lublin Province: A – the water reservoir in Krasnobród; B – typical agro-forest landscapes of Lublin Province; C – the steep points in the Tanew river bed and a tourist path in the Roztocze region; D – the historic wooden chapel in Górecko Kościelne; E – forests in the Roztocze National Park; F – St Paraskeva Greek Catholic Church in Nowe Brusno.
Source: photo C taken by Teresa Brzezińska-Wójcik; the remaining photos taken by Ewa Skowronek.
Table 1.
Indexes documenting the degree of tourism development in Lublin Province in 2018.
| Province | Number of tourist accommodation facilities per 100 km2 | Index | |||||
|---|---|---|---|---|---|---|---|
| Tourist function by Bartje-Defert (beds in accommodation facilities per 100 inhabitants) | Tourist traffic intensity | Tourist accommodation infrastructure (accommodation facilities users) | Density | ||||
| Schneider’s (accommodation facilities users per 100 inhabitants) | Charvat’s (tourists’ overnight stays per 100 inhabitants) | accommodation facilities (beds per 1 km2) | tourist traffic (tourist accommodation users per 1 km2) | ||||
| Lublin | 1.9 | 1.3 | 50.9 | 108.3 | 40.6 | 1.1 | 43 |
| Position of Lublin Province among Poland’s 16 provinces | 13 | 9 | 13 | 13 | 9 | 15 | 15 |
Table 2.
Comparison of the promotional campaigns for Lublin Province in 2008-2018.
| Year | Name of campaign / Advertising slogan | Objective | Cost (in EUR*) |
|---|---|---|---|
| 2008 | ‘Lubelskie great for the weekend’ | Presenting the most popular tourist places in the region: Lublin, Zamość, Kazimierz Dolny, Chełm, Nałęczów; Demonstrating the province as an interesting destination for a weekend trip; | 97,000 |
| 2009 | ‘Lubelskie—switch off tension, switch on power’ | Showing the region as a place to relax and ‘charge the batteries’; | 178,000 |
| 2010 | ‘Lubelskie—may the moment last’ | Showing the region as a place to relax and rest in nature, as well as the pleasant emotions related to it; | 333,000 |
| 2011 | ‘Lubelskie Brand’ | Promoting the province as a place producing tasty and healthy foods by combining many years of tradition with innovative solutions in agriculture and the food industry; | No data |
| 2011 | ‘Lubelskie. Savour life!’ | Building an image of the Lublin region as an ecological food centre and an interesting destination, where it is possible to taste the culinary richness, but also to ‘try’ culture, benefit from the beauty of nature, and follow one’s passions; | 222,000 |
| 2011–2012 | ‘The Tastes of Lubelszczyzna’ | 220,000 | |
| 2014 | ‘Lubelskie—for a while or longer’ | Showing the province as an area that inspires people to be active in various spheres; With regard to tourism, promoting the region as a recreational place where it is possible to enjoy life and feel free; With regard to business, showing the area as a region that is attractive for starting and developing business activity; | 222,000 |
| 2014 | ‘Enjoy Lubelskie’ | 161,000 | |
| 2014 | ‘The Lubelskie Brand connects us’ | Promoting the economic potential of the region and local providers of products and services; | No data |
| 2015 | ‘Lubelskie. The best because it’s ours!’ | Building the image and recognisability of food products coming from the Lublin region; | No data |
| 2016 | ‘The power is in us!’ | Promoting the potential of the province, which lies in people, technology, science and the natural environment. | No data |
| 2017–2018 | No promotional campaigns | ||
1 Source: authors’ elaboration based on Kruszyńska, Bojarska (2014), Lemanowicz (2016), Mazurek-Kusiak, Wojciechowska-Solis (2014), Lubelskie. Kampanie promocyjne (2022).
Table 3.
Characteristics of the respondents.
| Demographic factors | Sample details | |||||||
|---|---|---|---|---|---|---|---|---|
| gender [% (N)] | males | females | no data | |||||
| 41.36 (109) | 57.07 (79) | 1.57 (3) | ||||||
| age [% (N)] | under 20 | 21-30 | 31-40 | 41-50 | 51-60 | 61-70 | over 70 | no data |
| 8.38 (16) | 26.17 (50) | 19.90 (38) | 18.85 (36) | 10.99 (21) | 12.04 (23) | 1.05 (2) | 2.62 (5) | |
| education [% (N)] | elementary | middle school | vocational | secondary | college | higher vocational | university (MA) | no data |
| 0.52 (1) | 2.62 (5) | 3.14 (6) | 27.23 (52) | 8.38 (16) | 12.56 (24) | 42.93 (82) | 2.62 (5) | |
| place of residence [% (N)] | country | town with fewer than 20,000 inhabitants | town with 20-50,000 inhabitants | city with 51-100,000 inhabitants | city with 101-200,000 inhabitants | city with 201-500,000 inhabitants | city with over 500,000 inhabitants | no data |
| 11.00 (21) | 13.61 (26) | 5.76 (11) | 13.61 (26) | 4.71 (9) | 4.71 (9) | 43.98 (84) | 2.62 (5) | |
| province [% (N)] | Łódź | Mazovia | ||||||
| 54.45 (104) | 45.55 (87) | |||||||
Table 4.
The purpose of travel given by the respondents who were staying in Lublin Province.
| Purpose of travel | Respondents | |
|---|---|---|
| [number] | [%] | |
| tourist | 101 | 52.9 |
| other, including: | 90 | 47.1 |
| business | 35 | 38.9 |
| visiting family | 29 | 32.2 |
| visiting friends | 27 | 30.0 |
| education | 16 | 17.8 |
| other | 5 | 5.6 |
Table 5.
The structure of the respondents’ answers regarding the place of stay in Lublin Province.
| Respondents | Places/regions | ||||||||||||||
|---|---|---|---|---|---|---|---|---|---|---|---|---|---|---|---|
| Lublin | Zamość | Kazimierz Dolny | Puławy | Nałęczów | Chełm | Roztoczeregion | Zwierzyniec | Świdnik | Włodawa | Biłgoraj | Szczebrzeszyn | Krasnystaw | Kozłówka | ||
| visiting (N=191) | N | 134 | 48 | 37 | 17 | 17 | 12 | 16 | 6 | 4 | 4 | 3 | 2 | 2 | 2 |
| % | 70.16 | 25.13 | 19.37 | 8.90 | 8.90 | 6.28 | 8.38 | 3.14 | 2.09 | 2.09 | 1.57 | 1.05 | 1.05 | 1.05 | |
| visiting for tourist purposes (N=101) | N | 68 | 25 | 26 | 12 | 10 | 7 | 12 | 5 | 4 | 4 | 2 | 2 | 1 | 2 |
| % | 67.33 | 24.75 | 25.74 | 11.88 | 9.90 | 6.93 | 11.88 | 4.95 | 3.96 | 3.96 | 1.98 | 1.98 | 0.99 | 1.98 | |
| visiting for other purposes (N=90) | N | 66 | 23 | 11 | 5 | 7 | 5 | 4 | 1 | 0 | 0 | 1 | 0 | 1 | 0 |
| % | 73.33 | 25.56 | 12.22 | 5.56 | 7.78 | 5.56 | 4.44 | 1.11 | 0.00 | 0.00 | 1.11 | 0.00 | 1.11 | 0.00 | |
| Chi-square p | 0.820 0.365 | 0.016 0.898 | 5.570 0.018 | 1.633Y 0.201 | 0.068Y 0.795 | 0.009Y 0.926 | 2.529Y 0.112 | 1.216Y 0.270 | 1.965Y 0.161 | 1.965Y 0.161 | 0.010Y 0.920 | 0.397Y 0.529 | 0.397Y 0.529 | 0.397Y 0.529 | |
Table 6.
The structure of the respondents’ answers regarding the tourist attractiveness of Lublin Province.
| Respondents | Answers | |||
|---|---|---|---|---|
| Yes | No | I do not know | ||
| visiting (N=191) | N | 144 | 9 | 38 |
| % | 75.39 | 4.71 | 19.90 | |
| visiting for tourist purposes (N=101) | N | 88 | 2 | 11 |
| % | 87.13 | 1.98 | 10.89 | |
| visiting for other purposes (N=90) | N | 56 | 7 | 27 |
| % | 62.22 | 7.78 | 30.00 | |
| Chi2 | Chi2 = 16.045 | |||
| p | p < 0.001 | |||
Table 7.
Components determining tourist attractiveness of Lublin Province according to the respondents.
| Groups of components | Types of components | Respondents | Chi2, p | |||||
|---|---|---|---|---|---|---|---|---|
| total | visiting for tourist purposes | visiting for different purposes | ||||||
| N | % | N | % | N | % | |||
| 1. Attractions | historical-cultural | 113 | 59.16 | 69 | 68.32 | 44 | 48.89 | Chi2=7.435, p=0.006 |
| natural | 51 | 26.70 | 35 | 34.65 | 16 | 17.78 | Chi2=6.925, p=0.009 | |
| recreational | 42 | 21.99 | 25 | 24.75 | 17 | 18.89 | Chi2=0.954 p=0.329 | |
| created | 6 | 3.14 | 4 | 3.96 | 2 | 2.22 | Chi2Y=0.074, p=0.786 | |
| unique | 5 | 2.62 | 1 | 0.99 | 4 | 4.44 | Chi2Y=1.079, p=0.299 | |
| 2. Support services and facilities | 7 | 3.66 | 7 | 6.93 | 0 | 0.00 | Chi2Y=4.661, p=0.031 | |
| 3. People-related factors | 7 | 3.66 | 5 | 4.95 | 2 | 2.22 | Chi2Y=0.379, p=0.538 | |
| 4. Other | 6 | 3.14 | 4 | 3.96 | 2 | 2.22 | Chi2Y=0.074, p=0.786 | |
Table 8.
Attributes determining the tourist attractiveness of Lublin Province, quoted by the respondents.
| Groups | Types | Attributes | Respondents | Chi2, p | |||||
|---|---|---|---|---|---|---|---|---|---|
| total | visiting for tourist purposes | visiting for different purposes | |||||||
| determining tourist attractiveness | N | % | N | % | N | % | |||
| 1. Attractions | historical-cultural | historical monuments | 85 | 44.50 | 52 | 51.49 | 33 | 36.67 | Chi2=4.231, p=0.040 |
| historical past | 14 | 7.33 | 12 | 11.88 | 2 | 2.22 | Chi2Y=5.192, p=0.023 | ||
| cultural events and institutions | 16 | 8.38 | 10 | 9.90 | 6 | 6.67 | Chi2Y=0.296, p=0.587 | ||
| historical spatial layout | 15 | 7.85 | 8 | 7.92 | 7 | 7.78 | Chi2Y=0.055, p=0.816 | ||
| culinary heritage | 10 | 5.24 | 4 | 3.96 | 6 | 6.67 | Chi2Y=0.263, p=0.608 | ||
| natural | attractive natural areas | 43 | 22.51 | 31 | 30.69 | 12 | 13.33 | Chi2=8.222, p=0.004 | |
| forests | 2 | 1.05 | 0 | 0.00 | 2 | 2.22 | Chi2Y=0.630, p=0.427 | ||
| parks | 2 | 1.05 | 2 | 1.98 | 0 | 0.00 | Chi2Y=0.397, p=0.529 | ||
| national parks | 4 | 2.09 | 2 | 1.98 | 2 | 2.22 | Chi2Y=0.152, p=0.697 | ||
| gullies | 1 | 0.52 | 0 | 0.00 | 1 | 1.11 | Chi2Y=0.003, p=0.954 | ||
| river falls | 1 | 0.52 | 0 | 0.00 | 1 | 1.11 | Chi2Y=0.003, p=0.954 | ||
| recreational | beautiful landscapes/beautiful locations | 26 | 13.61 | 18 | 17.82 | 8 | 8.89 | Chi2=2.514, p=0.112 | |
| geographical landscapes | 5 | 2.62 | 3 | 2.97 | 2 | 2.22 | Chi2Y=0.017, p=0.896 | ||
| greenery (lush greenery) | 5 | 2.62 | 2 | 1.98 | 3 | 3.33 | Chi2Y=0.017, p=0.896 | ||
| good condition of natural environment | 6 | 3.14 | 2 | 1.98 | 4 | 4.44 | Chi2Y=0.313, p=0.576 | ||
| climate | 2 | 1.05 | 1 | 0.99 | 1 | 1.11 | Chi2Y=0.397, p=0.529 | ||
| created | places of entertainment/ attractions | 6 | 3.14 | 4 | 3.96 | 2 | 2.22 | Chi2Y=0.074, p=0.786 | |
| unique | numerous attractions | 2 | 1.05 | 0 | 0.00 | 2 | 2.22 | Chi2Y=0.630, p=0.427 | |
| genius loci | 2 | 1.05 | 0 | 0.00 | 2 | 2.22 | Chi2Y=0.630, p=0.427 | ||
| shopping malls | 1 | 0.52 | 1 | 0.99 | 0 | 0.00 | Chi2Y=0.003, p=0.954 | ||
| 2. Support services and facilities | tourist infrastructure | 5 | 2.62 | 5 | 4.95 | 0 | 0.00 | Chi2Y=2.839, p=0.091 | |
| bike paths | 5 | 2.62 | 5 | 4.95 | 0 | 0.00 | Chi2Y=2.839, p=0.092 | ||
| other (marketing) | 1 | 0.52 | 1 | 0.99 | 0 | 0.00 | Chi2Y=0.003, p=0.954 | ||
| 3. People-related factors | local inhabitants’ friendliness and good atmosphere for recreation | 7 | 3.66 | 5 | 4.95 | 2 | 2.22 | Chi2Y=0.379, p=0.538 | |
| 4. Other | location | 4 | 2.09 | 4 | 3.96 | 0 | 0.00 | Chi2Y=1.965, p=0.161 | |
| simplicity | 2 | 1.05 | 0 | 0.00 | 2 | 2.22 | Chi2Y=0.630, p=0.427 | ||