
Figure 1
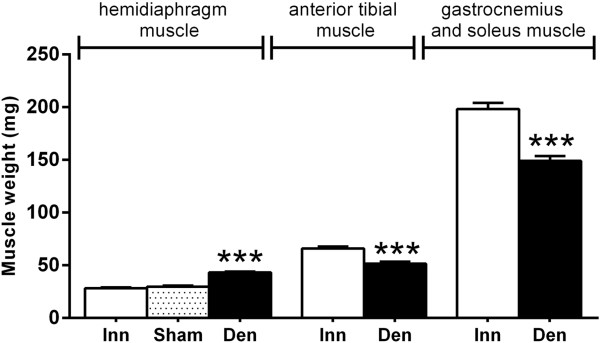
Muscle weights. Muscle weights of 6-days denervated (Den) hypertrophic hemidiaphragm muscles, 6-days denervated atrophic anterior tibial and pooled gastrocnemius and soleus muscles compared to innervated (Inn) controls. Mean values ± standard error of the mean. ***p < 0.001, n = 8 muscles per group.
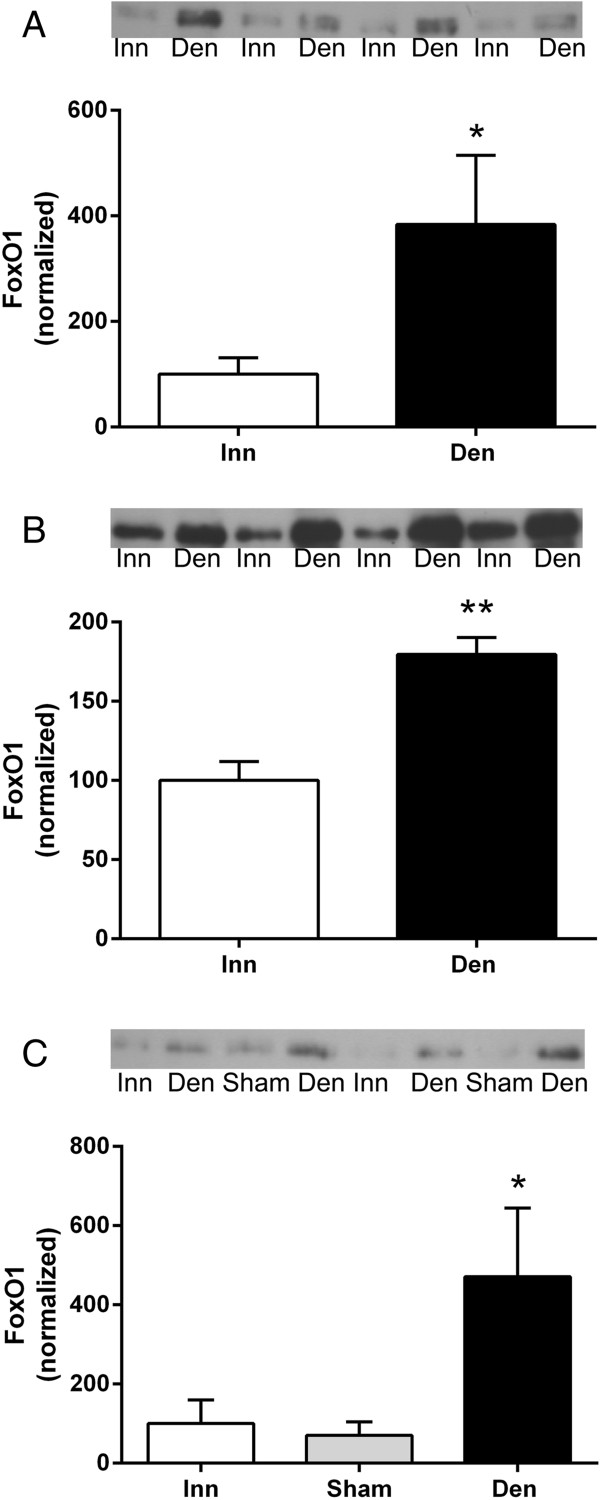
Figure 2
Total FoxO1 protein expression in 6-days denervated atrophic hind-limb muscles and in 6-days denervated hypertrophic hemidiaphragm muscle. Total protein expression of FoxO1 in 6-days denervated (Den) atrophic anterior tibial muscle (A), atrophic pooled gastrocnemius and soleus muscles (B), and in hypertrophic hemidiaphragm muscle (C) compared to innervated (Inn) and sham operated controls. Representative images of Western blots are shown together with densitometric quantifications. One innervated sample from the respective muscle type was loaded onto all gels as a reference. All samples were measured relative to this reference. The data were normalized to give a mean value of 100.0 in innervated muscles. Mean values ± standard error of the mean. *p < 0.05, **p < 0.01, n = 8 muscles per group.
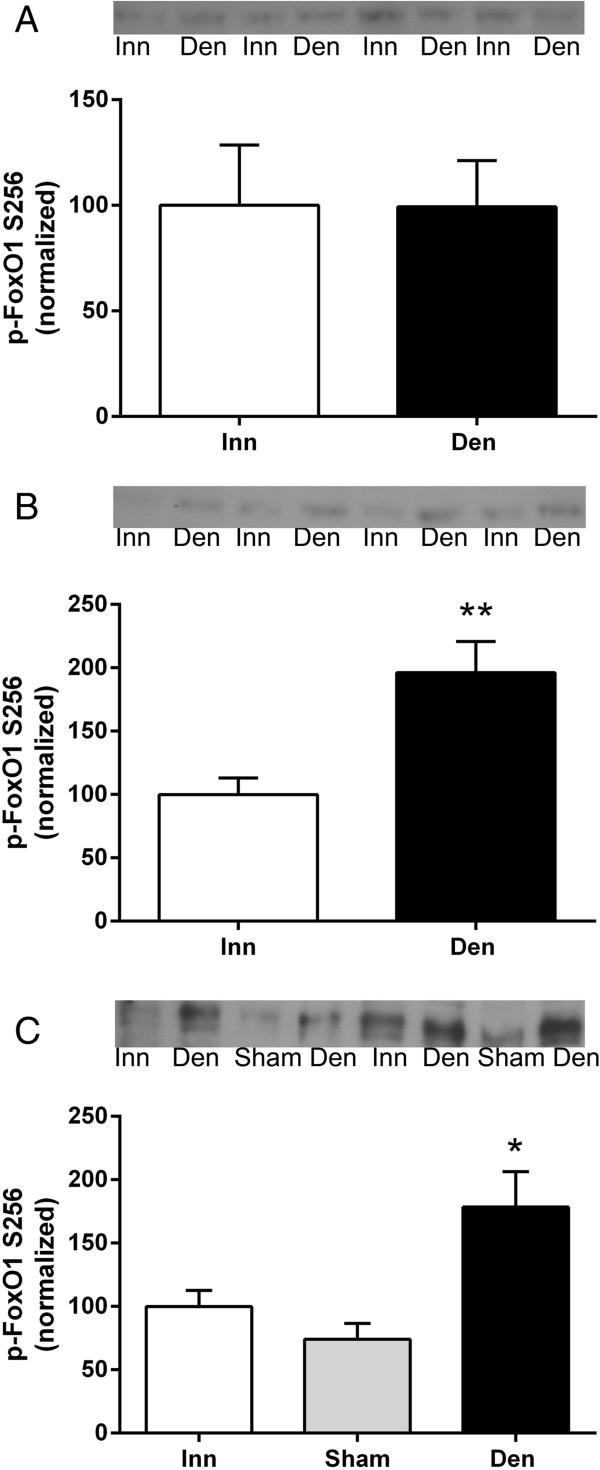
Figure 3
FoxO1 phosphorylation in 6-days denervated atrophic hind-limb muscles and in 6-days denervated hypertrophic hemidiaphragm muscle. Expression of phosphorylated FoxO1 in 6-days denervated (Den) atrophic anterior tibial muscle (A), atrophic pooled gastrocnemius and soleus muscles (B), and in hypertrophic hemidiaphragm muscle (C) compared to innervated (Inn) and sham operated controls. Representative images of Western blots are shown together with densitometric quantifications. One innervated sample from the respective muscle type was loaded onto all gels as a reference. All samples were measured relative to this reference. The data were normalized to give a mean value of 100.0 in innervated muscles. Mean values ± standard error of the mean. *p < 0.05, **p < 0.01, n = 8 muscles per group.
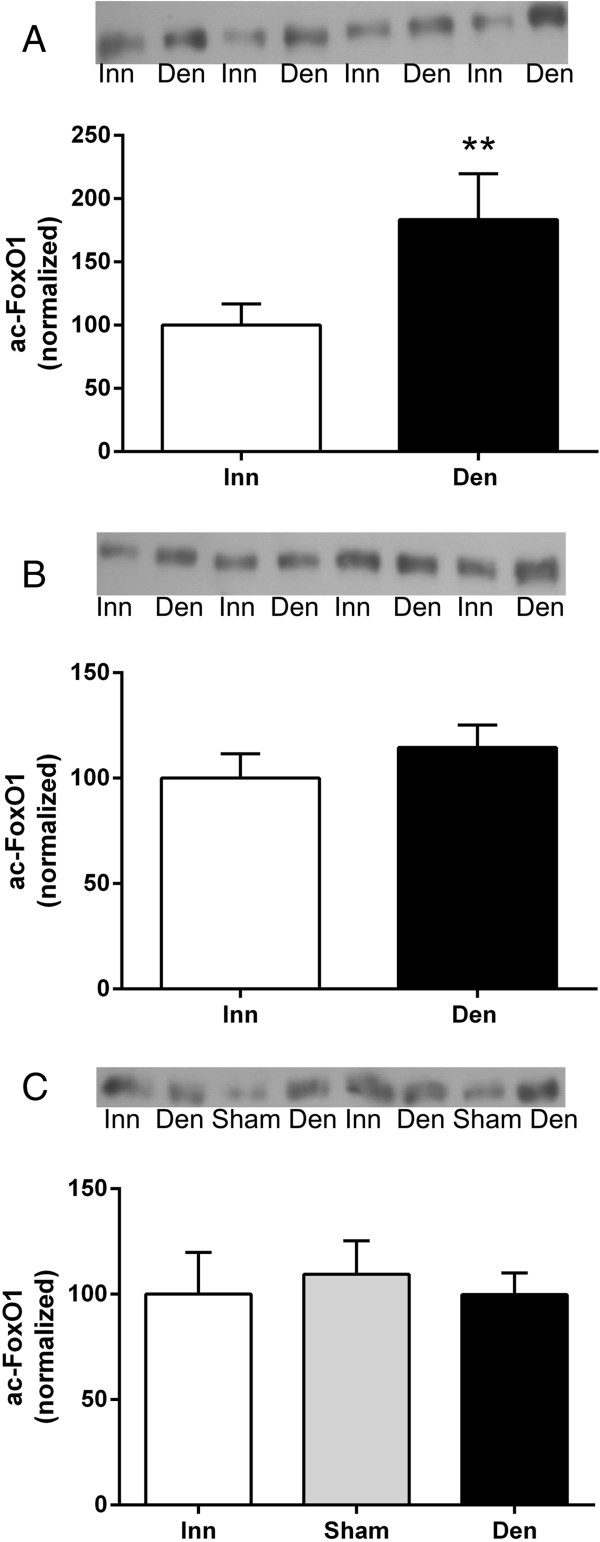
Figure 4
FoxO1 acetylation in 6-days denervated atrophic hind-limb muscles and in 6-days denervated hypertrophic hemidiaphragm muscle. Expression of acetylated FoxO1 in 6-days denervated (Den) atrophic anterior tibial (A), atrophic pooled gastrocnemius and soleus muscles (B), and in hypertrophic hemidiaphragm muscle (C) compared to innervated (Inn) and sham operated controls. Representative images of Western blots are shown together with densitometric quantifications. One innervated sample from the respective muscle type was loaded onto all gels as a reference. All samples were measured relative to this reference. The data were normalized to give a mean value of 100.0 in innervated muscles. Mean values ± standard error of the mean. **p < 0.01, n = 8 muscles per group.
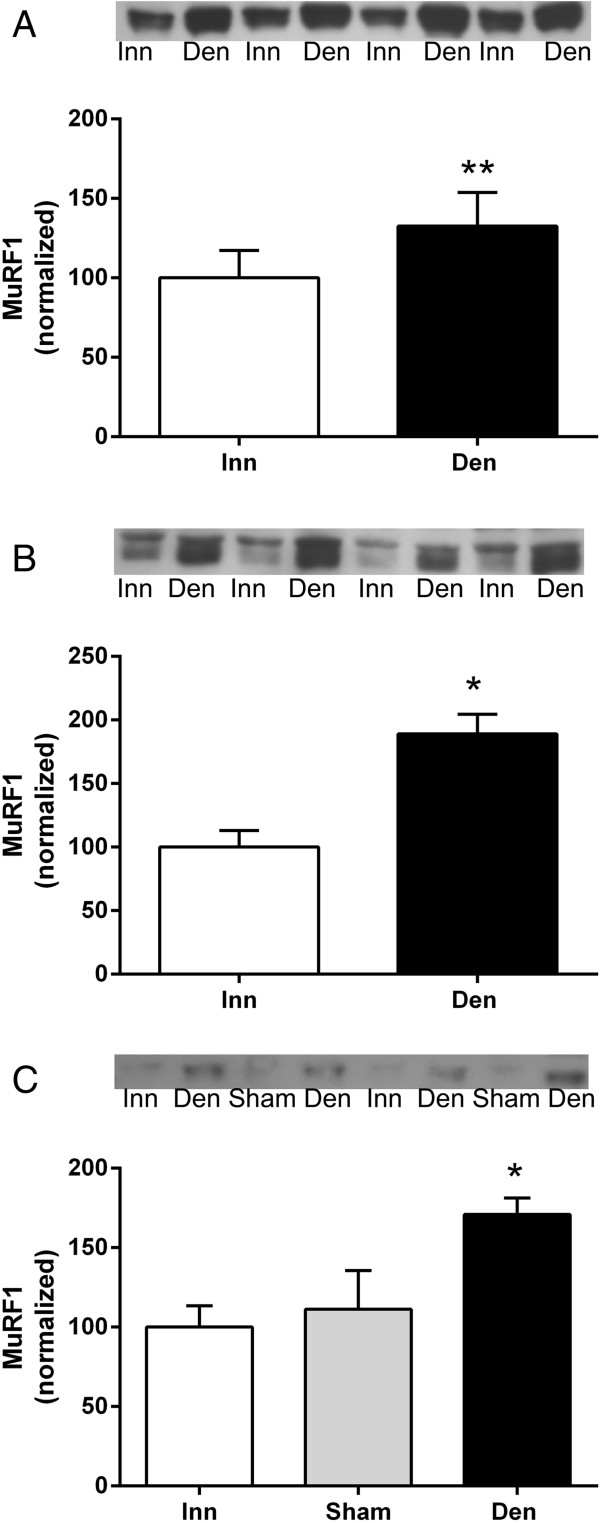
Figure 5
MuRF1 protein expression in 6-days denervated atrophic hind-limb muscles and in 6-days denervated hypertrophic hemidiaphragm muscle. MuRF1 expression in 6-days denervated (Den) atrophic anterior tibial (A), atrophic pooled gastrocnemius and soleus muscles (B), and in hypertrophic hemidiaphragm muscle (C) compared to innervated (Inn) and sham operated controls. Representative images of Western blots are shown together with densitometric quantifications. One innervated sample from the respective muscle type was loaded onto all gels as a reference. All samples were measured relative to this reference. The data were normalized to give a mean value of 100.0 in innervated muscles. Mean values ± standard error of the mean. *p < 0.05, **p < 0.01, n = 8 (A and C) or 7 (B) muscles per group.
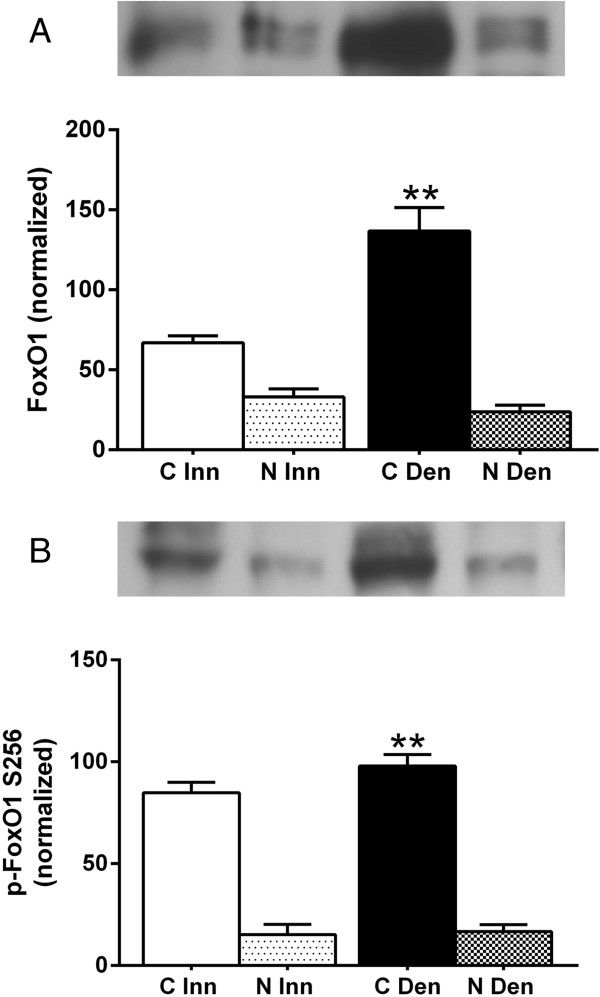
Figure 6
FoxO1 protein expression and phosphorylation levels in cytosolic and nuclear fractions of 6-days denervated atrophic anterior tibial muscle. Total FoxO1 protein expression (A) and phosphorylation levels (B) in cytosolic (C) and nuclear (N) fractions of 6-days denervated (Den) atrophic anterior tibial muscle compared to innervated (Inn) controls. Representative images of Western blots are shown together with densitometric quantifications. One innervated cytosolic sample was loaded onto all gels as a reference. All samples were measured relative to this reference. The data were normalized so that the sum of cytosolic and nuclear signals in innervated muscles will give a mean value of 100.0. Mean values ± standard error of the mean. Statistical comparisons were made between cytosolic fractions of denervated versus innervated muscles and between nuclear fractions of denervated versus innervated muscles. **p < 0.01, n = 8 denervated anterior tibial muscles and 8 contralateral innervated control muscles. Each muscle was fractionated into a cytosolic and a nuclear fraction.
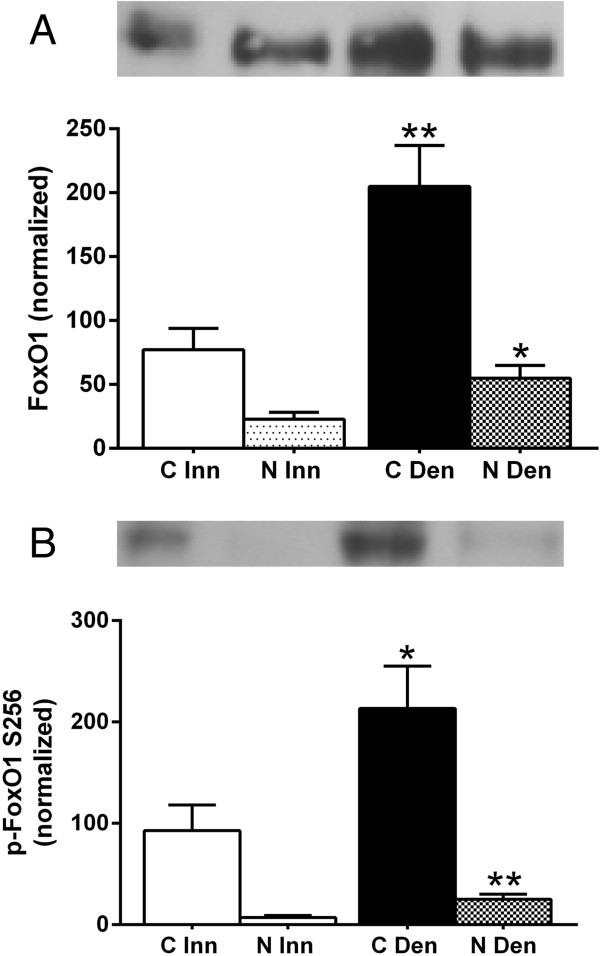
Figure 7
FoxO1 protein expression and phosphorylation levels in cytosolic and nuclear fractions of 6-days denervated hypertrophic hemidiaphragm muscle. Total FoxO1 protein expression (A) and phosphorylation levels (B) in cytosolic (C) and nuclear (N) fractions of 6-days denervated (Den) hypertrophic hemidiaphragm muscle compared to innervated (Inn) controls. Representative images of Western blots are shown together with densitometric quantifications. One innervated cytosolic sample was loaded onto all gels as a reference. All samples were measured relative to this reference. The data were normalized so that the sum of cytosolic and nuclear signals in innervated muscles will give a mean value of 100.0. Mean values ± standard error of the mean. Statistical comparisons were made between cytosolic fractions of denervated versus innervated muscles and between nuclear fractions of denervated versus innervated muscles. *p < 0.05, **p < 0.01, n = 8 denervated hemidiaphragm muscles and 8 innervated control hemidiaphragms from separate animals. Each muscle was fractionated into a cytosolic and a nuclear fraction.
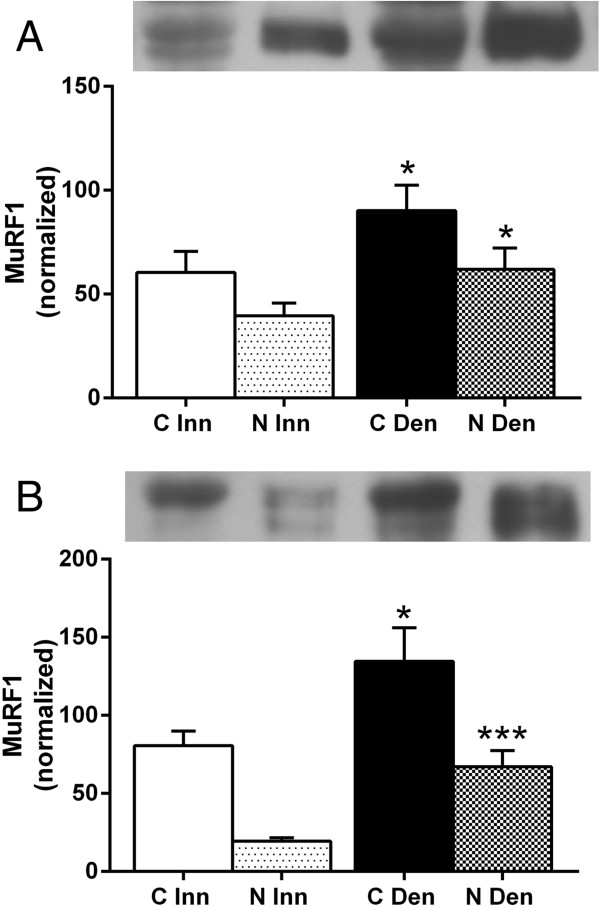
Figure 8
MuRF1 protein expression in cytosolic and nuclear fractions of 6-days denervated atrophic anterior tibial muscle and in 6-days denervated hypertrophic hemidiaphragm muscle. MuRF1 expression in cytosolic (C) and nuclear (N) fractions of 6-days denervated (Den) atrophic anterior tibial muscle (A) and 6-days denervated hypertrophic hemidiaphragm muscle (B) compared to innervated (Inn) controls. Representative images of Western blots are shown together with densitometric quantifications. One innervated cytosolic sample was loaded onto all gels as a reference. All samples were measured relative to this reference. The data were normalized so that the sum of cytosolic and nuclear signals in innervated muscles will give a mean value of 100.0. Mean values ± standard error of the mean. Statistical comparisons were made between cytosolic fractions of denervated versus innervated muscles and between nuclear fractions of denervated versus innervated muscles. *p < 0.05, ***p < 0.001, n = 8 denervated hemidiaphragm muscles and 8 innervated control hemidiaphragms from separate animals. Each muscle was fractionated into a cytosolic and a nuclear fraction.