
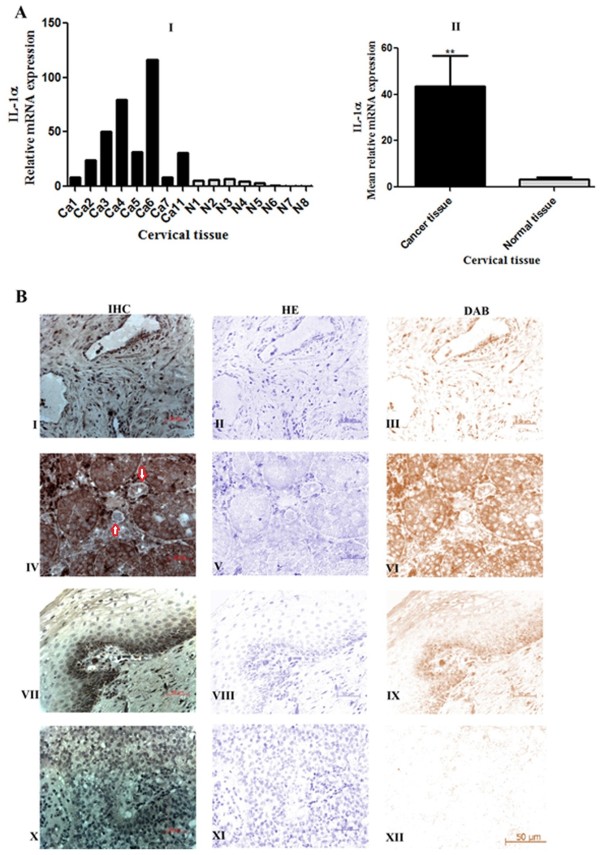
Figure 1
Expression of IL-1α mRNA and protein in cervical squamous cell carcinoma, adenocarcinoma and normal cervix. A, Relative mRNA expression of IL-1α in (I) cervical squamous cell carcinoma (Ca.1-Ca.7, adenocarcinoma (Ca.11), and normal cervix (N1-N8). (II) Mean relative IL-1α mRNA expression in neoplastic and normal cervical tissue explant as determined by qPCR and shown in (I). B, IL-1α expression by immunohistochemistry (IHC) staining. I, II, III shows IHC, hematoxylin (HE), and diaminobenzidine (DAB) stain of epithelial cells of squamous cell carcinoma, respectively. IV-VI shows IHC, HE, and DAB stain of columnar and glandular epithelium of adenocarcinoma, respectively. VII-IX shows IHC, HE, and DAB stain of normal tissue, respectively. Minimal IL-1α signal was detected in normal cervical tissue (VII and IX). X-XII is control and shows IHC, HE, and DAB stain of normal tissue, respectively. IL-1α staining was abolished in sections incubated with the biotinylated secondary antibody alone (negative control) (X and XII). Scale bar, 50 μm. Data represented as mean ± SEM. **, indicates statistical significance at P < 0.01.
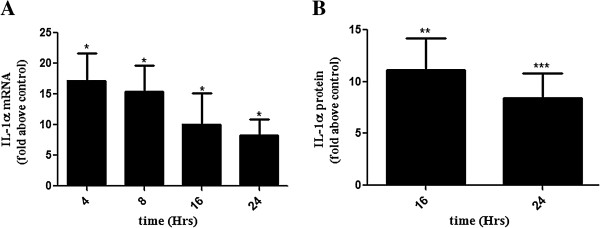
Figure 2
SP induces IL-1α mRNA and protein expression in HeLa cells. Relative expression of IL-1α mRNA (A) and IL-1α protein (B) in HeLa cells treated with SP (1:50 dilution) relative to PBS (control) for 4, 8, 16, or 24 hrs as determined by qPCR and ELISA. Data are presented as mean ± SEM from 5 (A) and 6 (B) independent experiments (n = 5 and 6). Paired T-tests were conducted on the untransformed means of the replicates between SP and control. *, **, and *** indicates significance at P < 0.05, P < 0.01 and P < 0.001, respectively.
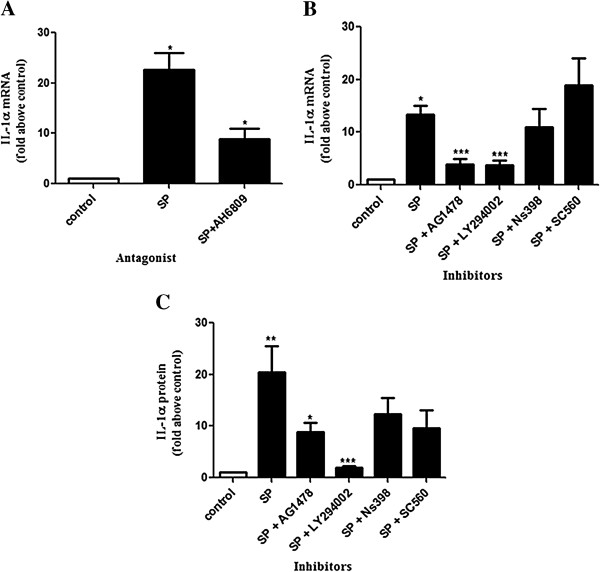
Figure 3
IL-1α mRNA and protein expression in HeLa cells is regulated by seminal plasma via the EP2 receptor, EGFR and PI3K pathways. IL-1α mRNA (A and B) and protein (C) as determined by qPCR and ELISA analysis, respectively. HeLa cells were treated for 4 (A and B) and 16 hours (C) with seminal plasma (1:50) or vehicle in the absence/presence of EP2 receptor antagonist [AH-6809; 20 μM] and chemical inhibitors to EGFR kinase [AG-1478; 100 nM], PI3 kinase [LY-294002; 25 μM], PTGS1 [SC-560; 15 μM] or PTGS2 [NS-398; 8 μM]. Data are represented as mean ± SEM from 5 independent experiments. Paired T-tests were conducted on the untransformed means of the replicates between SP and control and unpaired T-tests performed on SP versus SP and inhibitor after conversion to fold increases. *, **, and *** indicates significance at P < 0.05, P < 0.01, and P < 0.001, respectively.
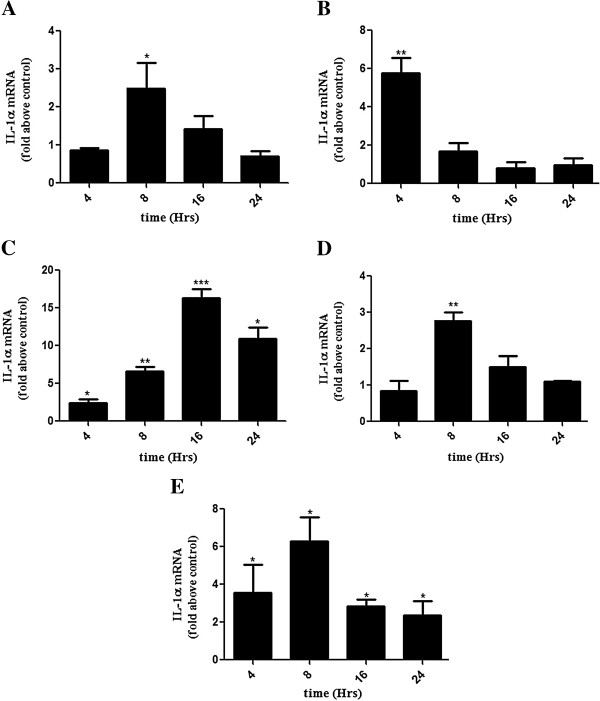
Figure 4
Induction of IL-1α mRNA in HeLa cells by PGE2 and Butaprost with and without EGF. Induction of IL-1α mRNA in HeLa cells by PGE2(A), EGF (B), PGE2 and EGF (C), butaprost (D) and butaprost and EGF (E) as determined by qPCR. HeLa cells were treated for 4, 8, 16 and 24 hours with PGE2 [300 nM] or human recombinant EGF [10 ng/mL] or butaprost [5 μM] or butaprost together with EGF or PGE2 together with EGF or vehicle as control. Data are represented as mean ± SEM from 5 independent experiments. Paired T-tests were conducted on the untransformed means of the replicates between PGE2 or EGF or butaprost or butaprost and EGF or PGE2 and EGF treated cells and control. *, ** and *** indicates significance at P < 0.05, P < 0.01, and P < 0.001, respectively.
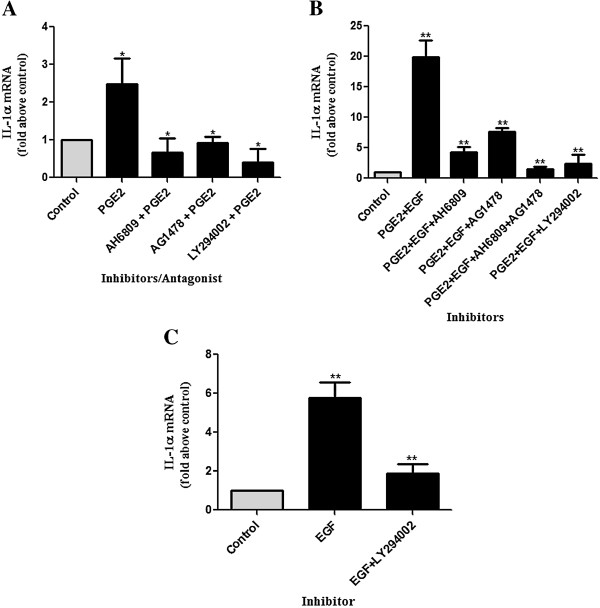
Figure 5
EP2 antagonist and EGFR and PI3 kinase inhibitors, inhibit PGE2 or PGE2 and EGF or EGF mediated induction of IL-1α in HeLa cells. EP2 antagonist, EGFR and PI3 kinase inhibitors inhibit PGE2(A), PGE2 and EGF (B), and EGF (C) mediated induction of IL-1α in HeLa cells as determined by qPCR. HeLa cells were treated for 4, 8 and 16 hours with EGF [10 ng/mL], or PGE2 [300 nM] or both or vehicle in the absence/presence of antagonist/inhibitors AH6809 [20 μM], AG1478 [100 nM], AH6809 together with AG1478, and LY294002 [25 μM]. Data are represented as mean ± SEM from 5 independent experiments. Paired T-tests were conducted on the untransformed means of the replicates between ligand/ligands treated cells and control and unpaired T-tests performed on ligand/ligands versus ligand/ligands and inhibitor after conversion to fold increases. * and ** indicates significance at P < 0.05 and P < 0.01, respectively.
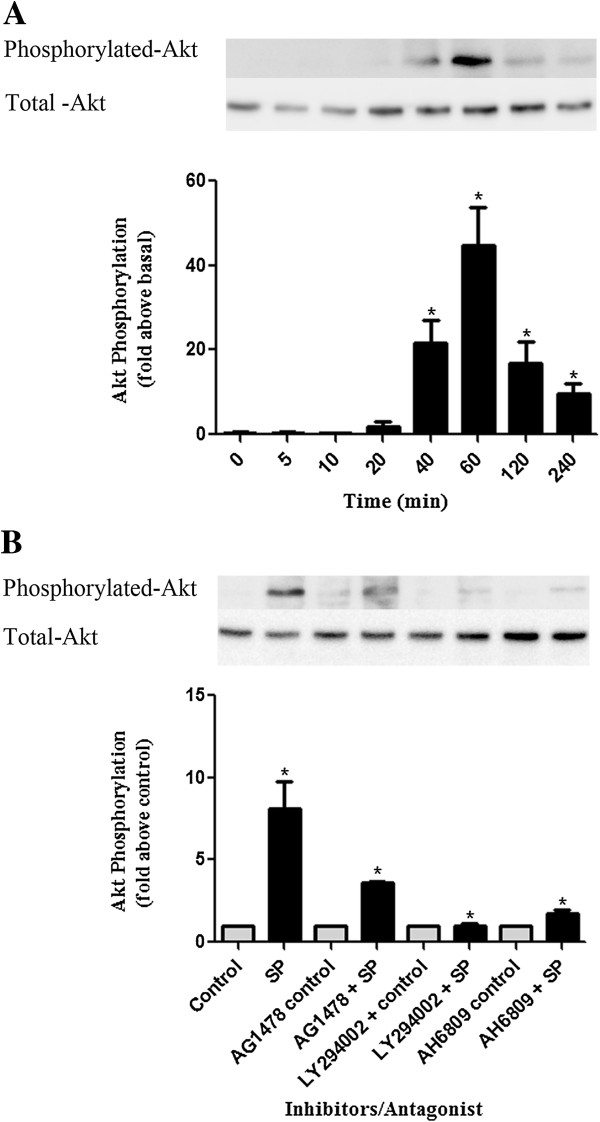
Figure 6
SP induces Akt phosphorylation in HeLa cells. (A) Akt phosphorylation in HeLa S3 cells treated with SP (1:50) or control for 0, 5, 10, 20, 40, 60, 120, and 240 min. (B) Akt phosphorylation in HeLa cells treated for 60 min with SP (1:50) or control in the presence/absence of chemical inhibitors/antagonist EGFR kinase [AG-1478;100 nM], PI3 kinase [LY-294002; 25 μM] and EP2 antagonist [AH-6809; 20 μM]. Cell lysate were subjected to immunoblot analysis. Data are represented as mean ± SEM form 3 independent experiments. Paired T-tests were conducted on the untransformed means of the replicates between SP and control and unpaired T-tests performed on SP versus SP and inhibitor after conversion to fold increases. *indicates P < 0.05.
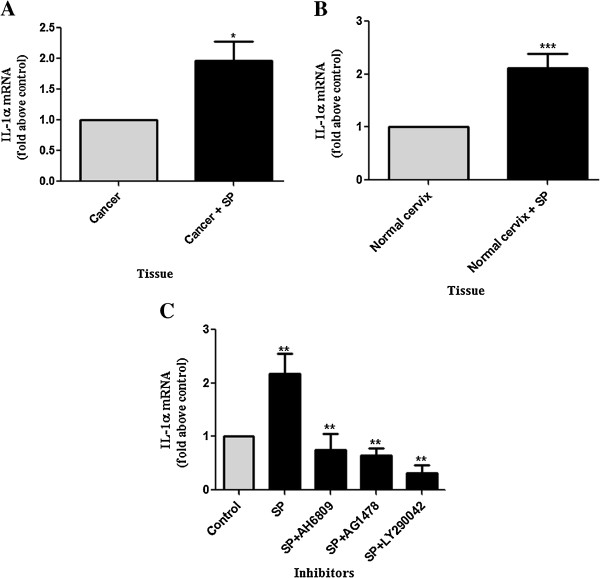
Figure 7
SP induces IL-1α mRNA expression in neoplastic and normal cervical tissue explants. SP induce IL-1α mRNA expression in neoplastic (A) and normal (B) cervical tissue explant. SP induces the expression of IL-1α in normal cervical tissue via the activation of EP2/EGFR/PI3 kinase inflammatory pathways as determined by qPCR (C). Data represented as mean ± SEM of (n = 12 (A), n = 10 (B) and n = 7 (c), respectively). Paired T-tests were conducted on the untransformed means of the replicates between SP and control and unpaired T-tests performed on SP versus SP and inhibitor after conversion to fold increases. *, ** and *** represent significance at P < 0.05, P < 0.01 and P < 0.001, respectively.
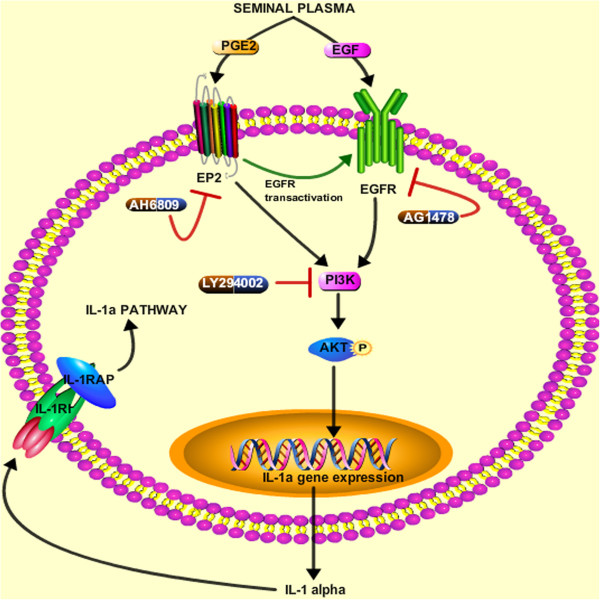
Figure 8
Schematic summary highlighting the role of SP and its constituents (PGE2 and EGF) in the regulation of signaling pathway mediating IL-1α (IL-1 alpha) expression in cervical epithelial cells. Expressed IL-1α can then bind to its cognate receptor, interleukin-1 receptor type I (IL-1RI) to recruit interleukin-1 receptor accessory protein (IL-1RAP) on same cell leading to the activation of IL-1α signaling pathway (IL-1a pathway).