
Figure 1
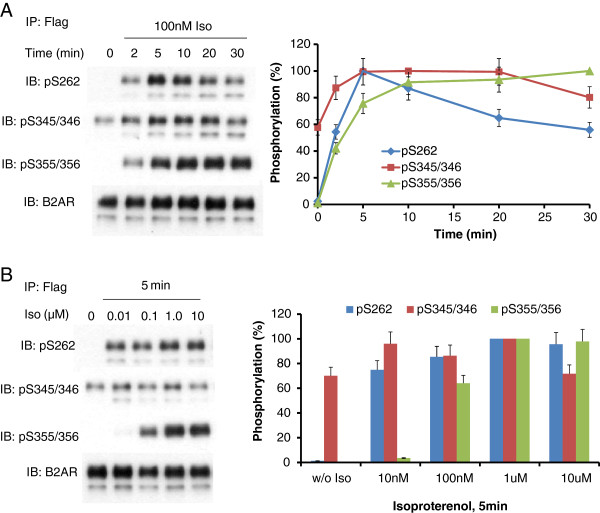
β2AR phosphorylation in HEK293 cells challenged with beta-adrenergic agonist. HEK293 clones stably expressing N-terminal Flag-tagged, C-terminal eGFP-tagged β2AR were treated either with 100 nM isoproterenol for the indicated times (A) or with varying concentrations of the beta-adrenergic agonist, isoproterenol for 5 min (B). β2AR was immunoprecipitated with anti-Flag immunoadsorption beads. SDS-PAGE and immunoblotting were performed as indicated in the Materials and methods section. The phosphorylation of β2AR was normalized to total β2AR. The data were quantified and are displayed as percentage of maximum phosphorylation of each site (s). The experimental data shown is of a single analysis performed in triplicate and replicated multiple times with similar results.
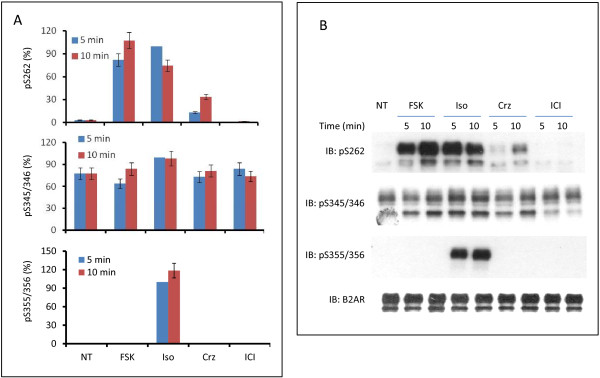
Figure 2
β2AR phosphorylation in HEK293 cells challenged with beta-adrenergic agonist, forskolin, carazolol or ICI118,551. HEK293 cells stably expressing N-terminal Flag-tagged, C-terminal eGFP-tagged β2AR treated without (NT) or with either 10 μM isoproterenol (Iso), 10 μM forskolin (FSK), 10 μM carazolol (Crz) or 10 μM ICI118,551 (ICI) for 5 or 10 min. β2AR was immunoprecipitated with anti-Flag immunoadsorption beads. SDS-PAGE and immunoblotting were performed as indicated in the Materials and methods section. The phosphorylation of β2AR was normalized to total β2AR. The data were quantified and are displayed as percentage of phosphorylation of each site (s) sampled at 5-min following stimulation with the beta-adrenergic agonist isoproterenol. The experimental data shown are of a single analysis performed in triplicate and replicated multiple times with similar results. (A) Quantification of phosphorylation of S262, S345/346 and S355/356. (B) Representative westernblotting image.
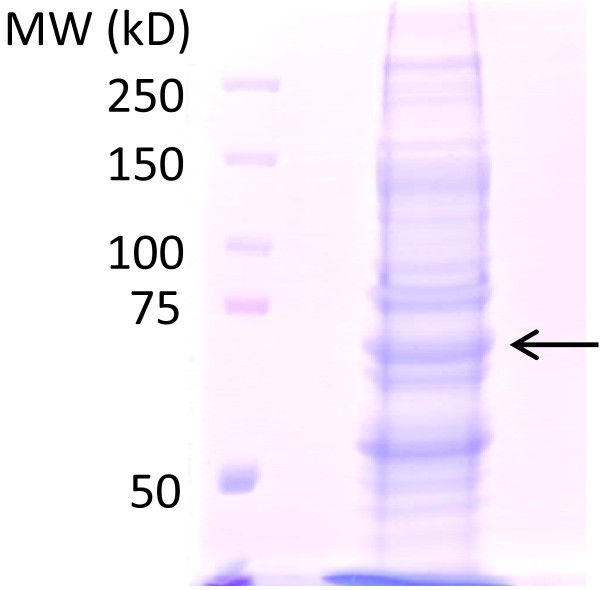
Figure 3
SDS-PAGE analysis of β2AR phosphorylated in HEK293 cells challenged with beta-adrenergic agonist. HEK293 cells stably expressing N-terminal Flag-tagged, C-terminal eGFP-tagged β2AR treated either without or with 10 μM isoproterenol for 10 min. β2AR was immunoprecipitated with anti-Flag immunoadsorption beads, treated with PNGase F, eluted from the beads, and then concentrated. Samples were subjected to SDS-PAGE on 6.5% acrylamide separating gels, as described in experimental procedures. Bands of N-terminal Flag-tagged, C-terminal eGFP-tagged β2AR are indicated with “arrows”. These data are from single experimental determinations, replicated multiple times with similar results.
Table 1
Phosphorylated peptides detected by LC-MS/MS
| Peptide sequence | Start | End |
|---|---|---|
| K.LLCEDLPGTEDFVGHQGTVPSDNIDSQGR.N | L376 | R404 |
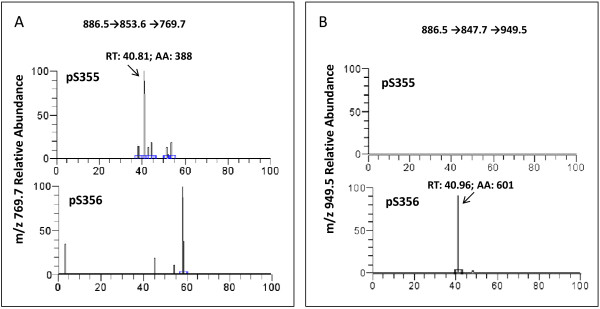
Figure 4
Targeted MS of phosphorylation sites S355 and S356 of β2AR. Relative abundance of m/z 769.7 (A) and m/z 949.5 (B) from mono-phospho-peptides, containing either pS355 or pS356. For protocol, see the Materials and methods section.
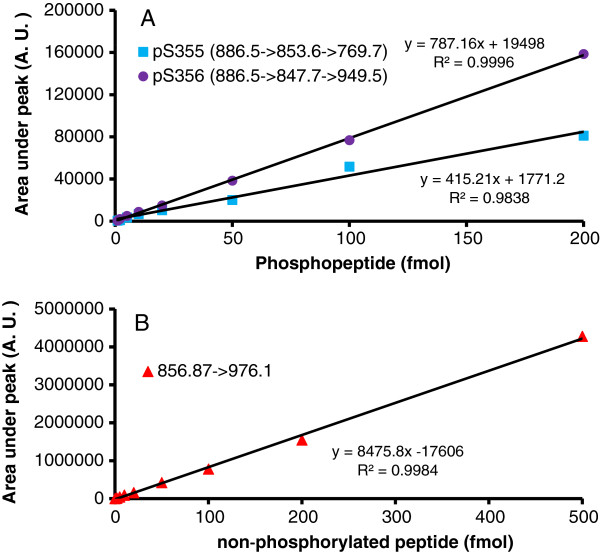
Figure 5
Targeted MS of phosphorylation sites S355 and S356 of β2AR: calibration curves of target peptide standards. Calibration curve of mono-phospho-peptides (A) containing pS355 (●) or pS356 (■) and non-phospho-peptide (B). For protocol, see the Materials and methods section.