
Figure 1
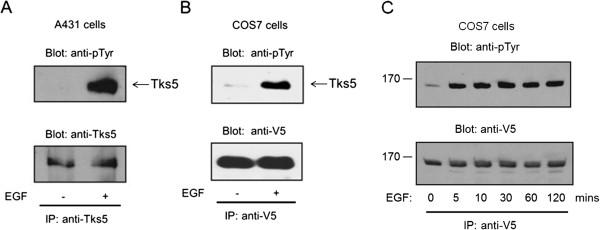
Tks5 is tyrosine phosphorylated upon EGF treatment of cells. (A) Serum-starved A431 cells were stimulated with EGF (50 ng/ml) for 10 min, and then endogenous Tks5 was immunoprecipitated (IP) with a polyclonal anti-Tks5 antibody. After SDS-PAGE and transfer to nitrocellulose, samples were analysed by anti-phosphotyrosine and anti-Tks5 antibodies. (B) Wild type, V5 epitope-tagged Tks5 was transiently expressed in COS7 cells and then serum-starved cells were stimulated with EGF (50 ng/ml) for 10 min or left untreated. Cell lysates were immunoprecipitated with anti-V5 antibody and the immunoprecipitates were immunoblotted with anti-phosphotyrosine and anti-V5 antibodies. (C) V5 epitope-tagged Tks5 was transiently expressed in COS7 cells and then serum-starved cells were stimulated with EGF (50 ng/ml) as indicated. Cell lysates were immunoprecipitated with anti-V5 antibody and the immunoprecipitates were immunoblotted with anti-phosphotyrosine and anti-V5 antibodies. These results are representative of three experiments.
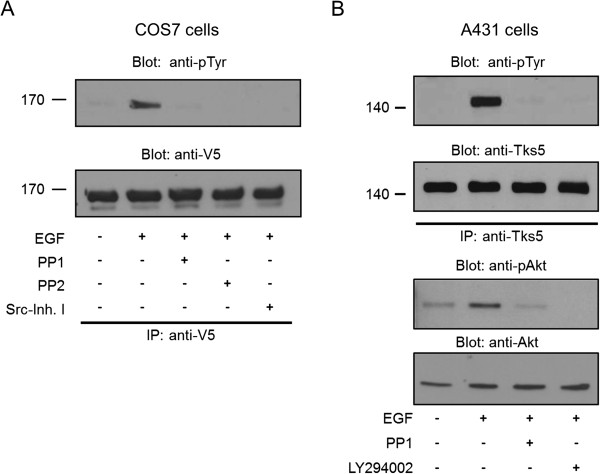
Figure 2
Phosphorylation of Tks5 upon EGF stimulation requires Src. (A) COS7 cells were transiently transfected with V5-Tks5 construct and after overnight serum-starvation cells were stimulated with EGF or left untreated. Prior to stimulation, the cells were pretreated with the Src kinase inhibitors as indicated. Tks5 was then immunoprecipitated with anti-V5 antibody and subjected to anti-phosphotyrosine and anti-V5 immunoblots. (B) Serum-starved A431 cells were stimulated with EGF (50 ng/ml) for 10 min. Prior to stimulation, the cells were pretreated with the Src kinase inhibitor PP1 and the PI 3-kinase inhibitor LY294002. Endogenous Tks5 was immunoprecipitated (IP) with a polyclonal anti-Tks5 antibody. After SDS-PAGE and transfer to nitrocellulose, samples were analysed by anti-phosphotyrosine and anti-Tks5 antibodies. Cell lysates were also probed with anti-pAKT (Ser473) or anti-Akt antibodies. These results are typical of at least three experiments.
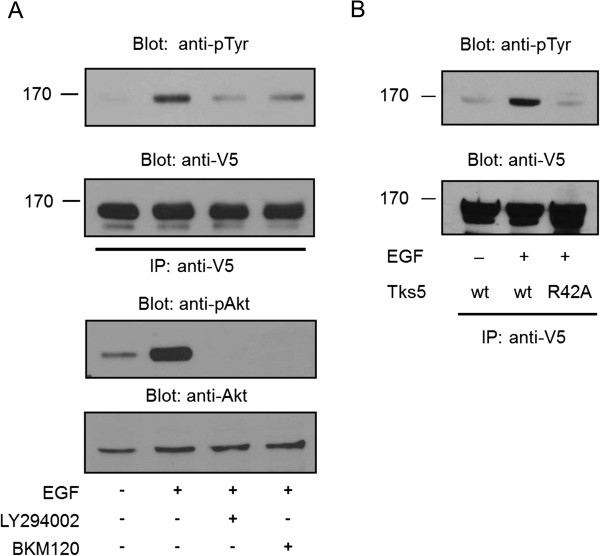
Figure 3
PI 3-kinase and intact PX domain are required for tyrosine phosphorylation of Tks5. (A) COS7 cells were transiently transfected with V5-Tks5 and after serum-starvation cells were stimulated with EGF or left untreated. Prior to stimulation the cells were treated with the PI 3-kinase inhibitors LY294002 and BKM120, respectively. Tks5 proteins were immunoprecipitated with anti-V5 antibody and subjected to anti-phosphotyrosine and anti-V5 immunoblots. Cell lysates were also probed with anti-pAKT (Ser473) or anti-Akt antibodies. (B) COS7 cells were transiently transfected with the V5-Tks5R42A construct and challenged with EGF. Cell lysates were then subjected to immunoprecipitation with anti-V5 antibody. Bound proteins were separated by SDS-PAGE, transferred to nitrocellulose, and probed with anti-phosphotyrosine and anti-V5 antibodies. These results are typical of at least three experiments.
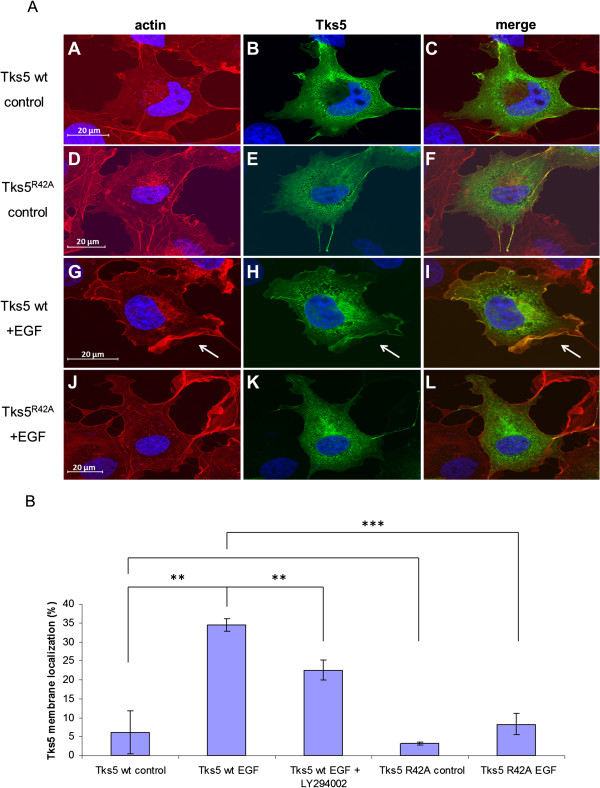
Figure 4
EGF induces membrane translocation of Tks5 in response to EGF treatment. (A) COS7 cells were transiently transfected with V5-Tks5 and after serum-starvation cells were stimulated with EGF (G, H, I) or left untreated (A, B, C). V5-Tks5R42A construct was also transiently expressed in the cells and after serum-starvation they were treated with EGF (J, K, L) or left untreated (D, E, F). Cells were then fixed and processed for immunofluorescence. Subcellular localization of Tks5 was detected using V5-specific monoclonal antibody (B, E, H, and K). To visualize membrane ruffles, cells were also stained with TRITC-phalloidin (A, D, G, and J). Arrows indicate Tks5 present at the plasma membrane. The scale bar represents 20 μm. (B) Quantitative analysis of Tks5 translocation upon EGF treatment. COS7 cells were transiently transfected with V5-Tks5 and V5-Tks5R42A constructs and after serum-starvation cells were stimulated with EGF or left untreated. Prior to stimulation a part of the cells expressing V5-Tks5 were treated with the PI 3-kinase inhibitor LY294002 as indicated. The percentage of cells translocated to the plasma membrane under different conditions was quantified by an observer who was blinded to cell treatment status (n = 100 cells for each group per experiment). Error bars represent the Standard Error of the Mean, SEM. ***: p < 0.001, **: p < 0.005